3D data visualization offers an immersive approach to data analysis, enabling users to perceive and interact with complex datasets in ways that flat, 2D visualizations cannot match. One such advanced tool is FineVis, a module of FineReport, designed specifically for creating dynamic 3D visual displays on large screens. This functionality is crucial for professions requiring detailed spatial analysis, such as urban planning, scientific research, and complex data interpretations. However, it's essential to download FineReport first to access FineVis, ensuring seamless integration within a broader analytical suite. As industries increasingly recognize the value of three-dimensional data perspectives, tools like FineVis are pivotal in transforming data exploration into an intuitive, in-depth analytical process.
All the 3D dashboards in this article are created with FineVis, a leading 3D visualization tool. Click the button below to try FineVis for free and kick-start your data visualization journey!
Enhanced Data Comprehension with 3D Data Visualization
Intuitive Understanding of 3D Data Visualization
Visualizing Multidimensional Data
3D data visualization greatly enhances the comprehension of complex datasets by incorporating a third dimension. This not only allows for a more accurate perception of spatial relationships but also offers a more immersive experience. Users can explore data from multiple perspectives, revealing intricate details and insights that might be obscured in traditional 2D views. With tools like FineVis, this becomes particularly impactful as it enables detailed and dynamic large screen visualizations that are crucial for presentations and detailed data analysis. The integration within FineReport ensures that users have a streamlined experience from data processing to visualization, though it requires downloading FineReport first before accessing FineVis capabilities.
Recognizing Patterns and Trends
The addition of a third dimension is especially useful in identifying patterns and trends that might not be evident in 2D representations. By allowing users to interact with the data spatially, 3D visualization helps in intuitively understanding complex correlations and connections, thus enhancing decision-making processes. For FineVis, this capability is vital in rendering detailed and interactive visual representations that are easy to manipulate and understand, making it a suitable tool for both business intelligence and scientific research where pattern recognition is crucial.
In light of current trends and best practices in 3D data visualization, FineVis stands out by offering specific functionalities tailored for large screens and complex data sets, providing users with powerful tools to manipulate and understand data in ways that traditional 2D methods cannot match. This aligns with broader industry movements towards more interactive, intuitive, and immersive data visualization solutions as noted in recent technological advancements and software developments
Engaging Presentations of 3D Data Visualization
Capturing Audience Attention
3D data visualization uniquely captivates the audience by offering a visually appealing and engaging way to present data. The dynamic nature of 3D visuals not only draws viewers in but also makes complex information more accessible and memorable. This effect is particularly valuable when presenting intricate data to stakeholders, ensuring they stay interested and engaged throughout the discussion. FineVis, a module of FineReport, excels in this domain, especially with its large-screen 3D visualization capabilities, which provide immersive experiences that are hard to replicate with traditional 2D displays, which integrates seamlessly, enhancing the visualization capabilities of both FineReport and broader business intelligence tools.

Simplifying Complex Concepts
With the power of 3D data visualization, particularly through FineVis, simplifying and conveying complex concepts becomes more intuitive. By offering a three-dimensional perspective, FineVis allows users to explore intricate data structures in a more accessible and understandable format. This interactive representation aids in breaking down complex information into digestible parts, which is essential for effective communication among team members and stakeholders. While both FineReport and BI tools support 3D visualization, FineVis is specially tailored for immersive 3D experiences, enhancing its suitability for detailed and complex data analyses.
Why Choose FineVis?
FineVis is designed to cater to the specific needs of users requiring advanced 3D data visualization capabilities. It stands out in the competitive landscape for its ability to integrate seamlessly with existing business intelligence frameworks, providing not just tools for visualization but also for comprehensive data analysis and decision support. The specialized features of FineVis support a range of business applications, from marketing intelligence to operational management, making it an indispensable tool for businesses looking to leverage data visualization for strategic advantage.
Better Representation of 3D Data Visualization with FineReport
Handling Large Datasets
Visual Clarity in Dense Information
When you deal with large datasets, maintaining clarity becomes crucial. FineReport excels in providing visual clarity even when information is dense. By incorporating the third dimension, you can separate layers of data, making it easier to distinguish between different elements. This separation enhances your understanding and allows you to focus on specific details without losing sight of the bigger picture. The 3D data visualization capabilities of FineReport ensure that you can navigate through complex datasets with ease, revealing hidden patterns and trends that might otherwise remain unnoticed.
Layered Data Analysis
With FineVis, 3D visualization becomes more than just a display technique—it transforms into an analytical tool. Users can stack and manipulate data layers within FineReport to uncover and explore complex relationships within the data. This capability is crucial for conducting in-depth analyses and making informed decisions. By providing tools to manipulate these layers, FineVis supports a dynamic exploration of data, allowing users to highlight and delve into specific trends or anomalies.
Incorporating best practices and latest developments, such as those from Khronos’ ANARI API, can further enhance FineVis’s functionalities by enabling easier scene creation and rendering processes, which are essential for handling large-scale 3D visualizations. These improvements reflect a growing trend towards more collaborative and interoperable visualization environments, as seen in current industry movements towards standardization and open-source solutions.
By focusing more on these advanced capabilities and aligning with industry standards, the article can effectively position FineVis as a cutting-edge tool for 3D data visualization, crucial for today’s data-intensive applications.
Multivariate Analysis
Simultaneous Variable Representation
Multivariate analysis significantly benefits from the ability to represent multiple variables simultaneously. FineReport, particularly through its FineVis module, excels in providing tools that visualize several variables at once. This not only offers a holistic view of the data but also highlights correlations and interactions between variables effectively. The 3D visualization capabilities of FineVis, accessible only after downloading FineReport, enable users to explore these relationships from various angles, offering insights that 2D visualizations simply cannot match. This comprehensive perspective is vital for data-driven decision-making in fields ranging from scientific research to marketing intelligence.
Interactive Exploration
Interactive exploration stands out as a cornerstone of 3D data visualization. Users can interact with their data in real-time, adjusting parameters to see changes instantaneously. This dynamic interactivity is crucial for hypothesis testing and scenario exploration, which in turn fosters deeper analytical insights. FineReport enhances the user experience by transforming data exploration into an engaging and interactive process, crucial for effective decision-making and enhanced understanding across various applications such as product design, engineering simulations, and educational tools.
Improved 3D Data Visualization with FineBI
Faster Insight Generation
Real-Time Data Interaction
FineVis, integrated within FineReport, elevates real-time data interaction through its advanced 3D data visualization capabilities, allowing you to instantaneously connect with your data for immediate feedback and analysis. This dynamic interaction aids in swiftly pinpointing trends and patterns, potentially unnoticed in traditional analyses. The incorporation of a third dimension not only provides a richer, more textured view of the data sets but also amplifies understanding, thus accelerating decision-making processes. This feature is particularly enhanced in large-screen 3D visualizations, where data comes alive, making it easier for stakeholders to grasp complex information swiftly and accurately.
Scenario Simulation
Scenario simulation via FineVis empowers users to delve into diverse data-driven scenarios within FineReport's framework. This function enables the prediction of outcomes and evaluation of potential impacts on business operations, fostering a proactive data analysis culture. The interactive 3D visualizations, which are a hallmark of FineVis, facilitate multi-angle explorations of complex scenarios, significantly boosting analytical depth. Such capabilities are indispensable for strategic planning and informed decision-making, providing a robust toolset for businesses to navigate future uncertainties with greater confidence.
These enhancements focus on leveraging the full potential of FineVis's 3D visualization features, particularly in settings that benefit from large-screen displays and immersive, interactive data experiences
Enhanced Collaboration
Shared Visual Understanding
FineBI and FineVis by FanRuan provide powerful 3D data visualization capabilities that enhance collaboration and improve the understanding of complex data across teams. FineBI offers interactive and customizable dashboards, with a focus on facilitating collaboration through features that allow multiple users to edit dashboards simultaneously and share their reports effortlessly. This promotes effective communication by ensuring all team members are aligned and can make informed decisions together.
FineVis, specifically, elevates these capabilities with its advanced 3D visualization tools, which are designed to make data storytelling more impactful. Users can create dynamic 3D models and visualizations without the need for coding, leveraging built-in chart types and an intuitive drag-and-drop interface. This not only aids in presenting complex information in an easily digestible manner but also caters to varying expertise levels within a team, making it accessible to all users.
Moreover, FineVis's large screen 3D visualizations are particularly powerful, supporting the display of data in high detail and on a grand scale, which is ideal for exhibition halls or large meeting spaces. This feature ensures that data presentations are both visually impressive and highly informative, enhancing the viewer's engagement and understanding.
In summary, both FineBI and FineVis offer robust solutions to enhance data visualization and collaboration within organizations. FineVis's specialized 3D visualization tools, in particular, provide a significant advantage for users needing to communicate complex datasets in a compelling and accessible manner.
Cross-Disciplinary Communication
FineBI revolutionizes cross-disciplinary communication by enabling effortless creation and sharing of dynamic visualizations and dashboards, catering to users across various expertise levels. It supports a wide range of visual tools, such as graphs and interactive charts, on multiple platforms including large LED displays, which facilitates collaborative analysis and discussion. With features like code-free data integration and automated chart recommendations, FineBI simplifies data handling, making it accessible for all users to perform complex analyses. This platform enhances organizational decision-making by translating intricate data into clear, actionable insights, thereby streamlining business operations and boosting overall efficiency.
Practical Examples of 3D Data Visualization in FanRuan
Industry Applications
Healthcare and Medical Imaging
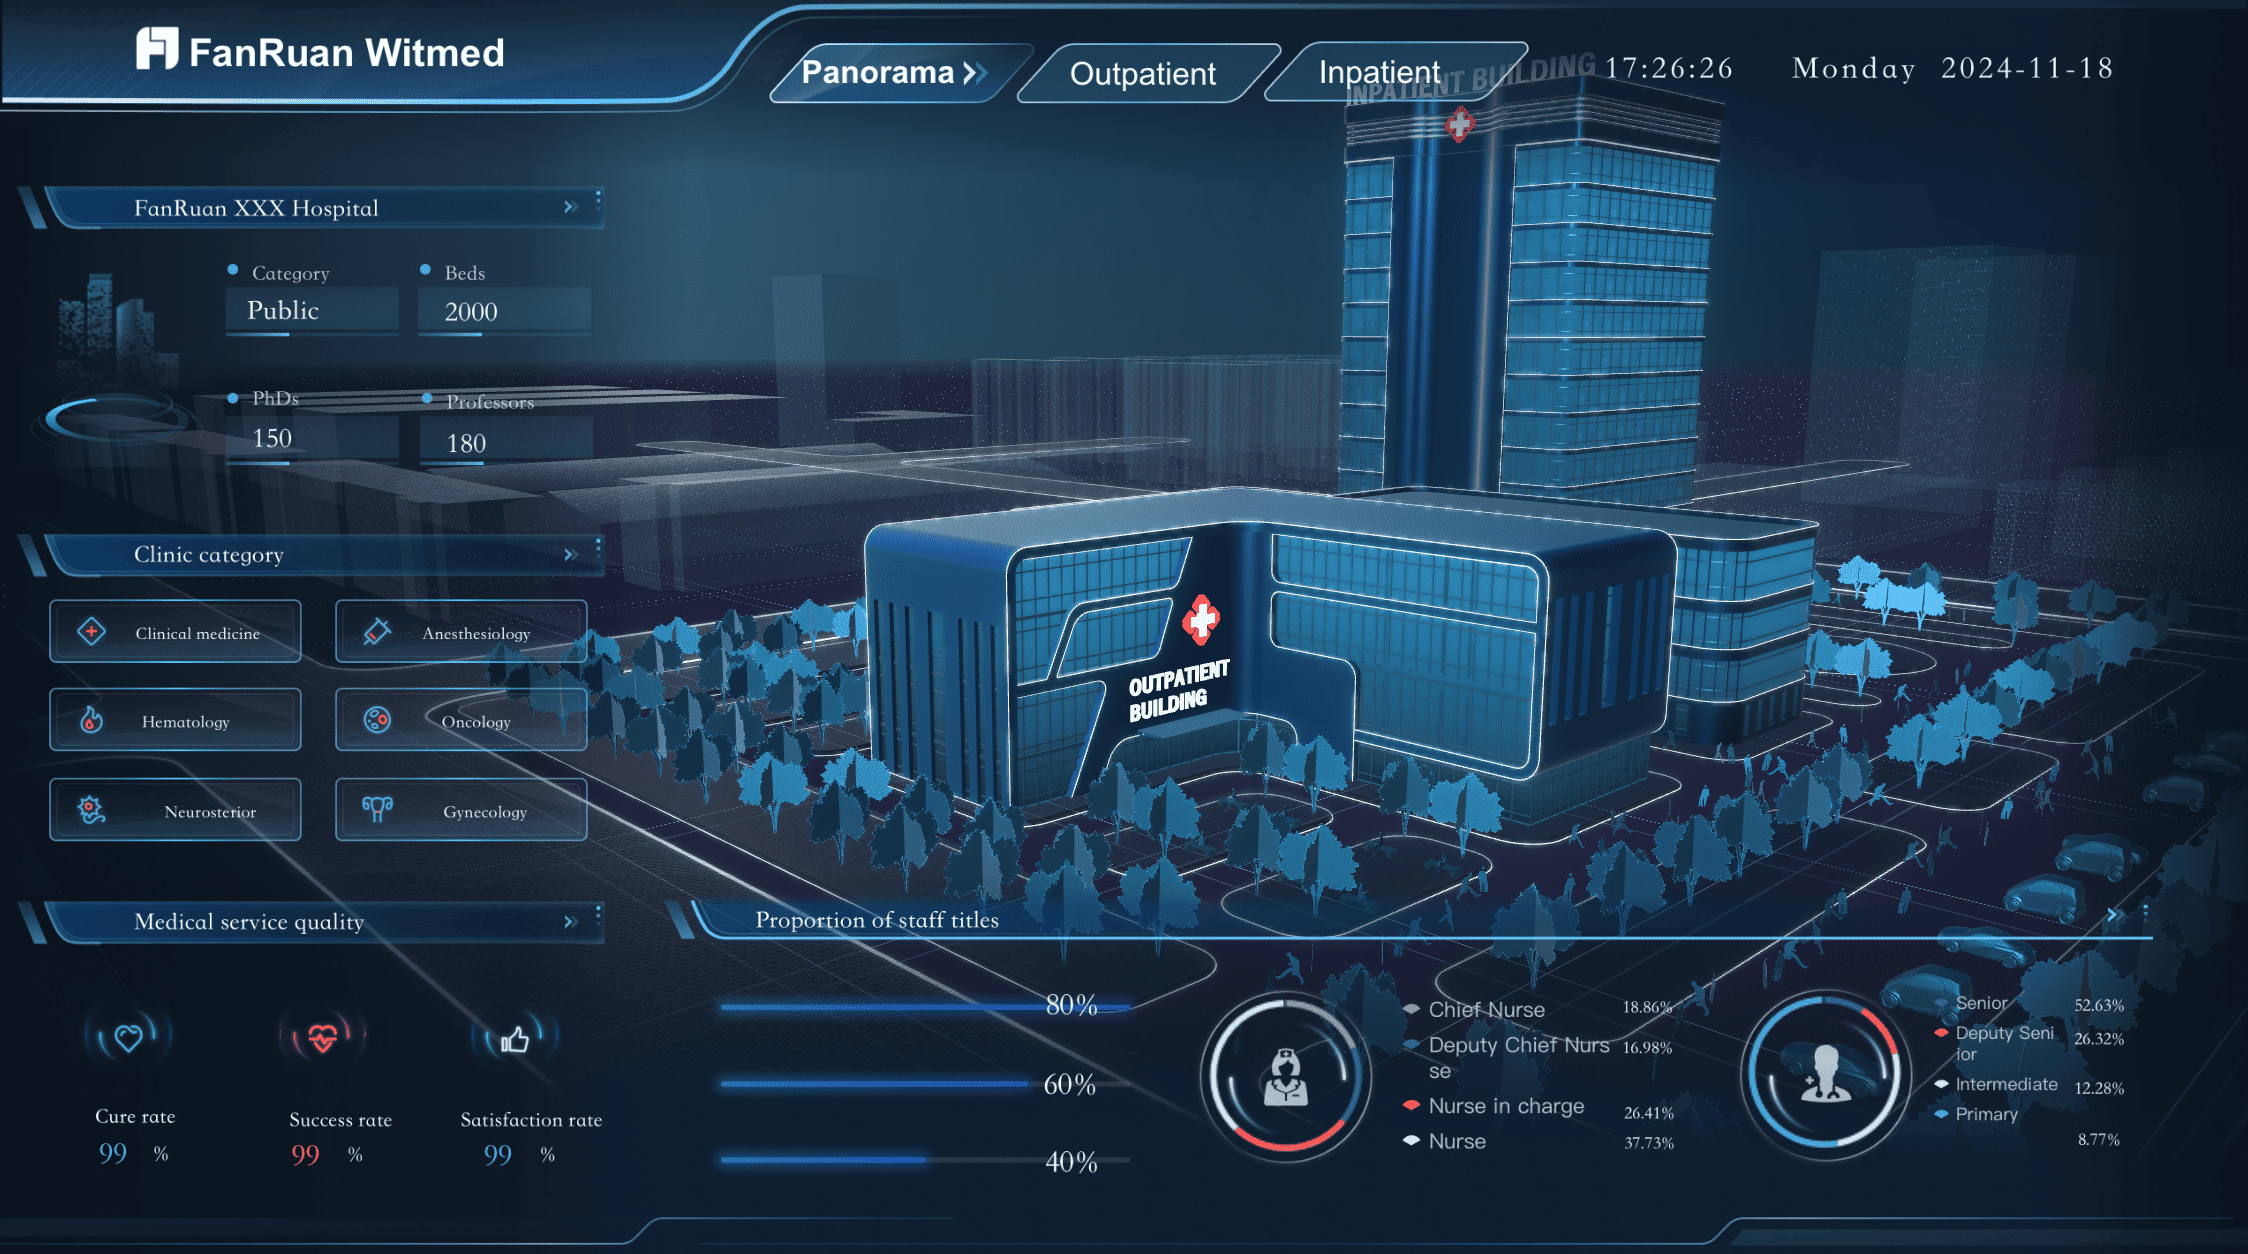
In healthcare, 3D data visualization is revolutionizing medical imaging by providing intricate visual representations of the human body, significantly enhancing diagnostic precision and treatment strategies. For instance, utilizing FineVis's capabilities, professionals can leverage state-of-the-art 3D visualization on large screens, offering a more detailed analysis of complex anatomical structures. This technology not only facilitates a deeper understanding of various health conditions but also supports comprehensive decision-making by highlighting subtle nuances in patient data that might not be evident in traditional imaging methods.
FineVis excels in delivering these advanced visualizations by integrating features like interactive 3D models, which are crucial for exploring detailed medical scans such as MRIs and CTs. These models allow doctors to manipulate the data in three dimensions, providing a clearer perspective of the patient's anatomy and any anomalies present. Such capabilities ensure that healthcare professionals can make more informed decisions, tailor treatments more effectively, and predict outcomes with greater accuracy.
The emphasis on 3D visualization in medical imaging, as seen in FineVis's offerings, is a testament to how digital innovation is pushing the boundaries of medical science, transforming diagnostics and patient care by merging technological advancement with medical expertise.
Financial Market Analysis
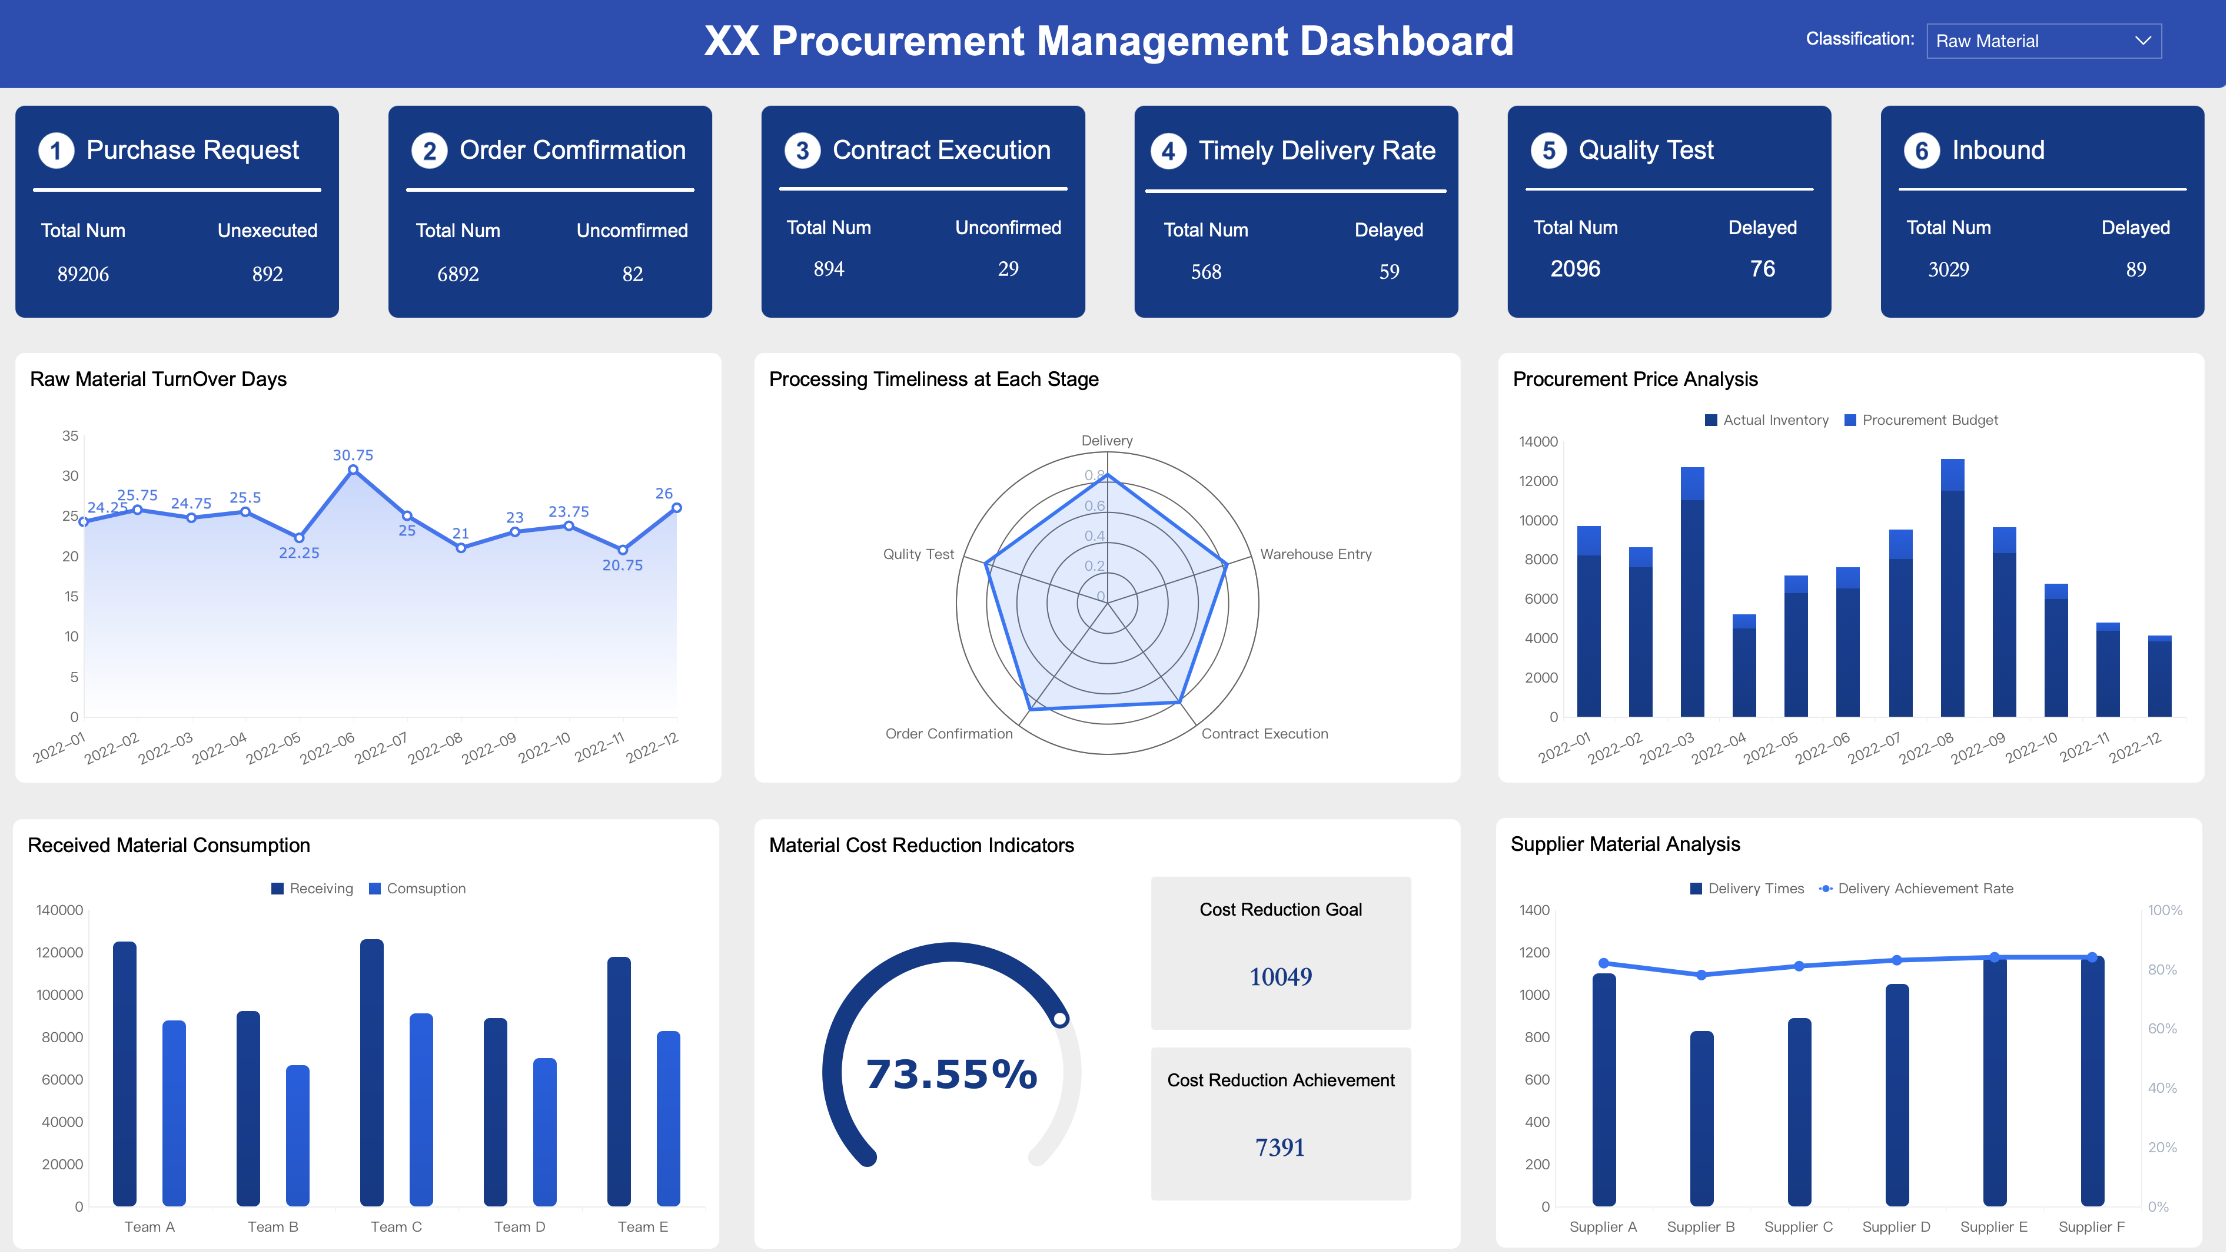
Financial market analysis greatly benefits from the integration of advanced 3D visualization techniques, particularly through tools like FineVis, which specializes in large-screen 3D visualizations. This technology allows analysts to explore financial data from multiple perspectives, enriching the interpretation of market dynamics and trends. With FineVis, users can delve into complex financial data sets, revealing hidden correlations and anomalies that are less discernible in traditional 2D representations. Such depth of analysis supports more informed decision-making in investment and strategy formulation.
Enhanced visualization not only aids in understanding the current market status but also in forecasting future market behaviors. By employing 3D visualization, financial analysts can better predict price movements and volatility, thereby optimizing investment strategies to align with anticipated market developments. This approach is supported by a mix of fundamental and technical analysis methodologies, which together provide a robust framework for evaluating securities and market conditions. Fundamental analysis focuses on economic indicators and financial ratios to assess asset values, while technical analysis helps in identifying patterns and trends that suggest future movements.
FineVis's capabilities can be particularly useful in enhancing presentations and strategic discussions, where dynamic and interactive 3D models offer a compelling narrative tool for illustrating complex financial theories and market behaviors. This makes it an invaluable asset in high-stakes environments where clear and impactful communication of financial data is crucial.
Case Studies
Successful Implementation Stories
FineVis, a product by FanRuan, is revolutionizing the data visualization landscape with its agile and intuitive platform. Primarily tailored for industries such as real estate, it leverages powerful 3D visualization capabilities to enhance architectural presentations and marketing efforts. This tool allows potential buyers to interact with properties before they are built, creating a unique and immersive experience that significantly boosts buyer engagement and helps secure investments.
FineVis's sophisticated technology enables users to generate dynamic 3D visualizations with ease, without the need for coding. Users can import GeoJSON and GLB files for customizable 3D effects, or choose from a library of pre-built models for rapid visualization creation. This versatility not only empowers real estate marketers to showcase high-quality renders of future projects effectively but also provides them with a competitive edge by enhancing the attractiveness of their presentations to potential investors and clients
Lessons Learned
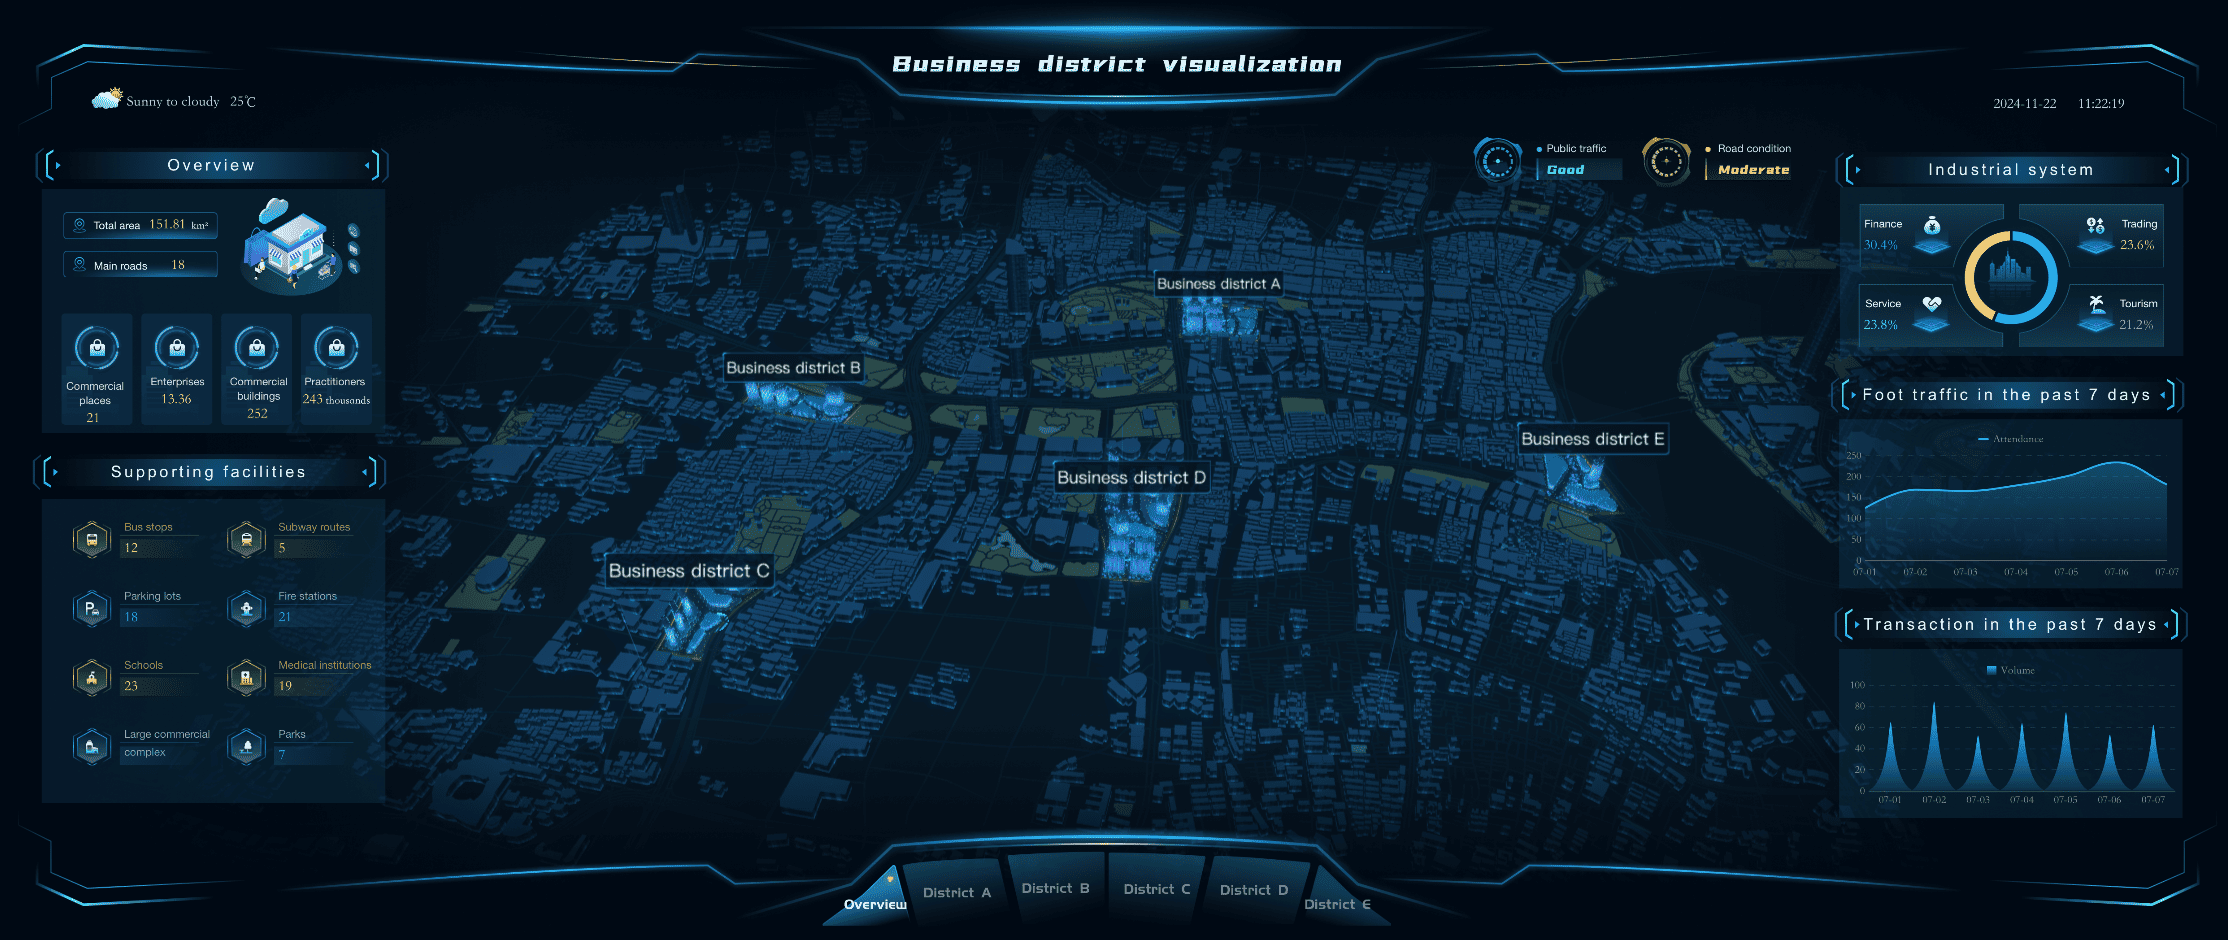
In the realm of design and architecture, choosing the right 3D visualization software from the start is crucial to fully leveraging its capabilities, ensuring efficiency, quality, and resource management throughout the project. FineVis, with its robust features including large screen 3D visualizations, excels in bringing architectural and design ideas to life in photorealistic detail. This tool enhances understanding and facilitates communication among all stakeholders, making it easier to convey complex concepts and align visions with client expectations. By integrating interactive 3D visualizations, FineVis simplifies the presentation of complex data, which is especially valuable in fields requiring detailed spatial analysis like BIM and IoT.
The ability to visualize data in 3D not only supports better decision-making but also enhances stakeholder engagement by providing a tangible sense of the proposed designs or plans. This approach is instrumental in architecture and urban planning, where visual fidelity and detail can significantly impact client satisfaction and project outcomes.
Overcoming Challenges in 3D Data Visualization
Avoiding Misinterpretation
Ensuring Accurate Data Representation
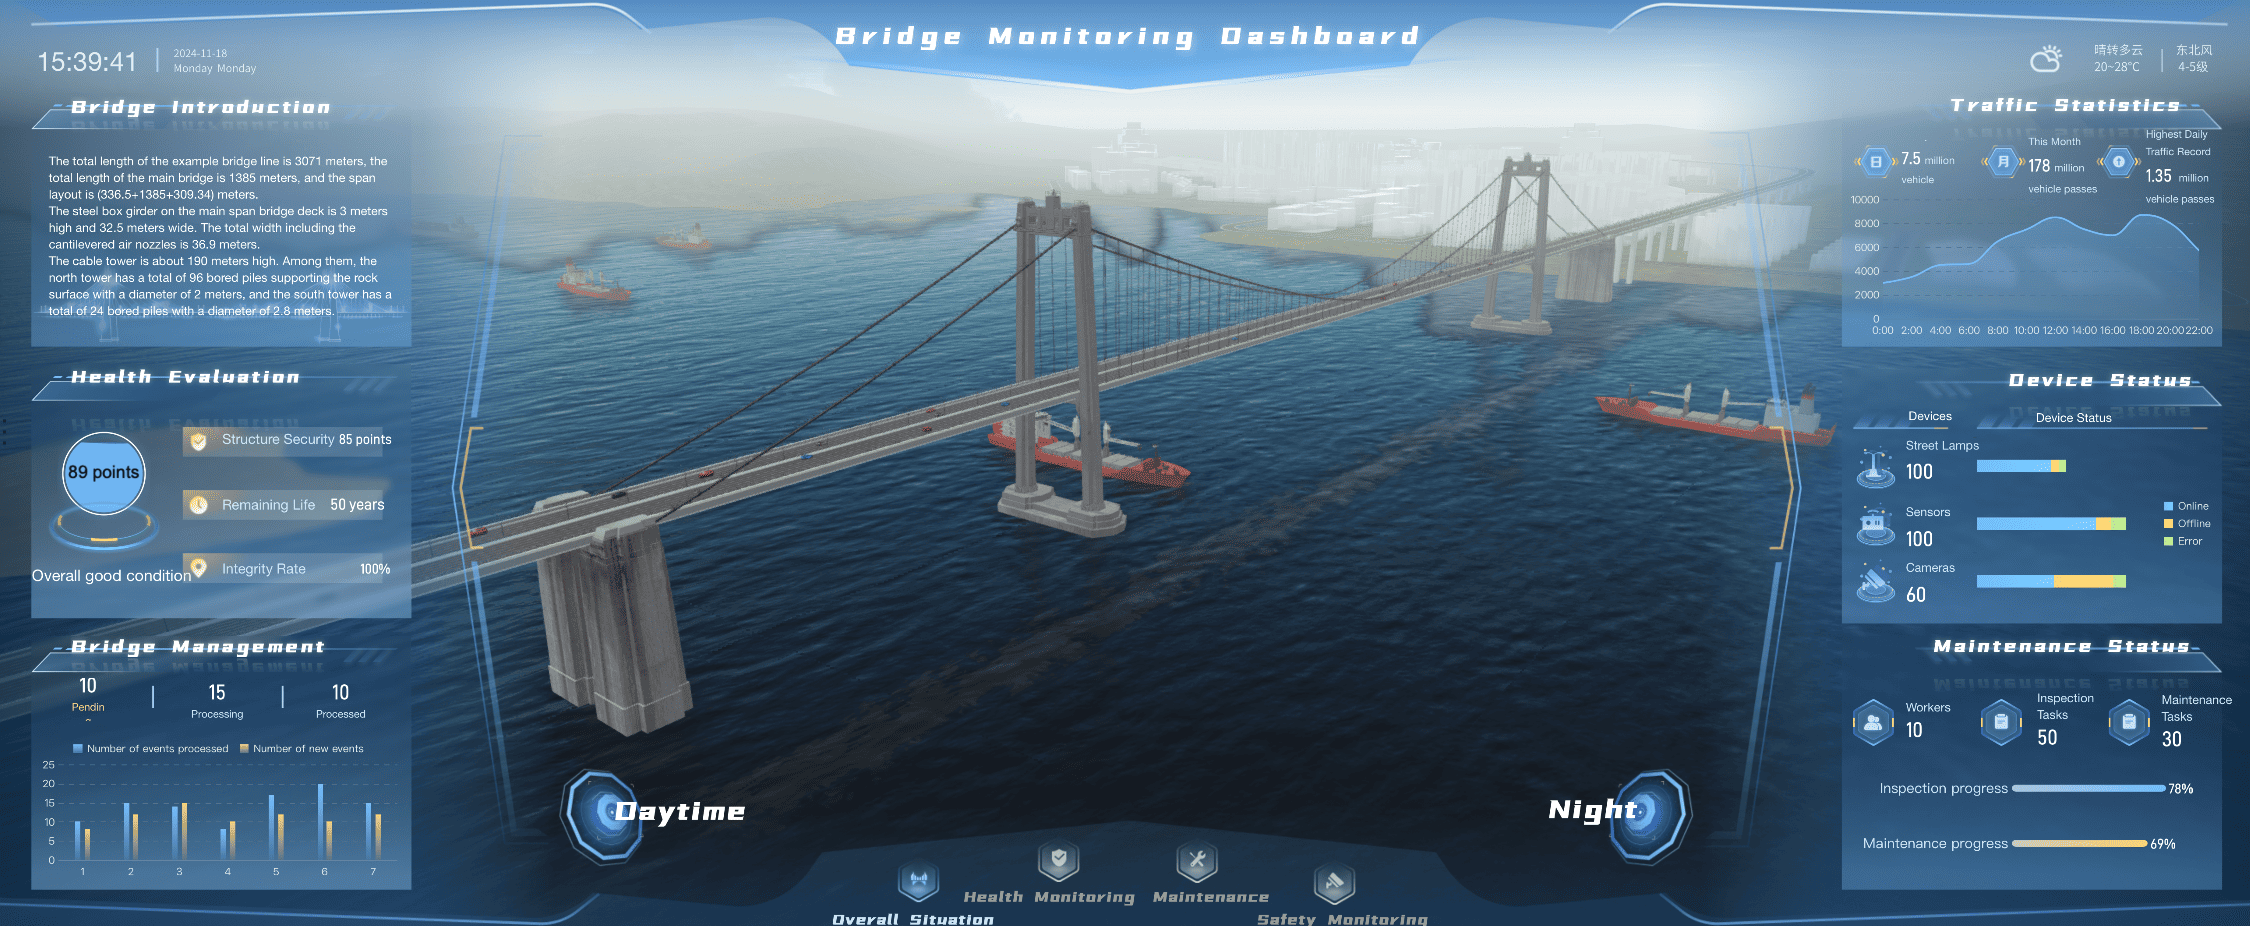
In enhancing the understanding of 3D visualization for accurate data representation, it is essential to focus on the capabilities of advanced tools like FineVis, especially its proficiency in large-screen 3D visualizations. 3D visualization not only facilitates the comprehension of spatial relationships but also plays a pivotal role in preemptively identifying potential design and structural issues across various industries, including architecture and engineering. This preemptive capability can lead to significant time and cost savings by addressing problems before they materialize in physical constructions.
Furthermore, the integration of AI within platforms like FineVis enhances the creation and manipulation of 3D models, making these tools more efficient and reducing the manual effort involved. This integration allows for more dynamic and interactive representations, which are crucial for making informed decisions. Real-time visualization, as facilitated by FineVis, ensures that models and data representations are not only accurate but also instantly updatable, reflecting changes as they occur, which is indispensable in fast-paced project environments.
By harnessing the power of FineVis for large-screen 3D visualizations, users can achieve a deeper understanding of complex data, making it an essential tool for industries that rely heavily on spatial data and accurate, real-time representations.
Balancing Complexity and Clarity
In the realm of 3D data visualization, striking the right balance between complexity and clarity is paramount. This balance ensures that while the visual representation is comprehensive, it remains accessible and interpretable to users. FineVis excels in this area, particularly with its large-screen 3D visualization capabilities, which simplify complex data sets into clear, actionable insights.
FineVis leverages advanced 3D visualization tools that enhance user understanding without overwhelming them with unnecessary graphical embellishments. It emphasizes clean and efficient visualization techniques that avoid the pitfalls of over-complication, which can obscure essential data points. Instead of adding gratuitous 3D effects, FineVis focuses on delivering precise and succinct visual representations that aid in quick and effective data comprehension.
This approach aligns with leading practices in the industry where the best 3D visualization software combines interactive graphics, real-time analysis, and user-friendly interfaces, as seen with platforms like Plotly and Vaa3D. FineVis embodies these principles by providing a powerful visualization platform that not only represents data in a three-dimensional space but also allows for interactive exploration, making it an invaluable tool for data-driven decision-making.
Technical Considerations
Software and Hardware Requirements
To effectively implement 3D visualization, especially for robust applications like large-screen 3D visualizations, it's essential to have the appropriate software and hardware setup. FineVis, known for its powerful functionality in this area, supports the creation of detailed and immersive 3D visual experiences. The software leverages advanced rendering technologies and is designed to handle complex models efficiently, making it a suitable choice for intricate 3D projects.
A key advantage of using FineVis is its capability to produce high-quality visual content that can enhance your data analysis and presentation needs. This is particularly valuable in environments where making a visual impact is crucial, such as in presentations to stakeholders or in marketing materials. The software's ability to integrate with existing systems and its support for various file formats ensures a seamless workflow, thereby improving productivity and collaboration across teams.
Additionally, investing in robust graphics processing units (GPUs) and ensuring your system meets the necessary specifications is critical. These elements are vital to handle the demanding nature of real-time 3D rendering and visualization, ensuring smooth operation and high performance
User Training and Support
User training and support are critical in maximizing the effectiveness of 3D visualization tools like FineVis, particularly when dealing with complex, large-scale 3D visualizations. Comprehensive training sessions should be designed not only to help users grasp the fundamentals of interacting with 3D models—such as rotating, zooming, and viewing from various perspectives—but also to delve into more advanced features specific to FineVis. These might include customizing data displays and utilizing the software’s powerful real-time rendering capabilities to create immersive visual narratives.
Ongoing support and resources are equally important, ensuring that users can resolve issues quickly and continue to evolve their skills in data manipulation and visualization. Engaging training materials, interactive help sections, and responsive customer support play a significant role in fostering a productive learning environment. This approach not only enhances user proficiency but also empowers teams to leverage 3D visualization more effectively in their decision-making processes, thereby optimizing operational workflows and elevating project outcomes.
Comparing 2D and 3D Data Visualization with FineVis
When to Use 3D
Situations Benefiting from 3D
To optimize the effectiveness of your content, integrating FineVis's capabilities, particularly its 3D large-screen visualization, will significantly enhance user engagement. This tool is designed to facilitate a more immersive and interactive experience, making it ideal for fields that benefit from a spatial understanding, such as architecture, engineering, and gaming. With 3D visualization, users can manipulate data through rotations, zooming, and navigating within the three-dimensional space, providing a depth of perspective that is unachievable with 2D visuals. This not only improves the comprehensibility of complex structures but also enriches the analysis, allowing for a deeper insight into the data presented.
3D visualization's value is emphasized across multiple platforms and industries, where the ability to visualize products and architectural designs in high detail leads to better stakeholder engagement, enhanced communication, and more effective presentations. By leveraging FineVis in this capacity, you can offer an enriched, detailed view that elevates the overall user experience and aids in more informed decision-making processes.
Limitations of 2D Visualization
While 2D visualization offers simplicity, it often falls short in fully conveying the depth and dynamics present in spatial data. 3D visualization, on the other hand, provides an enhanced perspective that is crucial in industries such as architecture, engineering, and entertainment, where understanding spatial relationships and interactive experiences is key. Tools like Autodesk's 3ds Max and Maya are well-regarded for their ability to create detailed, photorealistic 3D models and animations, which are used extensively across various fields to produce more engaging and informative visual content.
FineVis steps into this realm with specialized functionalities tailored for large screen 3D visualization, distinguishing itself with its capability to deliver immersive experiences that are not only visually impressive but also interactive. This makes it a valuable tool for presentations and marketing, where making a lasting impression is essential. FineVis's ability to render complex 3D scenes in real-time allows users to explore and interact with data in a way that 2D visualization cannot match, offering a more comprehensive understanding and a stronger impact in decision-making processes.
Cost-Benefit Analysis
Resource Investment
When implementing 3D visualization, the choice of software like FineVis can be pivotal, especially for large screen 3D visualizations. FineVis, similar to other leading platforms such as Autodesk and ArcGIS, supports comprehensive design processes but with a distinct emphasis on enhancing user engagement through photorealistic renderings and interactive experiences. These capabilities not only allow for detailed visual representations but also facilitate a deeper understanding and interaction, which can be particularly useful in architecture, engineering, and construction industries. The investment in such technology, although initially higher than traditional 2D solutions, is justified by the advanced data analysis and effective visualization capabilities it offers, enhancing both the design quality and the communication of complex ideas effectively.
Expected Returns
3D visualization enhances our ability to understand and interact with complex data, particularly beneficial in fields like architecture, engineering, and science. FineVis, specializing in large-screen 3D visualization, provides a competitive advantage by enabling detailed, immersive interactions with data. Its real-time manipulation of 3D models aids strategic decision-making and fosters innovation. Moreover, FineVis's capabilities streamline collaborative efforts, ensuring teams share a visual context, aligning project visions efficiently. This technology not only boosts communication but also helps in spotting potential design issues early, leading to significant cost savings and more accurate project outcomes.
Implementing 3D Data Visualization Effectively with FanRuan Tools
Best Practices
Choosing the Right Tools
FineVis by FanRuan stands out as a premier choice for dynamic and immersive 3D data visualization. This tool is designed to cater to users requiring advanced visualization capabilities without the need for coding, featuring a user-friendly drag-and-drop interface that simplifies the creation and customization of visualizations across different devices, including mobile and large screens. It seamlessly integrates with FineReport and FineBI, offering a comprehensive suite for detailed analytics and decision-making.
FineVis supports the creation of customizable dashboards and real-time data integration, making it ideal for business intelligence applications. It excels in various industrial environments, enabling users to easily control presentations remotely and adapt visual content to diverse settings. Whether for detailed data presentations in corporate settings or expansive displays in public exhibitions, FineVis equips users with powerful tools to effectively transform complex data into insightful, actionable visual stories.
Designing User-Friendly Interfaces
FineVis excels in creating user-friendly interfaces for large-screen 3D visualizations, enhancing the ease of interacting with complex data. It prioritizes human-centered design principles, focusing on intuitive controls and clear labeling to minimize user confusion and cognitive load. Incorporating advanced 3D interface technologies like spatial tracking and eye-tracking further streamlines user interactions, making them more natural and efficient. By simplifying navigation and emphasizing clarity, FineVis improves user understanding and engagement, crucial for effective decision-making and communication. These features demonstrate FineVis's capability to deliver high-quality, customizable 3D visual experiences tailored to meet specific user needs.
Common Pitfalls to Avoid
Overcomplicating Visuals
In today's competitive landscape, leveraging advanced tools like FineVis for 3D data visualization can significantly enhance your presentations and decision-making processes. FineVis, with its robust 3D visualization capabilities, allows you to present complex data in an easily understandable format. It particularly excels in creating large-scale, high-resolution visualizations that bring data to life in a dynamic and engaging way.
By using FineVis, you can avoid overloading your visuals with unnecessary details, focusing instead on the core insights that matter most. This streamlined approach helps simplify complex concepts, ensuring that your audience grasps the essential information without visual overwhelm. With FineVis, you're equipped to deliver precise, impactful visual narratives that effectively communicate the key findings of your data analysis.
Ignoring User Feedback
To optimize your 3D visualization strategies, incorporating user feedback into the refinement process is crucial, especially when leveraging tools like FineVis for dynamic 3D visualizations on large screens. FineVis, known for its agile data visualization and real-time analytics, allows for interactive and customizable dashboards that enhance data storytelling capabilities. This tool enables stunning 3D visualizations without the need for coding, supporting a variety of formats such as GeoJSON and GLB files for detailed and adjustable 3D effects. Regular engagement with users to collect and integrate their experiences and insights can significantly improve the visualization functionality, making it not only more effective but also more attuned to user needs. By continuously adapting and enhancing the tool based on user feedback, you ensure that your 3D visualization efforts are both impactful and aligned with user expectations.
Click the banner below to experience FineReport for free and empower your enterprise to convert data into productivity!


FAQ

The Author
Lewis
Senior Data Analyst at FanRuan
Related Articles

10 Good Data Visualization Examples by Use Case: Sales, Surveys, Finance & Time-Series
If you are searching for $1 , you likely do not need another gallery of pretty charts. You need examples that help sales leaders hit targets, finance teams explain variance, operations managers monitor change, and analys
Yida Yin
Jun 15, 2026

12 Best Data Visualization Tools for 2026: Features, Pricing, Pros and Cons
$1 are software platforms that turn raw data into charts, dashboards, maps, and interactive visual stories for analysis and decision making. 12 best data visualization tools for 2026 at a glance
Lewis Chou
Apr 23, 2026

Top 8 Data Visualization softwares You Should Try in 2026
Compare the top 8 data visualization software for 2026, including FineReport, Tableau, Power BI, and more to find the best fit for your business needs.
Lewis
Mar 19, 2026