Are you ready to dive into the world of data analytics? Beginner-friendly data analysis projects are your gateway to mastering essential skills and building a standout portfolio. In 2026, data analysis ranks among the top 10 most in-demand skills globally, driven by industries relying heavily on data-driven decision making. Hands-on projects not only help you solidify your knowledge but also showcase your ability to tackle real-world challenges.
Solange van der Kolff’s journey proves how practical projects can transform your skills and open doors to career growth. A well-curated project portfolio demonstrates your knack for solving problems, making you irresistible to employers.
Whether it’s exploratory data analysis or time series data analytics, these projects sharpen your data cleaning, visualization, and processing abilities. They also teach you data visualization best practices, preparing you to deliver data-driven recommendations and insights. Ready to start? Let’s turn your data analytics portfolio into a masterpiece.
Key Takeaways on Data Analysis Projects
Start simple and stay focused: Choose easy, engaging projects like sales or health data analysis to build skills and confidence. Set clear goals to track progress and stay motivated.
Use accessible tools and real-world connections: Begin with tools like Excel, Google Sheets, or Python to make learning practical. Connect projects to real-life problems to add value and relevance.
Document and visualize your work: Record your steps and lessons to show growth and refine your approach. Use charts and graphs to tell compelling stories and enhance your portfolio.
What Makes Data Analysis Projects Beginner-Friendly?
Simplicity and Accessibility
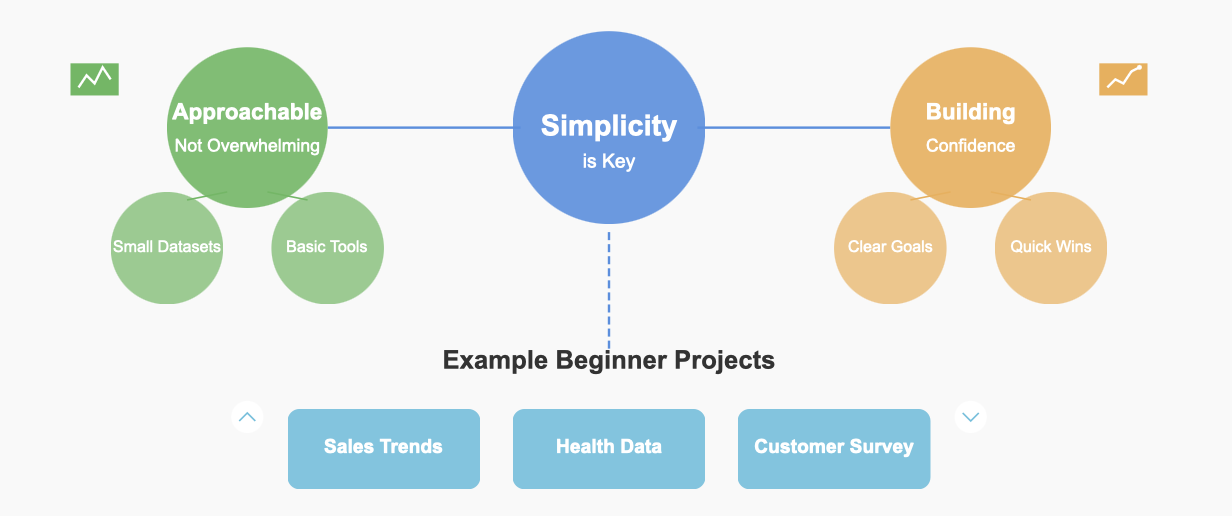
When you're starting out, simplicity is key. Beginner-friendly data analysis projects should feel approachable, not overwhelming. They often focus on smaller datasets or straightforward problems, making it easier for you to grasp the basics without feeling lost. For example, analyzing sales trends or exploring public health data are great starting points. These projects are accessible because they don’t require advanced tools or deep technical knowledge. Instead, they let you focus on understanding the data and building confidence.
Choose projects that excite you or align with your interests. Passion fuels learning, and when you're genuinely curious about a topic, you'll stay motivated. Whether it's analyzing movie ratings or exploring climate change data, pick something that sparks your curiosity. Remember, it's okay to start small. Each project, no matter how simple, adds to your skills and builds your confidence.
Tip: Start with datasets that are freely available online, like those on Kaggle or Google Dataset Search. These platforms offer a treasure trove of beginner-friendly options.
Use of Basic Tools and Skills
You don’t need to be a coding wizard to dive into data analytics. Many beginner-friendly projects rely on basic tools like Excel, Google Sheets, or Python libraries such as Pandas and Matplotlib. These tools are easy to learn and widely used in the industry, making them perfect for beginners. For instance, you can use Excel to clean and visualize data or Python to explore trends and patterns.
Here’s a quick list of beginner-friendly tools and projects to get you started:
Install Jupyter Notebook and explore datasets like Hacker News posts.
Use Excel to prepare data and create visualizations for stock market trends.
Analyze Kickstarter projects or startup fundraising deals using Python.
These tools help you build an efficient workflow while teaching you essential skills like data cleaning, visualization, and basic analytics. Plus, they’re accessible to anyone with a computer and an internet connection.
Pro Tip: Platforms like FanRuan offer tools like FineBI and FineVis, which simplify data integration and visualization. These tools are beginner-friendly and designed to make analytics accessible to everyone.
Clear Learning Objectives
Every successful project starts with clear goals. When you know what you’re trying to achieve, it’s easier to stay focused and measure your progress. For beginners, projects that emphasize data cleaning, data exploration, and visualization are ideal. These steps form the foundation of any data analysis project and help you develop skills that are in high demand.
Studies show that clarity in objectives significantly impacts the success of analytics projects. For example:
Study
Findings
Appelbaum et al. (2017)
Clear objectives are critical for project success.
When you set clear learning objectives, you can focus on mastering one skill at a time. Start by asking yourself questions like, “What insights do I want to uncover?” or “What story does this data tell?” This approach not only keeps you on track but also ensures that your projects are meaningful and impactful.
Note: Tools like FineDataLink can help you streamline data preparation and integration, making it easier to focus on your learning goals.
Relevance to Real-World Applications
When you work on data analysis projects, connecting them to real-world applications makes all the difference. It’s not just about crunching numbers—it’s about solving problems that matter. Employers love to see projects that demonstrate how you can apply your skills to real challenges. Plus, it’s way more exciting to work on something that feels meaningful, right?
Think about it. Would you rather analyze random numbers or uncover insights that could improve patient care, reduce fraud, or optimize supply chains? Real-world relevance adds purpose to your projects and helps you stand out in a competitive job market.
Here’s a quick look at how different industries use data analysis to tackle real-world problems:
Industry
Application
Impact
Finance
Big data analytics to minimize fraud instances.
Enhances security of online purchases and builds consumer confidence in financial institutions.
Marketing
Sentiment analysis using NLP and ML to gauge consumer attitudes.
Helps define marketing strategies and improve customer experiences.
Healthcare
Predictive analytics to improve patient care and operations.
Enhances patient outcomes and reduces healthcare costs.
Supply Chain
Demand forecasting for optimal stock management.
Minimizes wastage and meets consumer demands efficiently.
Now, imagine applying these concepts to your beginner projects. For example, you could analyze customer feedback to identify trends in consumer sentiment. Tools like FineBI make this process easier by offering self-service analytics and powerful visualization options. Or, you could explore public health data to uncover disparities in healthcare access. Platforms like FineDataLink can help you integrate and clean data from multiple sources, saving you hours of manual work.
Even small projects can have a big impact when they’re tied to real-world issues. For instance, analyzing sales data to identify seasonal trends can help businesses stock the right products at the right time. Similarly, exploring climate change data can reveal patterns that inform sustainability efforts. These projects don’t just teach you technical skills—they show you how to think critically and solve problems that matter.
Tip: Use tools like FInevis, one of the important modules of Finereport to create stunning visualizations that bring your findings to life. A well-designed chart or dashboard can make your insights more compelling and easier to understand.
By aligning your projects with real-world applications, you’ll not only build a stronger portfolio but also gain a deeper appreciation for the power of data. So, pick a project that resonates with you and start making an impact today!
Top Beginner-Friendly Data Analysis Projects for Your Portfolio
Analyzing Sales Data for Trends
Objective: Identify seasonal trends and top-performing products.
Sales data holds a treasure trove of insights. By analyzing it, you can uncover seasonal trends and pinpoint which products perform best. This project is perfect for beginners because it uses straightforward tools like Excel or Google Sheets. You’ll focus on data cleaning, visualization, and basic analytics to draw meaningful conclusions.
Why is this project so valuable? Let’s break it down:
Benefit
Description
Make better decisions
Sales analysis reveals the real-time success of sales plans, enabling data-driven approaches.
Understand market trends
It uncovers hot market opportunities and essential trends for maximizing efforts.
Boost company profits
Identifies high-quality leads and non-customers to enhance sales pitches and marketing strategies.
Imagine using tools like FineBI to create interactive dashboards that showcase your findings. FineBI simplifies data analysis and visualization, making it easier for you to present your insights in a professional way. This project not only strengthens your portfolio but also demonstrates your ability to make data-driven decisions.
You can try it out in the demo model below:
Exploring Public Health Data
Objective: Analyze health statistics to uncover patterns or disparities.
Public health data offers a fascinating way to learn data analysis. You can explore datasets to identify patterns, such as correlations between income levels and vaccination rates. For example, studies show a strong correlation (r = 0.68, p < 0.001) between these two factors. This project teaches you essential skills like data wrangling, visualization, and basic analytics.
Using Python libraries like Pandas and Matplotlib or R’s ggplot2, you can clean and process data to uncover meaningful insights. Alternatively, FineDataLink can streamline your data preparation by integrating and transforming data from multiple sources. This tool saves time and ensures your data is ready for analysis.
Public health projects are not just educational—they’re impactful. You’ll learn how to analyze real-world data while addressing meaningful issues like healthcare disparities. Plus, these projects look impressive in your portfolio, showcasing your ability to tackle socially relevant challenges.
Social Media Sentiment Analysis
Objective: Analyze tweets or posts to understand public sentiment on a topic.
Social media is a goldmine for data analytics projects. By analyzing tweets or posts, you can gauge public sentiment on trending topics. This project introduces you to text analysis, a skill that’s increasingly valuable in today’s data-driven world.
Start by using Python libraries like NLTK or TextBlob to process and analyze text data. If you’re looking for a more intuitive approach, FineChatBI offers conversational BI capabilities that simplify text analysis. It allows you to interact with your data through natural language queries, making the process more engaging.
Sentiment analysis projects are versatile. You can apply them to marketing, politics, or even entertainment. For instance, analyzing customer feedback can help businesses improve their products and services. This hands-on project not only enhances your technical skills but also demonstrates your ability to derive actionable insights from unstructured data.
Movie Ratings and Recommendations
Objective: Analyze movie ratings to create simple recommendations.
If you’re a movie buff, this project is a perfect way to combine your passion with learning data analysis. By analyzing movie ratings, you can uncover patterns and create simple recommendation systems. This project introduces you to basic statistics and data manipulation, making it an excellent choice for beginners.
Start by collecting a dataset of movie ratings. Platforms like Kaggle offer datasets that are easy to work with. For example, you could explore Fandango movie ratings to analyze potential biases or compare ratings from different years. Here’s a quick look at what such a project might involve:
Using Python libraries like Pandas and NumPy, you can clean and process the data. Tools like Jupyter Notebook or FineBI (available at FanRuan) make it easy to visualize your findings. FineBI, in particular, simplifies data analysis and visualization, helping you create interactive dashboards that showcase your insights.
This project not only teaches you essential skills but also adds a creative touch to your portfolio. Employers love seeing hands-on projects that demonstrate your ability to work with real-world data.
Exploring Climate Change Data
Objective: Visualize temperature changes over time and identify trends.
Climate change is one of the most pressing issues of our time, and analyzing related data can be both educational and impactful. In this project, you’ll visualize temperature changes over time to identify trends and patterns. It’s a great way to practice data cleaning, visualization, and storytelling.
Start by gathering climate data from sources like NASA or NOAA. Once you have the data, use Python libraries like Matplotlib and Seaborn to create visualizations. Alternatively, tools like Tableau or FineVis (available at FanRuan) can help you design stunning, interactive charts. FineVis, one of the important modules of Finereport, with its zero-code interface, is especially beginner-friendly and perfect for creating dynamic visualizations.
To understand the impact of your work, consider this data:
Year
Percentage of Americans Believing Global Warming is Happening
Percentage in Emery County, Utah
Percentage in Grand County, Utah
2021
72%
49%
71%
2022
72%
49%
71%
2023
72%
49%
71%
Visualizing such trends can make complex data more accessible and help raise awareness about climate change. This project not only enhances your data analysis and visualization skills but also demonstrates your ability to tackle socially relevant challenges.
Customer Feedback Analysis
Objective: Categorize and analyze customer feedback for insights.
Customer feedback is a goldmine of information. By analyzing it, you can uncover valuable insights that drive improvements in products and services. This project is ideal for beginners, as it focuses on text analysis and basic data processing.
Start by collecting feedback data from surveys, reviews, or social media. Use tools like Excel or Python libraries such as Pandas and NLTK to clean and categorize the data. If you’re looking for a more advanced approach, FineBI (available at FanRuan) offers powerful analytics features that simplify the process.
Here’s what you can achieve with customer feedback analysis:
Improve products and services by understanding customer needs.
Enhance satisfaction through active listening and corrective actions.
Drive innovation with suggestions for new features.
Prevent churn by addressing issues proactively.
Analyzing feedback not only sharpens your technical skills but also shows your ability to extract actionable insights from unstructured data. This project is a valuable addition to your portfolio, especially if you’re aiming for roles in business analytics or customer experience management.
How to Approach Beginner-Friendly Data Analysis Projects
Start with Clear Goals
Every successful data analysis project begins with a clear goal. Without a defined objective, it’s easy to lose focus or get overwhelmed. Ask yourself, “What do I want to achieve with this project?” Whether it’s uncovering trends, creating visualizations, or solving a specific problem, having a goal keeps you on track.
Clear goals also help you measure your progress. For example, if your goal is to analyze customer feedback, you can track how many reviews you’ve categorized or how many insights you’ve uncovered. Quantitative metrics make this process even easier.
Aspect
Importance in Goal Setting
Objective Assessment
Quantitative metrics provide an objective way to assess performance, enabling organizations to track progress over time.
Clear Benchmarks
They offer clear benchmarks for comparison, which is essential for setting and evaluating goals.
Data-Driven Decision Making
By analyzing quantitative data, businesses can identify patterns and trends that inform strategic planning.
The clarity of the pursued goal appears to be critical for the success of a data analytics project.
When you define your goals, you also make it easier to choose the right tools and datasets. For instance, if your goal is to create interactive dashboards, tools like FineBI can simplify the process. FineBI’s self-service analytics features allow you to focus on achieving your objectives without getting bogged down by technical complexities.
Break Down the Project into Steps
Big projects can feel intimidating, but breaking them into smaller steps makes them manageable. Start by outlining the main tasks. For example:
Define your project objective.
Choose a dataset that aligns with your goal.
Clean and prepare the data.
Analyze the data to uncover insights.
Create visualizations to present your findings.
This step-by-step approach keeps you organized and helps you focus on one task at a time. It’s like building a puzzle—each piece brings you closer to the final picture. Planning before you code is another smart strategy. Decide what tools you’ll use and how you’ll approach the analysis. Platforms like FineDataLink can streamline this process by integrating and preparing your data efficiently.
Starting small is also key. If you’re new to data analysis, begin with simple projects like analyzing sales trends or exploring public health data. As you gain confidence, you can tackle more complex challenges. Remember, every project is a learning opportunity, so don’t hesitate to seek feedback and iterate on your work.
Focus on Data Cleaning and Preparation
Data cleaning might not sound exciting, but it’s one of the most important steps in any project. Clean data ensures your analysis is accurate and reliable. In fact, poor data quality can lead to misleading findings and costly mistakes. That’s why spending time on data preparation is crucial.
Start by checking for missing values, duplicates, or inconsistencies in your dataset. Tools like Excel or Python libraries such as Pandas make this process easier. If you’re working with large datasets, consider using FineDataLink. Its real-time data synchronization and ETL capabilities help you clean and transform data efficiently.
Once your data is clean, focus on organizing it for analysis. For example, group similar categories, standardize formats, and remove irrelevant information. This step sets the foundation for effective data visualization and analysis. Tools like FineVis can then help you create stunning visualizations that bring your insights to life.
You can try it out in the FineVis demo model below:
By prioritizing data cleaning, you’ll avoid common pitfalls and ensure your project delivers meaningful results. It’s a skill that every data analyst needs, so take the time to master it.
Use Visualizations to Tell a Story
Visualizations are your secret weapon for turning raw data into compelling stories. They help you communicate complex insights in a way that’s easy to understand and remember. Think about it—would you rather sift through rows of numbers or glance at a colorful chart that tells the same story in seconds? That’s the power of visualizations.
When creating visualizations, choose techniques that match your data and goals. For example:
Survey Templates: Perfect for comparing responses by group or location.
Stacked Bar Charts: Great for showing agreement levels in Likert scale surveys.
Heatmaps: Ideal for visualizing multiple-choice responses across demographics.
Choropleth Maps: Best for highlighting regional differences in quantitative data.
Visualization Technique
Description
Survey Template
Ideal for datasets with one row per respondent, allowing comparisons by group and geographic location.
Stacked Bar Charts
Used to show Likert scale responses, illustrating agreement levels visually.
Heatmaps
Effective for displaying multiple choice responses across demographics.
Choropleth Maps
Useful for showing quantitative responses across regions, highlighting differences in opinions.
Visuals don’t just make your data look good—they make it meaningful. They’re essential for representing dense data in a way that’s easy to digest. Tools like FineVis can help you create stunning visualizations with zero coding. Whether you’re building a heatmap or a dynamic 3D chart, FineVis simplifies the process and ensures your visuals pack a punch.
Remember, every chart or graph should serve a purpose. Ask yourself, “What story am I trying to tell?” Then, design your visuals to highlight the key insights. A well-crafted visualization can turn your analysis into a narrative that resonates with your audience.
Tip: Use contrasting colors and clear labels to make your charts more readable. Simplicity is key—don’t overwhelm your audience with too much information in one graphic.
Document Your Process and Learnings
Documenting your process might not sound exciting, but it’s a game-changer for your growth as a data analyst. When you keep track of what you did, how you did it, and what you learned, you create a roadmap for future projects. Plus, it shows potential employers that you’re thorough and reflective.
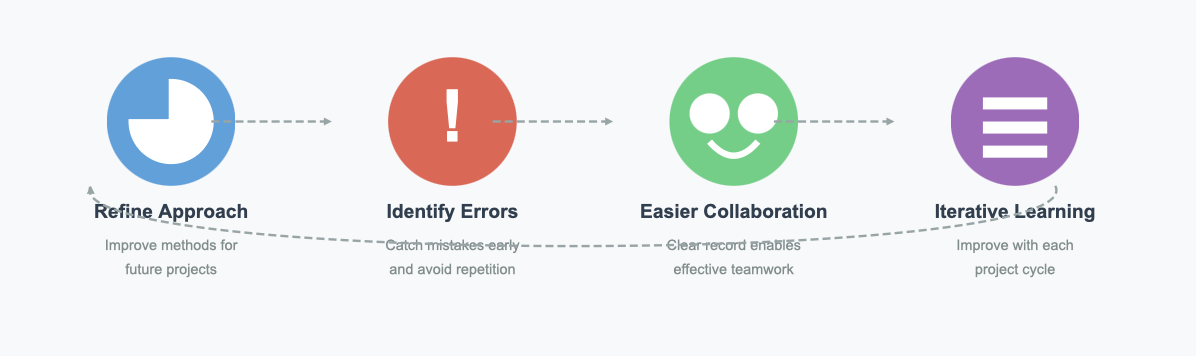
Here’s why documenting your process matters:
It helps you refine your approach in future projects.
You can identify costly errors early and avoid repeating them.
It makes collaboration easier by providing a clear record of your work.
Iterative learning becomes possible, allowing you to improve with each cycle.
Think of it as a journal for your data journey. Start by jotting down your project goals, the tools you used, and the steps you followed. After each iteration, note what worked, what didn’t, and what you’d do differently next time. This habit not only sharpens your skills but also builds a portfolio that tells a story of growth and adaptability.
For example, if you’re using FineDataLink to integrate and clean data, document how the tool streamlined your workflow. Highlight any challenges you faced and how you overcame them. This level of detail can set you apart when showcasing your projects to employers.
Pro Tip: Include visuals like screenshots or flowcharts in your documentation. They make your process easier to follow and add a professional touch.
By documenting your learnings, you turn every project into a stepping stone for the next one. It’s not just about completing tasks—it’s about growing as a data analyst and showing the world what you’re capable of.
Recommended Platforms and Tools for Data Analysis Projects
Platforms for Finding Datasets
Kaggle
Kaggle is a treasure chest for data enthusiasts. It offers thousands of datasets across various topics, from sports to healthcare. You can download datasets for free and even participate in competitions to test your skills. Kaggle also has a vibrant community where you can learn from others’ projects and share your own work. It’s a great place to start if you’re looking for inspiration or want to explore real-world data.
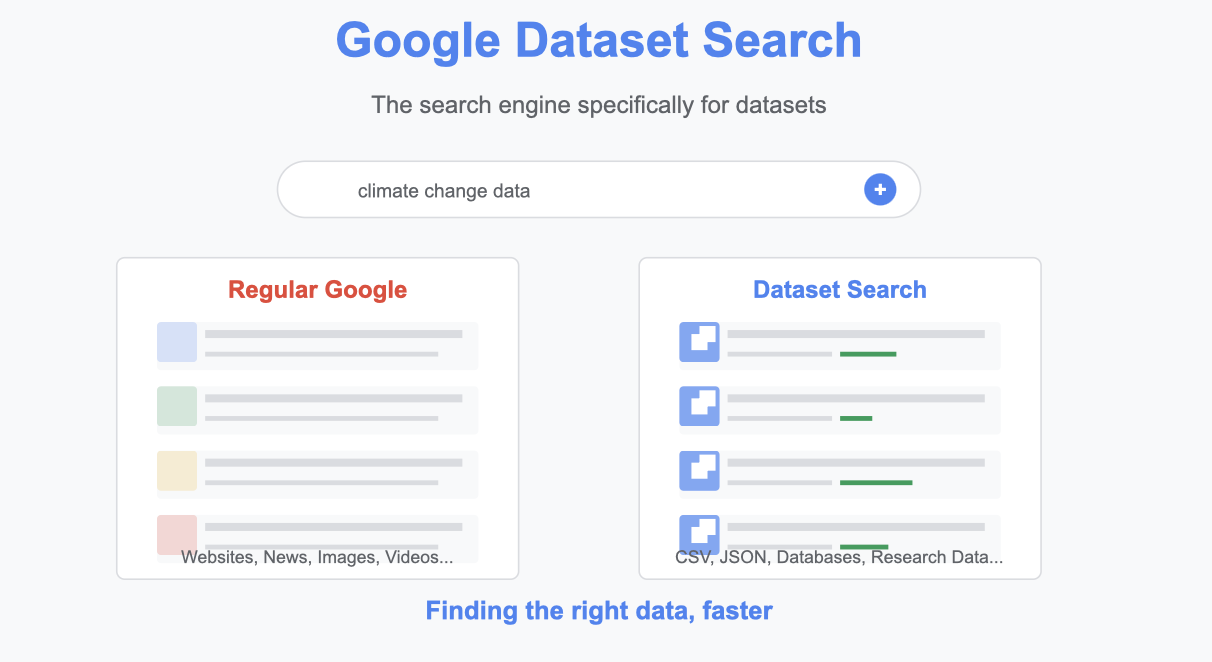
Google Dataset Search
Google Dataset Search is like Google, but specifically for datasets. It helps you find publicly available data from across the web. Whether you’re interested in climate change, education, or business trends, this tool makes it easy to locate relevant datasets. Just type in your topic, and you’ll get a list of options to explore. It’s simple, fast, and perfect for beginners.
Data.gov
If you’re curious about government-related data, Data.gov is the platform for you. It provides access to datasets on topics like public health, transportation, and the environment. These datasets are reliable and often updated, making them ideal for projects that require accurate information. Plus, exploring government data can give your projects a real-world edge.
Tools for Data Analysis
Excel and Google Sheets
Excel and Google Sheets are the go-to tools for beginners. They’re easy to use and perfect for tasks like organizing, cleaning, and visualizing data. You can create charts, pivot tables, and even basic dashboards. These tools are widely used in the industry, so mastering them is a smart move.
Python (Pandas, Matplotlib, Seaborn)
Python is a powerhouse for data analysis. Libraries like Pandas help you manipulate and clean data, while Matplotlib and Seaborn are great for creating visualizations. For example, you can use Pandas to filter rows in a dataset and Seaborn to create a heatmap. Python’s versatility makes it a favorite among data analysts.
R (ggplot2, dplyr)
R is another excellent tool for data analysis, especially if you’re into statistics. The ggplot2 library is fantastic for creating detailed visualizations, and dplyr makes data manipulation a breeze. If you’re working on projects that require statistical analysis, R is a tool you’ll want to explore.
Tableau and Power BI
Tableau and Power BI are popular for creating interactive dashboards. They let you turn raw data into stunning visuals that tell a story. These tools are user-friendly and don’t require coding skills, making them perfect for beginners. Whether you’re analyzing sales trends or customer feedback, these platforms make data visualization easy.
FineBI, FineDataLink, FineVis
FanRuan’s tools take data analysis to the next level. FineBI is perfect for self-service analytics, allowing you to explore data independently. FineDataLink simplifies data integration, making it easy to combine information from multiple sources. And FineVis helps you create dynamic visualizations without any coding. These tools are beginner-friendly and designed to make your projects shine.
Collaborative Platforms
GitHub
GitHub is a fantastic platform for sharing your projects. It allows you to collaborate with others, track changes, and showcase your work. You can upload your code, share datasets, and even get feedback from the community. It’s a must-have tool for any aspiring data analyst.
Google Colab
Google Colab is like a notebook in the cloud. It lets you write and run Python code directly in your browser. You can collaborate with others in real-time, making it perfect for group projects. Plus, it’s free and doesn’t require any setup, so you can start analyzing data right away.
Kaggle Notebooks
Kaggle Notebooks combine the power of coding with the ease of collaboration. You can write Python or R code, analyze data, and share your findings—all in one place. The platform also supports real-time collaboration, so you and your team can work together seamlessly.
Here’s why collaborative platforms are so valuable:
Real-time collaboration lets teams share insights instantly.
Integration of multiple data sources enables comprehensive analysis.
Enhanced communication features reduce misunderstandings and foster teamwork.
Platforms like FineChatBI also offer conversational BI capabilities, making collaboration even more intuitive. You can interact with your data through natural language queries, simplifying the process of sharing insights.
How FanRuan-en Products Can Enhance Your Data Analysis Projects
Using FineBI for Self-Service Analytics
FineBI makes self-service analytics a breeze, even if you're just starting out. Its user-friendly interface simplifies the process, so you can focus on exploring and analyzing data without feeling overwhelmed. You don’t need to worry about complex coding either. FineBI comes with built-in calculation formulas and filtering components, which means you can dive into analysis without writing a single line of SQL.
What makes FineBI stand out is its ability to help you build various analysis models. Whether you're working on a pyramid model, KANO model, RFM model, or market basket analysis, FineBI has you covered. These models are perfect for beginner projects, giving you a structured way to uncover insights from your data. Plus, FineBI tailors its features to industries like manufacturing, healthcare, retail, and finance. This versatility ensures you can tackle projects that align with your interests or career goals.
Another bonus? FineBI takes care of the heavy lifting when it comes to data processing. This lets you focus on analyzing trends and presenting key metrics. For example, management teams can use FineBI to track business performance effortlessly. If you're curious, check out more about FineBI's capabilities on FanRuan's website.
Leveraging FineDataLink for Data Integration
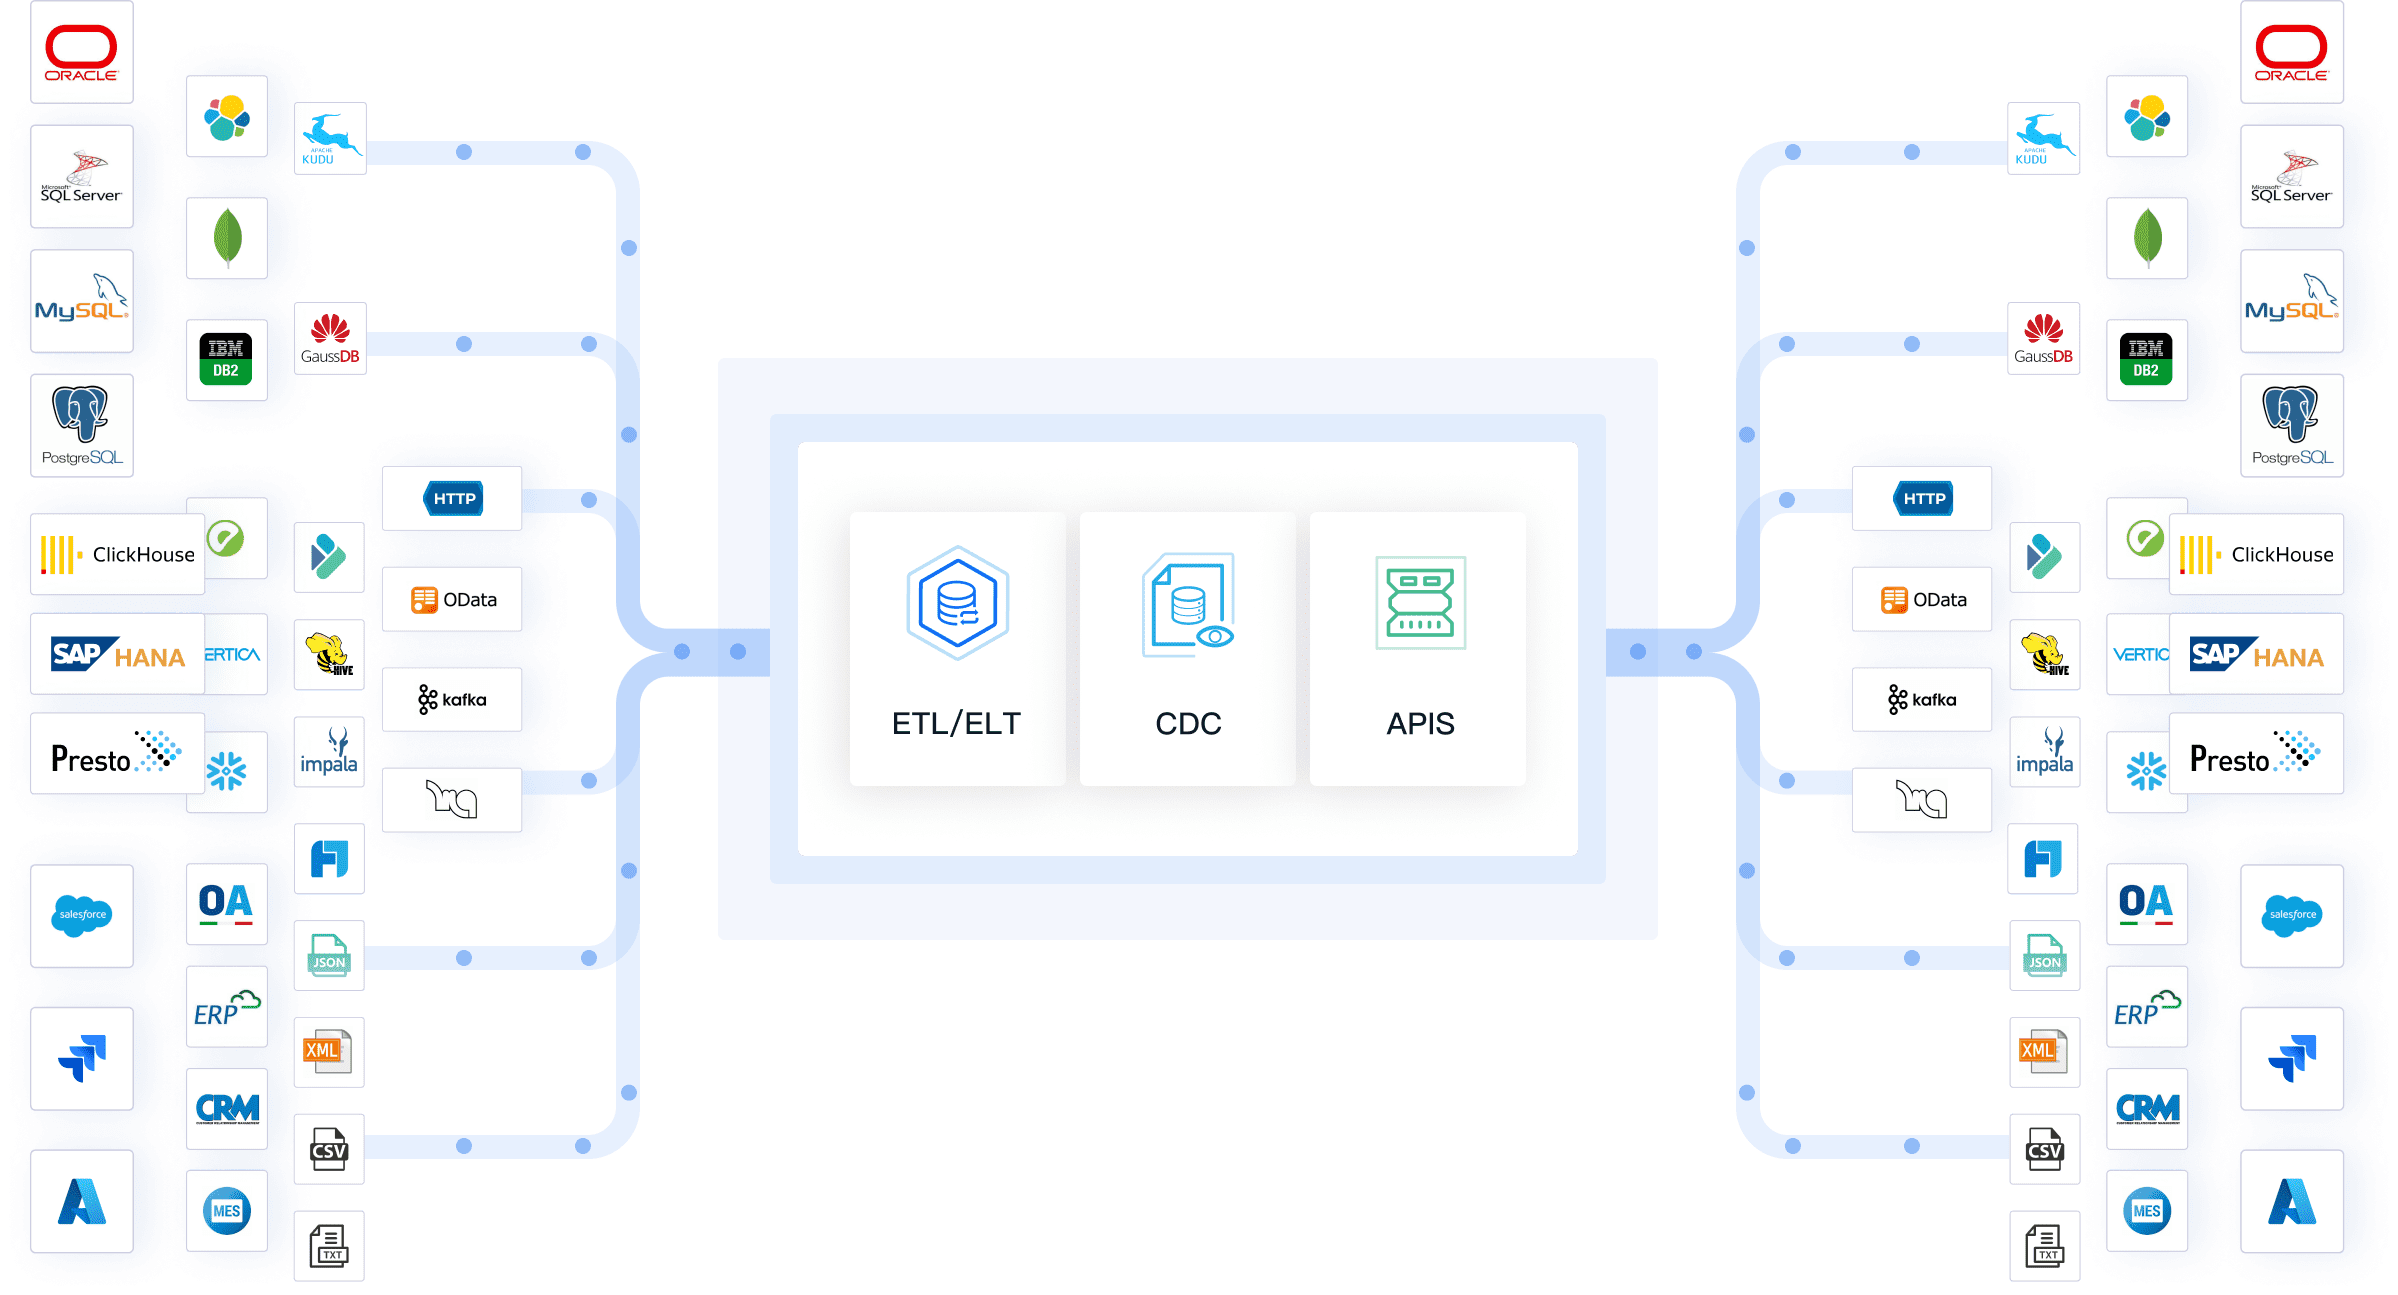
Data integration can feel like a daunting task, but FineDataLink makes it simple. This tool is designed to help you combine data from multiple sources seamlessly. Whether you're working with spreadsheets, databases, or cloud platforms, FineDataLink ensures everything comes together in one place. Its real-time synchronization feature keeps your data up-to-date, so you’re always working with the latest information.
FineDataLink also excels at transforming raw data into a format that's ready for analysis. Its ETL (Extract, Transform, Load) capabilities allow you to clean and preprocess data efficiently. This is especially helpful for beginners, as it saves you hours of manual work. Imagine starting a project with clean, organized data—FineDataLink makes that possible.
If you're dealing with large datasets or complex systems, FineDataLink's scalability ensures smooth performance. It’s a powerful tool that simplifies the integration process, letting you focus on what really matters: uncovering insights. Learn more about how FineDataLink can streamline your workflow on FanRuan's website.
Creating Stunning Visualizations with FineVis
Data visualization is where your analysis truly comes to life, and FineVis makes it easy to create visuals that wow your audience. With over 60 chart types and dynamic 3D visualizations, FineVis gives you the tools to tell compelling stories with your data. Its drag-and-drop interface means you don’t need any coding skills to design professional-looking dashboards.
FineVis also supports real-time analytics, so you can update your visuals as new data comes in. This feature is perfect for projects that require ongoing monitoring or quick decision-making. Whether you're visualizing sales trends, customer feedback, or climate data, FineVis ensures your insights are clear and impactful.
The platform’s adaptability is another highlight. You can access your dashboards on any device, from smartphones to large screens. This makes it easy to share your findings with others, whether you're presenting to a team or showcasing your portfolio. Explore how FineVis can elevate your projects on FanRuan's website.
Exploring Conversational BI with FineChatBI
Have you ever wished you could just talk to your data? That’s exactly what FineChatBI lets you do. It’s like having a conversation with your favorite assistant, but instead of answering random questions, it helps you uncover insights from your data. Sounds cool, right?
FineChatBI is a conversational business intelligence tool designed to make data analysis feel natural and intuitive. You don’t need to be a coding expert or a data scientist to use it. With FineChatBI, you can ask questions in plain English, and it will respond with accurate, actionable insights. For example, you could type, “What were the top-selling products last month?” and instantly get a clear answer. It’s that simple.
One of the standout features of FineChatBI is its Text2DSL technology. This fancy-sounding feature translates your natural language queries into a structured format that the system understands. It ensures your questions are interpreted correctly, so you always get reliable results. Plus, it combines rule-based models with advanced algorithms to handle both simple and complex queries. Whether you’re analyzing sales trends or exploring customer feedback, FineChatBI has your back.
Another great thing about FineChatBI is how it guides you through the entire data analysis process. It doesn’t just stop at answering your questions. It helps you dig deeper, offering suggestions and insights you might not have thought of. For instance, if you’re looking at sales data, it might highlight anomalies or trends that deserve your attention. This makes it a powerful tool for both beginners and experienced analysts.
FineChatBI also excels at creating a seamless user experience. Its interface is designed to keep things simple and engaging. Features like input suggestions, fuzzy matching, and multi-turn Q&A make your interactions smooth and efficient. You can even use it to generate detailed reports or visualizations, turning raw data into stories that anyone can understand.
If you’re curious about how FineChatBI can transform your projects, check out more details on FanRuan’s website. It’s a game-changer for anyone looking to make data analysis more accessible and fun.
So, why not give it a try? With FineChatBI, you’ll not only learn to analyze data but also discover how to communicate with it in a whole new way. It’s like having a conversation with your data—and who wouldn’t want that?
Building a strong portfolio with beginner-friendly data analysis projects is one of the best ways to kickstart your journey in analytics. These projects help you develop essential skills like Python, R, and Tableau while preparing you for real-world challenges. Engaging in project-based learning allows you to apply theoretical knowledge, uncover data insights, and make data-driven recommendations.
FanRuan-en tools like FineBI, FineDataLink, FineVis, and FineChatBI simplify every step of the process. They make data integration, visualization, and analytics accessible, even for beginners. As Solange van der Kolff said, “Without Dataquest, I wouldn’t have learned as quickly, and maybe I would have overlooked different options to tackle the database migration.”
Start small, focus on mastering data visualization best practices, and showcase your work effectively. Every project you complete brings you closer to becoming a data-driven decision-making expert. So, dive in and let your data analytics portfolio shine!
Click the banner below to try FineBI for free and empower your enterprise to transform data into productivity!
Begin with tools like Excel, Google Sheets, or Python libraries such as Pandas and Matplotlib. These are beginner-friendly and widely used in the industry. For advanced features, explore FineBI for self-service analytics or FineVis for stunning visualizations.
Where can I find datasets for my projects?
You can find datasets on platforms like Kaggle, Google Dataset Search, or Data.gov. For integrated data solutions, check out FineDataLink, which simplifies data preparation and integration.
How do I choose the right project for my portfolio?
Pick projects that align with your interests and career goals. Start small, like analyzing sales trends or customer feedback. Tools like FineBI can help you create professional dashboards to showcase your work.
Do I need coding skills to start data analysis?
Not necessarily! Tools like Excel or FineVis allow you to analyze and visualize data without coding. However, learning Python or R can open up more opportunities and make your projects more versatile.
How can I make my visualizations stand out?
Use tools like FineVis for dynamic and interactive charts. Focus on simplicity, clear labels, and contrasting colors. A well-designed visualization tells a story and makes your insights more impactful.
What’s the best way to document my projects?
Keep a record of your goals, tools, and steps. Include visuals like screenshots or flowcharts. Tools like FineDataLink streamline workflows, making it easier to document your process and share your learnings.
How can I collaborate on data analysis projects?
Use platforms like GitHub or Google Colab for real-time collaboration. For a more intuitive experience, try FineChatBI, which allows you to interact with data through natural language queries and share insights effortlessly.
What’s the role of storytelling in data analysis?
Storytelling turns raw data into meaningful insights. Use tools like FineBI or FineVis to create dashboards that highlight key findings. A compelling story makes your analysis memorable and actionable.
Product Trial
FineReport
Pixel-perfect reports · Interactive dashboards · Easy data entry · Digital twins