You play a vital role as a BI analyst in any data-driven company. You turn raw data into clear, actionable insights that help your team make smart choices. As a business intelligence analyst, you collect, process, and visualize information to guide decisions. Your job description often includes automating reports, supporting real-time analysis, and sharing results across departments. Business intelligence drives success in industries like finance, healthcare, and manufacturing by enabling quick, well-informed decisions and fostering collaboration.
BI Analyst Role

Daily Tasks
As a bi analyst, you start your day by checking the latest data updates. You collect information from different sources, such as databases, spreadsheets, and cloud platforms. You clean and organize this data to make sure it is accurate and ready for analysis. Many companies use modern business intelligence tools to automate these steps, which saves you time and reduces errors.
Your daily routine often includes:
- Collecting, cleaning, and organizing data from multiple systems
- Analyzing business processes and company data, such as sales, expenses, and employee records
- Using data modeling techniques to spot trends and patterns in the market
- Creating dashboards and reports with tools like FineBI, Tableau, or Power BI
- Meeting with colleagues to discuss findings and adjust your analysis based on feedback
- Presenting your insights to managers and other stakeholders
- Staying updated on new business intelligence technologies and industry trends
Tip: Automating data gathering and cleaning with BI tools helps you focus more on analysis and less on manual work.
You often work with both technical and non-technical teams. For example, you might help the IT department set up a new data warehouse, then explain your findings to the sales team in a simple, visual format. This makes your role essential in connecting business goals with technology solutions.
Core Responsibilities
You hold several key responsibilities as a business intelligence analyst. Your main goal is to turn raw data into actionable insights that help your company grow. Here are the core duties you handle:
- Gather and understand business needs by talking with different teams and leaders.
- Collect, clean, and analyze data from various sources to ensure accuracy and reliability.
- Develop dashboards, reports, and visualizations using business intelligence tools to make data easy to understand.
- Identify trends and patterns in the data to provide recommendations for improving business strategies.
- Collaborate with stakeholders across departments to make sure your insights are practical and aligned with company goals.
- Ensure data quality and reporting integrity by following high standards for data management.
- Track key performance indicators (KPIs) and measure company performance to support data-driven decisions.
You also bridge the gap between business and IT. You translate technical data into clear business insights. For example, you might use data analytics to find out why sales dropped in a certain region, then suggest changes to the marketing strategy. You help IT teams understand what data the business needs, and you help business teams use technology to solve real problems.
In many industries, such as finance, healthcare, retail, and manufacturing, your work as a bi analyst supports everything from risk management to customer service. You help companies break down data silos, improve data quality, and make better decisions faster.
Note: One of your biggest challenges is integrating data from many sources and making sure it is clean and consistent. Using centralized business intelligence platforms can help you overcome these obstacles and deliver reliable results.
BI Analyst Skills
Technical Abilities
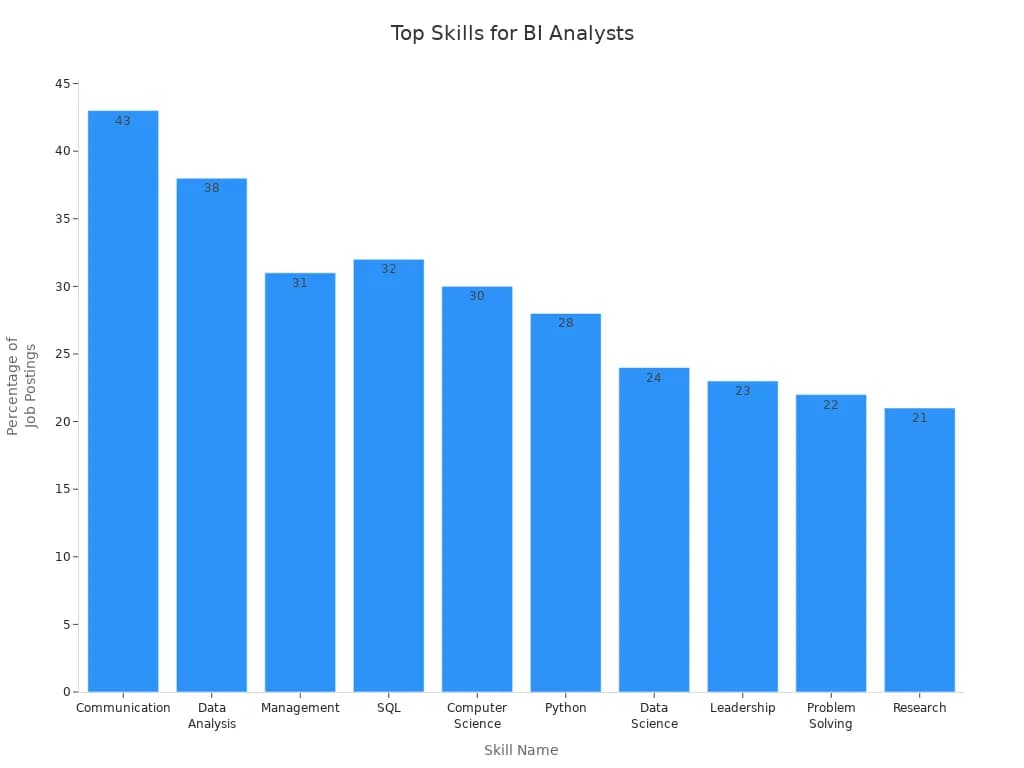
You need strong technical abilities to succeed as a bi analyst. Employers look for candidates who can handle large amounts of data and use advanced tools. The most important technical skills include:
- Understanding data warehousing, such as working with data warehouses and data lakes.
- Managing data through ETL (Extract, Transform, Load) processes and improving data quality.
- Preparing data by collecting, cleaning, and transforming it for analysis.
- Analyzing data using queries, data mining, and predictive analytics.
- Creating dashboards and reports to visualize data and tell a story.
- Writing code, especially in SQL, Python, or R.
- Using business intelligence tools like Excel, Power BI, Tableau, and Qlik.
- Earning certifications in BI tools and analytics.
You will often use programming languages and data tools in your daily work. Here is a quick overview:
| Category | Examples | Purpose / Benefits |
|---|---|---|
| Programming Languages | Python, R, SQL | Data manipulation, statistical analysis, database management. |
| Data Tools | Excel, Tableau, Power BI | Spreadsheet analysis, data visualization, dashboard creation. |
| Additional BI Platforms | Metabase, Jupyter Notebook, IBM Cognos, Chartio, Mode, KNIME, Looker, RapidMiner, Domo | Data cleaning, integration, visualization, and advanced analytics. |
Tip: Learning multiple tools and languages helps you adapt to different business intelligence projects.
Analytical Thinking
Analytical thinking sets you apart as a business intelligence analyst. You gather and organize complex data, then look for patterns and trends. This skill helps you turn raw information into clear recommendations for your company. You connect data from different sources, question results, and find the root causes behind business problems. When you combine technical skills with critical thinking, you make decisions that support your company’s goals. Analytical thinking also helps you explain your findings in a way that others can understand and use.
Communication Skills
You must communicate your findings clearly as a bi analyst. Employers value these communication skills:
- Translate complex data into simple, actionable insights.
- Bridge the gap between technical and non-technical teams.
- Adjust your presentations for different audiences.
- Build strong relationships and encourage teamwork.
- Negotiate project details and solve conflicts.
Note: Good communication ensures everyone understands the project goals and works together for success.
Business Intelligence Tools and FineBI for BI Analyst
Essential BI Tools
You have many options when choosing business intelligence tools. These platforms help you collect, analyze, and visualize data for better decision-making. Some of the most widely adopted business intelligence tools include SAP BusinessObjects, MicroStrategy, and SAS Augmented Analytics. Each tool offers unique features for reporting, dashboards, and analytics. The table below shows key features of popular business intelligence tools:
| BI Tool | Key Features and Strengths |
|---|---|
| ThoughtSpot | AI-driven search analytics, natural language queries, user-friendly for all users. |
| SAP BusinessObjects | Enterprise reporting, role-based dashboards, real-time analytics integration with SAP systems. |
| MicroStrategy | High-speed dashboarding, cloud solutions, multi-source data connectivity. |
| SAS Augmented Analytics | Advanced predictive analytics, self-service BI, high data integration. |
| Sisense | Embedded analytics, drag-and-drop visualizations, mobile access. |
| Domo | Data collection and visualization, collaboration tools, cloud-native architecture. |
| Qlik Sense | Interactive visualizations, associative data modeling, AI/ML capabilities. |
| Yellowfin | Interactive dashboards, automated insights, data storytelling. |
| Oracle Analytics Cloud | Cloud-based BI, advanced analytics, collaboration. |
| Looker | Data exploration, embedded analytics, integration with Google Workspace. |
Note: Cloud-based business intelligence tools are growing fast. Many organizations now use these platforms to support real-time analysis and collaboration.
FineBI by FanRuan
FineBI stands out as a leading self-service business intelligence tool. You can use its user-friendly interface to explore data without needing advanced coding skills. FineBI supports classic analysis models like the pyramid model and RFM model, which help you gain valuable insights. The platform offers tailored solutions for industries such as manufacturing, healthcare, retail, and finance. You can focus more on analysis and communication, while FineBI handles complex data processing and visualization. Integration with FineVis enhances your ability to create real-time analytics and advanced visualizations. FanRuan, the company behind FineBI, received an Honorable Mention in the 2023 Gartner Magic Quadrant for Analytics and Business Intelligence Platforms. This recognition highlights FanRuan’s value and leadership in the business intelligence industry.

Data Integration and Visualization
You can connect FineBI to over 30 big data platforms, SQL data sources, and Excel datasets. The platform makes data integration simple, even if you have no coding experience. You can access time-series data from databases like TDengine and create visual reports with just a few clicks. FineBI allows you to build self-service datasets, explore data, and perform joint analysis without manual setup. Visualization features include a wide range of chart types, such as column, line, pie, and funnel charts. You can customize dashboards with interactive filters, adaptive layouts, and theme options. FineBI also supports collaboration by letting you share dashboards and reports with your team. This approach helps you turn business intelligence into a team effort, making data-driven decisions easier for everyone.

BI Analyst Impact on Business Intelligence
Driving Data-Driven Decisions
You play a central role in helping your company make smart choices with business intelligence. As a business intelligence analyst, you start by setting clear business goals. You identify the biggest challenges and set targets that match your company’s needs. You then collect and analyze data, making sure it fits the problem you want to solve. You use business intelligence tools to present your findings in a way that everyone can understand.
Here is how you drive data-driven decisions:
- Set clear business goals and define what success looks like.
- Present data in context for each decision-maker, offering clear recommendations.
- Build a framework for decisions that includes problem definition, analysis, forecasting, and tracking results.
- Train your team to use business intelligence, so everyone can make data-backed choices.
- Use real-time dashboards and alerts to help your company respond quickly.
You can see the impact of your work in real companies. For example, Lotte.com used business intelligence to find out why customers left their shopping carts. By analyzing this data, they increased sales by $10 million. Cementos Argos created a business analytics center, which helped them improve profits. Baylis & Harding gave managers instant access to business data, leading to faster decisions. Sabre Airline Solutions built dashboards that improved revenue and customer satisfaction.
Tip: When you use business intelligence to guide decisions, you help your company grow and stay ahead of the competition.
Supporting Company Strategy
As a business intelligence analyst, you support your company’s strategy by turning complex data into clear insights. You help leaders see trends, spot risks, and find new opportunities. You use business intelligence software to compare your company’s data with industry trends and competitors. You create visual reports that make it easy for managers to understand what is happening and what actions to take.
Your work leads to real business results:
- Revenue growth by making better decisions based on data.
- Cost reduction by finding inefficiencies and improving processes.
- Higher customer satisfaction through targeted analytics.
- Improved operations by optimizing supply chains and workforce performance.
- Smarter marketing with campaigns based on predictive analytics.
- Lower risk by tracking market trends and credit risks.
- Better resource allocation by monitoring key performance indicators.
In healthcare, you might use business intelligence to identify high-risk patients and reduce costs. In retail, you can analyze sales trends to adjust marketing and inventory. In manufacturing, you use predictive maintenance to cut downtime. In logistics, you optimize delivery routes for faster service.
You measure your success by tracking data quality, user engagement, and the impact of your reports. You focus on key performance indicators that matter, such as revenue, customer satisfaction, and operational improvements. Your insights help shape company strategy and drive business value.
Career Path for BI Analyst
Growth Opportunities
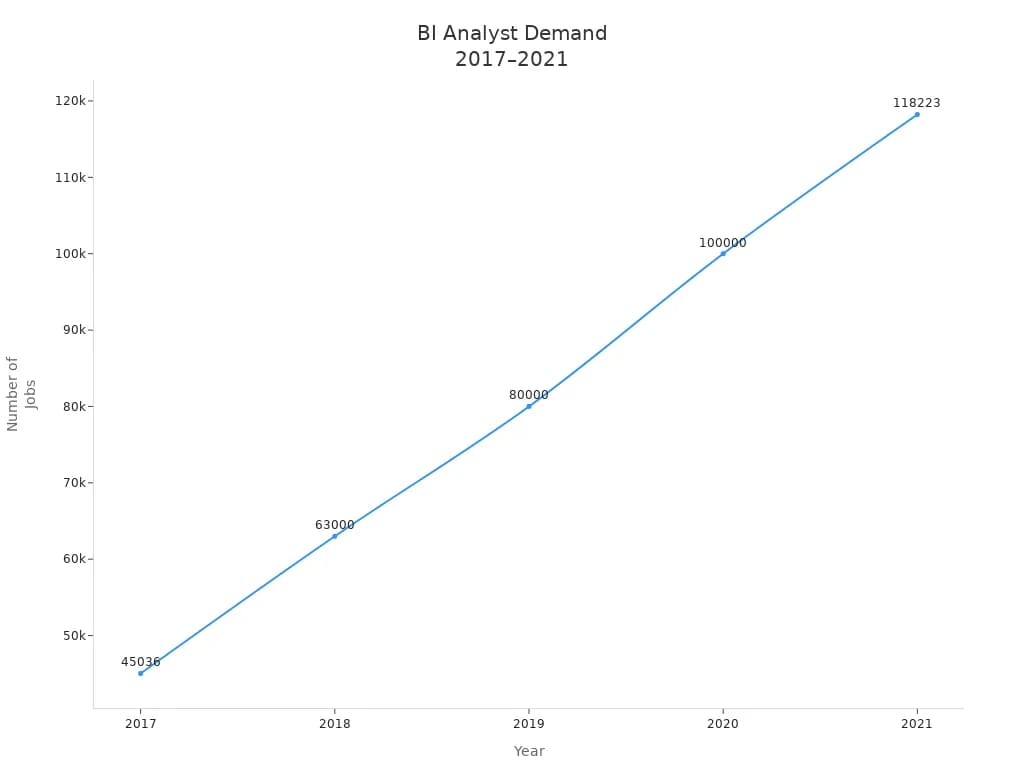
You can find many growth opportunities as a business intelligence analyst. Companies need experts who can turn data into smart business moves. The demand for your skills has more than doubled in recent years. This growth comes from the rise of digital data, cloud computing, and machine learning. You can see this trend in the chart below:
Your career path often follows these steps:
- Junior BI Analyst/Data Analyst (0-3 Years): You start by cleaning data, making reports, and learning from senior team members.
- BI Analyst (3-5 Years): You take on more responsibility, work on your own, and create dashboards for business teams.
- Senior BI Analyst/Lead BI Analyst (5-10+ Years): You lead projects, guide other analysts, and help shape company strategy.
- BI Manager/Director (10+ Years): You manage teams and set the direction for business intelligence in your company.
You can also move into roles like data scientist, BI engineer, or BI consultant. Some analysts shift to product management or marketing analytics. High-paying business intelligence analyst jobs often go to those who keep learning and earn advanced certifications.
How to Become a BI Analyst
You can become a bi analyst by building the right skills and education. Most successful analysts study math or computer science. You need to know how to use SQL, manage databases, and explain your findings to others. Many employers look for strong communication skills.
Here are common steps to start your career:
- Get a degree in math, computer science, or a related field.
- Learn analytic tools and technologies, such as SQL and data visualization software.
- Practice turning data into clear business insights.
- Earn certifications. Top bi certifications include CBIP, Microsoft Data Analyst Associate, and Google Data Analytics Professional Certificate.
| Certification Name | Provider | Description |
|---|---|---|
| CBIP | TDWI | Validates expertise in BI, analytics, and data management. |
| Microsoft Certified: Data Analyst Associate | Microsoft | Focuses on Power BI skills for data analysis. |
| Google Data Analytics Professional Certificate | Teaches foundational analytics skills. |
The average salary for a bi analyst in the US is about $88,000 per year, with senior roles earning even more. You can find business intelligence analyst jobs worldwide, with salaries rising in major cities.
Tip: Stay curious and keep learning. The best business intelligence analysts grow their skills with every project.
You drive real change as a business intelligence analyst. Your skills and use of modern tools like FineBI help your company make smarter decisions and improve efficiency.
- Continuous learning keeps you ahead in a fast-changing world. Upskilling boosts your engagement, productivity, and career growth.
Organizations that invest in business intelligence and employee development see better retention and innovation.
Stay curious and keep learning. Business intelligence will open new doors for your career and help your company thrive.
Click the banner below to try FineBI for free and empower your enterprise to transform data into productivity!

Continue Reading About BI Analyst
How to Secure Remote Data Analyst Jobs in 2025
Key Skills for Data Analyst Jobs: Landing Your Ideal Position


FAQ

The Author
Lewis
Senior Data Analyst at FanRuan
Related Articles

What Is Business Reporting? A Practical Guide for Executives, Analysts, and IT Teams
Business reporting is how organizations turn raw operational data into decisions, accountability, and follow up. For executives, it provides visibility into whether the business is on plan. For analysts, it creates a str
Yida Yin
Jun 28, 2026

ERP Reporting Explained: What It Is, How It Works, and Why Enterprise Teams Rely on It
ERP reporting is the process of turning data inside your enterprise resource planning system into usable business insight. For finance leaders, operations directors, supply chain managers, and IT teams, that matters beca
Yida Yin
Jun 25, 2026
8 Best Restaurant Reporting Software Tools for 2026: Compare FineReport, Toast, SpotOn & More
$1 is a highly customizable business intelligence and reporting platform that helps restaurants turn POS, labor, inventory, finance, and multi location data into real time dashboards and decision ready reports. 8 Best Re
Yida Yin
Jun 24, 2026