Imagine you notice a sudden drop in your company’s sales numbers. You want to know why this happened, not just what happened. Diagnostic analytics gives you the tools to dig into your data and uncover the reasons behind business outcomes in Malaysia. This approach goes beyond surface-level reporting and uses statistical techniques like correlation and regression analysis to pinpoint root causes. Companies from manufacturing to finance rely on diagnostic analytics to drive informed decision-making and deliver actionable insights that improve results.
Many businesses in Malaysia see real impact:
Business Outcome Quantified Impact Company Example Downtime Reduction 30% decrease in downtime General Electric (GE) Fuel Consumption Saved 85 million gallons of fuel saved UPS Pricing Optimization Improved pricing and promotions strategies Coca-Cola
You often want to know why something happened in your business in Malaysia, not just what happened. Diagnostic analytics helps you answer these questions. This type of data analysis focuses on finding the root causes behind business outcomes in Malaysia. Instead of stopping at surface-level numbers, you dig deeper to understand the reasons behind trends or changes.
Diagnostic analytics uses methods like regression analysis, decision trees, and cluster analysis. These tools help you spot patterns and relationships in your data. For example, you might use diagnostic analytics to see why sales dropped last quarter or why customer satisfaction scores changed. According to CCS Learning Academy and IBM, diagnostic analytics sits between descriptive and prescriptive analytics. It helps you move from simply reporting results to understanding the drivers behind them. Modern business intelligence tools in Malaysia now combine traditional reporting with real-time data exploration, making diagnostic analytics more accessible and powerful.
Companies like General Electric and Coca-Cola use diagnostic analytics to improve efficiency and optimize supply chains. You can apply these techniques with tools such as FineReport, FineBI, Tableau, or Power BI.
Diagnostic analytics matters because it gives you the power to make smarter decisions. When you understand why business outcomes occur in Malaysia, you can take targeted action. For instance, a retail store might discover that behind-the-scenes social media posts drive more engagement, or an e-commerce site might find that a complicated checkout process causes customers to abandon their carts.

Market research shows that diagnostic analytics is essential for business growth in Malaysia and strategy. It helps you analyze market trends, customer satisfaction, and product performance. By using diagnostic analytics, you can identify bottlenecks, avoid costly mistakes, and improve your business outcomes in Malaysia. McKinsey reports that companies using advanced data analysis are much more likely to gain and keep new customers in Malaysia.
Diagnostic analytics also supports agile decision-making. You can quickly determine if you need to act, investigate further, or stay the course. This approach leads to better results and a stronger competitive edge. With diagnostic analytics, you move beyond guessing and start making decisions based on clear evidence.
You play a key role in shaping your company’s future when you use diagnostic analytics. This approach lets you move beyond basic reporting and start asking why business outcomes occur in Malaysia. Diagnostic analytics helps you uncover the root causes behind trends and patterns. You can use techniques like drill-down, data mining, and correlation analysis to make deep connections within your data.
When you apply diagnostic analytics, you gain the ability to explain changes in your business in Malaysia. For example, you might investigate a sudden 15% drop in sales or find out why conversion rates vary across regions. This process enables you to respond quickly to market changes, spot missed opportunities, and avoid costly mistakes. You make data-driven decision making a reality by relying on facts instead of guesswork. Here is an interactive dashboard of sales performance created by FineReport, click to experience it.
Companies that excel at business analytics outperform competitors by 23 times in customer acquisition, stay profitable 19 times more often, and retain customers at seven times the rate.
Diagnostic analytics delivers clear benefits across industries. You can use it to resolve operational challenges, improve efficiency, and drive better business outcomes in Malaysia. The following table highlights how different sectors benefit from this approach:
| Industry | Success Metrics / Operational Improvements |
|---|---|
| Human Resources | Improved employee retention by identifying causes of turnover |
| Healthcare | Reduced readmission rates, improved patient care, optimized discharge plans |
| Manufacturing | Reduced machine downtime, fewer operational inaccuracies, streamlined production |
| Information Technology | Enhanced system performance by resolving network issues |
| Retail | Increased sales, optimized inventory, improved customer experience |
Organizations using diagnostic analytics are three times more likely to make faster decisions than competitors. You can reduce operational costs by up to 20% and improve customer satisfaction. By uncovering the reasons behind business outcomes in Malaysia, you support informed decision-making and set your company up for long-term success. Diagnostic analytics enables you to make informed decisions based on real-time insights and historical data analysis, not just intuition.
You can unlock the full value of diagnostic analytics by following a clear, step-by-step process. This approach ensures you move from raw data to actionable insights that drive real business results in Malaysia.

Manufacturers who use diagnostic analytics and AI have seen a 10-15% increase in production efficiency and a 4-5% rise in EBITA. These gains show the power of a structured analytics strategy.
You have access to a wide range of tools and techniques that make diagnostic analytics effective and accessible. Choosing the right mix helps you turn complex data into clear, actionable insights.
FineReport and FineBI stand out by combining data integration, visualization, and self-service analysis. You can connect to over 100 data sources, create interactive dashboards, and drill down into details—all without writing code.

Over 90% of organizations report measurable value from analytics. Companies using data-driven decisions see a 63% boost in productivity and at least a 50% increase in growth and profit.
| Statistic Description | Value / Impact |
|---|---|
| Organizations achieving measurable value from analytics | Over 90% |
| Increase in operational productivity via data-driven decisions | 63% |
| Growth and profit boost from customer data analytics (McKinsey) | At least 50% |
| Profitability increase from advanced analytics (Kearney) | 81% |
You can leverage FineReport and FineBI to bring diagnostic analytics to life in your business in Malaysia. These tools offer powerful features that support every step of your analytics journey.


You can see the impact of diagnostic analytics across industries:
| Industry | Use Case Example | Outcome |
|---|---|---|
| Manufacturing | Predictive maintenance using FineReport dashboards | Significant cost reductions |
| Retail | Customer behavior analysis with FineBI | Revenue increases |
| Finance | Fraud detection and risk analysis with FineBI | Improved compliance and reduced losses |
| Healthcare | Patient care optimization using diagnostic analytics in FineReport | 25% reduction in readmission rates |
In one manufacturing case, diagnostic analytics identified machine malfunctions, leading to a 40% improvement in production efficiency after upgrades. In retail, analyzing customer data with FineBI led to smarter promotions and a 30% increase in conversion rates.
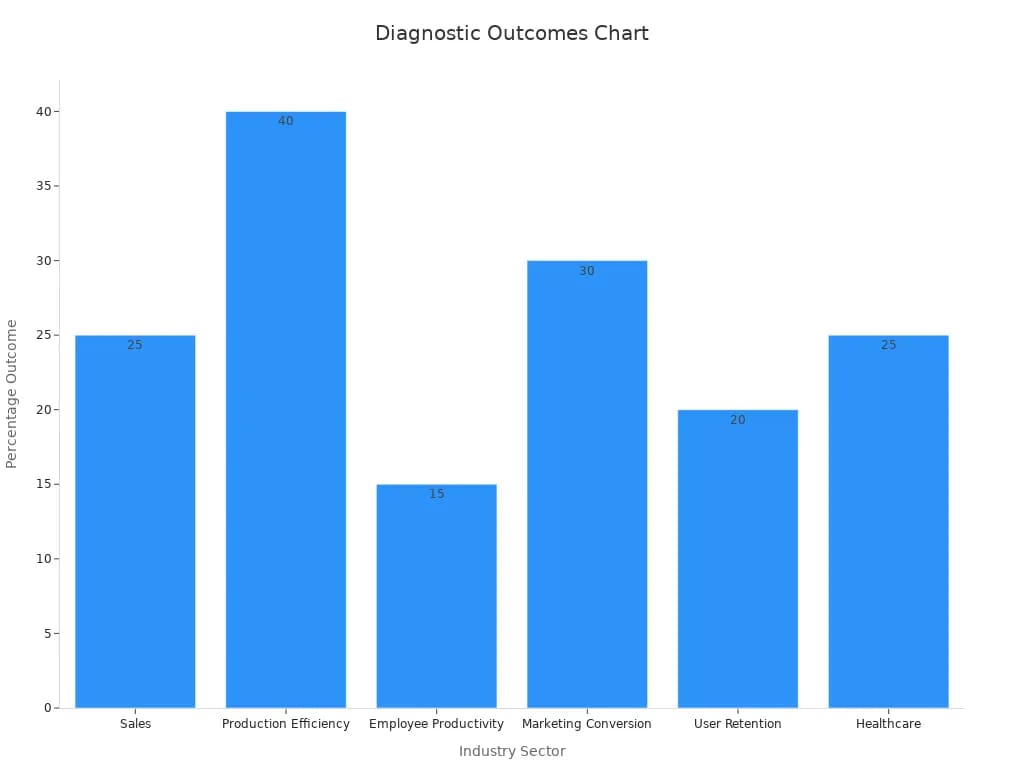
| Sector/Area | Diagnostic Technique/Tool | Measurable Outcome |
|---|---|---|
| Sales | Diagnostic analytics identifying shipping cost issues | 25% increase in sales after offering shipping discounts |
| Production Efficiency | Machine malfunction diagnosis via diagnostic analytics | 40% improvement after machinery upgrades |
| Employee Productivity | Managerial training based on root cause analysis | 15% boost in productivity |
| Marketing Conversion | Realignment of campaigns using diagnostic insights | 30% increase in conversion rates |
| User Retention | Simplification of complex product features | 20% increase in user retention |
| Quality Control | Supplier part defect identification | Significant defect reduction, increased sales |
| Financial Planning | Seasonal revenue dip analysis | Smarter budgeting and improved cash flow management |
| Customer Satisfaction | Infrastructure improvements in problematic zones | Drastic reduction in complaints |
| Healthcare | Post-discharge care procedure changes | 25% reduction in hospital readmission rates |
Tip: Start small by piloting diagnostic analytics in one department. Measure the impact, then expand to other areas for greater business value in Malaysia.
You can achieve measurable improvements by following a structured process and using the right tools. Diagnostic analytics helps you move from data to action, delivering actionable insights that drive growth and efficiency.
You may face several challenges when implementing diagnostic analytics in your organization. Data silos, integration issues, and poor data quality often stand in the way of extracting actionable insights. Many organizations struggle with fragmented systems and inconsistent data formats. These problems can slow down your analytics projects and reduce the reliability of your results.
These challenges are not unique to healthcare. Most industries encounter similar obstacles when working with diagnostic analytics.
You can overcome these barriers by following proven strategies and leveraging advanced tools like FineReport and FineBI. These platforms help you break down data silos and ensure high-quality, integrated data for analysis.
| Company / Solution | Method / Solution Description | Outcome / Impact |
|---|---|---|
| IQVIA Vigilance Platform | Centralized safety data platform for real-time adverse event reporting | Processes over 15% of global adverse event case intake |
| Pfizer (with AWS ML) | Real-time anomaly detection in manufacturing sensor data | Improved integration and data quality |
| Global Pharma (PwC case) | Integrated analytics platform with machine learning for sales optimization | 30% sales growth, 1.5× higher sales performance |
FineReport and FineBI support seamless data integration from over 100 sources, automate data cleaning, and provide real-time dashboards. You can use these tools to:
Tip: Start by auditing your current data sources. Use FineReport or FineBI to connect, clean, and visualize your data. Regularly review your analytics process to ensure you maintain high data quality and reliable diagnostic analytics.

You can unlock real business value in Malaysia by using data to guide your decisions. When you apply the right tools, you improve revenue, efficiency, and customer satisfaction. The table below shows how data-driven strategies impact your business in Malaysia:
| KPI Metric | Description | Impact on Business Success and Decision Making |
|---|---|---|
| Revenue Growth | Financial gains from data-driven strategies | Increased company profits |
| Operational Efficiency | Process improvements and higher output per employee | Enhanced productivity and cost savings |
| Customer Satisfaction | Better customer experience and loyalty | Improved retention and personalization |
| Decision Quality and Speed | Faster, more accurate choices | Confident, timely decisions |
Start your journey with FineReport and FineBI. Take action now and drive continuous improvement in your organization.
Click the banner below to try FineReport and FineBI for free and empower your enterprise to transform data into productivity!


The Author
Lewis
Senior Data Analyst at FanRuan
Related Articles

Self-Service Analytics Defined and Why You Need It
Self-service analytics lets you analyze data without IT help, empowering faster, data-driven decisions and boosting agility for your business.
Lewis
Jan 04, 2026
Best Self-Service Tools for Analytics You Should Know
See which self-service tools for analytics let business users access data, build dashboards, and make decisions faster—no IT help needed.
Lewis
Dec 29, 2025

Understanding Predictive Analytics Services in 2026
Predictive analytics services use data and AI to forecast trends, helping businesses make informed decisions, reduce risks, and improve efficiency in 2026.
Lewis
Dec 30, 2025


