You want to learn how to make line patterns that look beautiful, no matter your experience. This guide gives you simple steps for both hand-drawn and digital designs. Follow each step in the tutorial to explore different ways to create line patterns. You will see how to make line patterns by hand and with digital tools. This tutorial gives you a clear guide for every step. Try new ideas as you follow the guide. The tutorial shows how to make line patterns easy to master.
What is Line Patterns
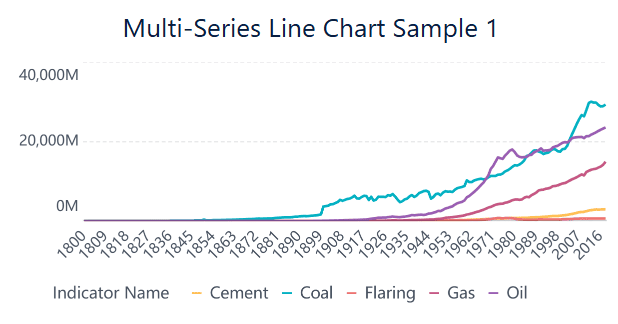
In data visualization, line patterns refer to the styles used to differentiate lines in a chart, especially in line charts or graphs with multiple data series. Instead of just using different colors, line patterns help improve readability and accessibility—especially for print, colorblind users, or complex dashboards.
You see line patterns everywhere, from art to nature. When you create line patterns, you use lines and shapes to build designs that repeat or flow. These patterns can look simple or complex. You can make them by drawing with a pencil, pen, or digital tool. Each pattern starts with a basic idea, like a row of circles or a series of zigzags. You can change the look by adjusting the size, direction, or spacing of the lines and shapes.
Line patterns often appear in abstract art. You do not need to draw a picture of something real. Instead, you use lines and shapes to make designs that feel interesting or beautiful. Abstract pattern art lets you play with ideas and emotions. You can focus on how the lines move or how the shapes fit together. This style gives you freedom to explore.
Tip: Try drawing different shapes, such as triangles, squares, or circles. Combine them with straight or curved lines to see what new patterns you can create.
You can find line patterns in many places. Look at the veins in leaves, the ripples in water, or the tiles on a floor. Artists use these patterns to add texture and movement to their work. When you practice drawing, you learn how to control the lines and shapes. You can make patterns that look calm or energetic. You can also use line pattern art to decorate notebooks, posters, or digital backgrounds.
Abstract pattern art uses lines and shapes in creative ways. You do not have to follow strict rules. You can let your imagination guide you. Some artists use only one type of shape, like circles, and repeat it with different lines. Others mix many shapes and lines to make a busy, abstract design. You can also use color to make the patterns stand out.
Tools for Drawing Line Patterns
When you start creating line patterns, you need the right tools. The tools you choose can change how your drawing looks and feels. You can use simple hand tools or explore digital options. Each tool helps you work with lines, shapes, and patterns in different ways.
Hand Tools
Hand tools give you a direct way to connect with your art. You can feel the paper and control the pressure of your lines. Here are some common hand tools for drawing line patterns:
- Pencils: Use pencils to sketch shapes and lines lightly. You can erase and adjust your drawing as you go.
- Pens and Markers: Pens make bold, clear lines. Markers add color and help you fill in shapes.
- Rulers and Stencils: Rulers help you draw straight lines. Stencils let you trace shapes like circles, triangles, or squares.
- Paper: Choose smooth paper for clean lines. Thicker paper works well if you use markers or ink.
You can mix these tools to create different effects. Try drawing with a pen over a pencil sketch. Use a ruler to make sharp lines, then add freehand shapes for contrast. Experiment with different shapes and see how they fit together in your patterns.
Tip: Keep your hand steady when drawing lines. Practice drawing shapes like circles and triangles until you feel comfortable.
Digital Tools
Digital tools open new ways to create line patterns. You can undo mistakes, use layers, and try many shapes quickly. Digital drawing lets you explore patterns with more freedom.
Tablets and Styluses
A tablet and stylus give you control over your digital drawing. The stylus acts like a pen or pencil. You can draw lines and shapes on the screen. Many tablets sense how hard you press, so you can make thick or thin lines. You can also use your finger to draw, but a stylus gives you more precision.
FineBI for Visualization
FineBI stands out as a powerful tool for advanced pattern visualization. You can use FineBI to turn your line patterns into interactive dashboards. FineBI connects to many data sources and helps you create data-driven designs. You can drag and drop shapes, lines, and charts to build patterns that show real information. FineBI also lets you filter and explore your patterns in real time. This tool works well if you want to combine art with data or create patterns for business and manufacturing.

Note: FineBI makes it easy to share your patterns with others. You can publish your designs and let your team explore them on any device.
You have many choices for drawing line patterns. Try both hand and digital tools. See how different shapes and lines work together. Each tool gives you new ways to create and share your patterns.
Basic Drawing Line Patterns Techniques
Creative Tips
You can improve your line patterns by practicing and exploring new ideas every day. Many artists recommend filling a sketchbook with freehand doodles. This step helps you build fine motor skills and keeps your creativity active. Try using different drawing tools and materials. Charcoal, pastels, Neocolors, and various pens each make unique marks. When you switch tools, you see how your lines and shapes change.
Challenge yourself by drawing shapes that seem difficult or frustrating. This step helps you understand complex forms and makes your patterns more interesting. Drawing knots can give your mind and hand a creative workout. You learn to control your lines and connect shapes in new ways.
Capture scenes from daily life quickly. Focus on the main idea, not perfect details. This step trains you to translate what you see into lines and shapes. Try creating mandalas freehand. Aim for rough symmetry without using a ruler. This practice helps you repeat shapes and lines with control.
Relax and play with rough sketches. Draw organic shapes and let your hand move freely. You do not need to copy exact forms. Use index cards for small designs or hand-lettering practice. These cards give you a space to experiment with abstract pattern art.
Drawing is a gradual process. Be patient and notice your progress over time. Avoid perfectionism. Let your lines flow naturally instead of relying on rulers. This step builds confidence and helps you create abstract patterns that feel alive.
Tip: When drawing your own abstract pattern, focus on the movement of lines and the way shapes interact. Let your imagination guide you.
Mistakes to Avoid
When you start with line pattern art, you might face some common mistakes. Knowing these mistakes helps you avoid frustration and improve your results. The table below shows frequent issues and ways to solve them:
| Common Mistake | Description / Issue | Effective Strategy / Solution |
|---|---|---|
| Jumping to CAD too soon | Locking in suboptimal designs early by starting CAD layouts prematurely. | Begin with block layouts, ignore constraints initially, focus on flow and material delivery, experiment with options before CAD. |
| Not using In-Process Kanbans (IPKs) | Avoiding IPKs as waste, leading to inefficiencies and lack of buffers between workstations. | Use IPKs as buffers and demand signals; test with simulation; learn various IPK techniques and apply appropriately. |
| Too much line-side material | Excessive parts at workstations reduce productivity and consume space. | Limit line-side material to modest amounts; design frequent delivery routes; use Kanban supermarkets. |
| Overstaffing | Assigning one operator per station without cross-training causes imbalance and lost production. | Understaff lines; cross-train operators; observe actual workload and adjust staffing accordingly. |
| Designing from the conference room | Relying on memory and meetings rather than floor data leads to inaccurate designs. | Collect data and create Value Stream Maps on the factory floor; involve operators in design discussions. |
| Not understanding “process” | Mixing different types of work or incorrect process mapping leads to confusion and inefficiency. | Define processes as sequential, same-type work; avoid mixing major equipment or varying volumes in one process. |
| Misconnecting upstream processes | Incorporating unpredictable shared resources directly into the main line causes disruptions. | Separate these via Kanban supermarkets; treat fabrication separately; reduce quantities through changeover improvements. |
| Under-resourcing optional processes | Designing capacity based on average demand causes bottlenecks when demand peaks. | Sequence builds to avoid back-to-back options; over-resource based on peak demand; use FIFO lanes; combine methods. |
| Excessive operator part selection | Operators spending too much time selecting parts increases cycle time, especially with short Takt times. | Provide only necessary parts; design workstations to minimize motion and avoid operators leaving or turning around. |
You can avoid these mistakes by following each step carefully. Start with simple block layouts before moving to digital tools. Use buffers and signals to keep your workflow smooth. Limit the number of shapes and materials at your workstation. Cross-train and observe your process to find the best balance. Always collect real data and involve everyone in the design step. Define your process clearly and keep similar work together. Separate unpredictable resources and plan for peak demand. Give operators only what they need to keep the step efficient.
Note: When you create abstract patterns, focus on the flow of lines and the relationship between shapes. This approach helps you avoid common pitfalls and makes your abstract pattern art more dynamic.
Practicing these steps helps you master drawing and line patterns. You will see your abstract designs become more creative and organized. Each time you draw, you learn more about how lines and shapes work together. Over time, you will develop your own style and confidence in drawing line patterns.
How to Make Line Patterns Digitally
Creating digital line patterns gives you more flexibility and control than drawing by hand. You can experiment with shapes, colors, and layouts without worrying about making mistakes. You can also save your work, edit it later, and share it easily. This section will show you how to make line patterns using different software. You will learn which tools to choose and follow step-by-step instructions for each method.
Choosing Software
You have many options when you want to make line patterns digitally. Each program offers unique features. Some focus on drawing, while others help you visualize data or create interactive designs. You should pick the software that matches your goals and skill level.
FineBI Features
FineBI stands out if you want to combine art with data. You can use FineBI to create digital line patterns that are not only beautiful but also meaningful. FineBI lets you connect to many data sources, such as Excel files, databases, or cloud platforms. You can drag and drop shapes, lines, and charts to build your pattern. FineBI helps you filter and explore your design in real time. You can also publish your work and let others interact with your patterns on any device.
FineBI offers these key features for digital line patterns:
- Data integration: Connect to over 60 types of data sources.
- Visual exploration: Use drag-and-drop tools to build your pattern.
- Real-time filtering: Change your design instantly by adjusting filters.
- Dashboard publishing: Share your patterns with your team or clients.
- Responsive design: View your patterns on computers, tablets, or phones.

If you want to make line patterns that show trends, relationships, or business data, FineBI is a strong choice. You can turn raw numbers into creative designs that tell a story.
Other Options
You can also use popular drawing programs to make line patterns in illustrator, procreate, or photoshop. Each tool has its strengths.
- Adobe Illustrator: You can make line patterns in illustrator using vector tools. This lets you scale your design without losing quality. Illustrator works well for geometric patterns and precise layouts.
- Procreate: If you use an iPad, you can make line patterns in procreate. The app gives you many brushes and layers. You can draw freehand or use symmetry tools for repeating designs.
- Photoshop: You can make line patterns in photoshop by drawing with brushes or using shape tools. Photoshop lets you add textures, colors, and effects to your patterns.
You should try each program to see which one feels best for your workflow. Some artists use more than one tool to finish their designs.
Digital Drawing Steps with FineBI
Data Preparation
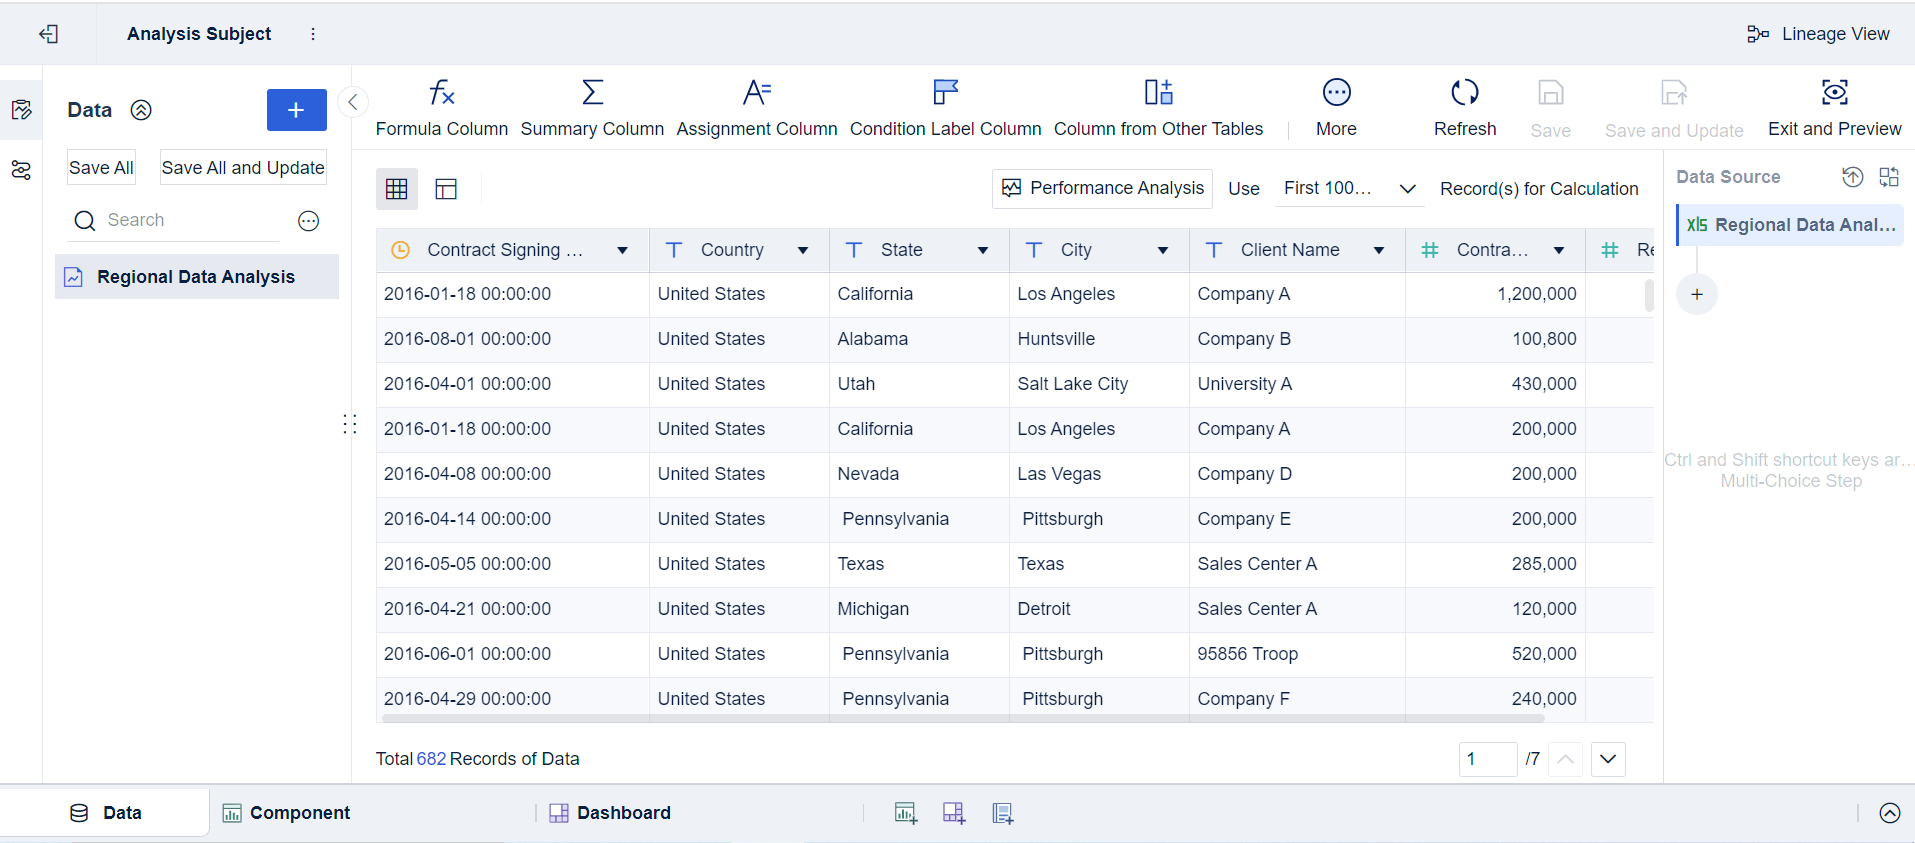
- Click My Analysis, click a folder, and click New Subject.
- Click Local Excel and click Upload Data, as shown in the following figure.
Component Creation
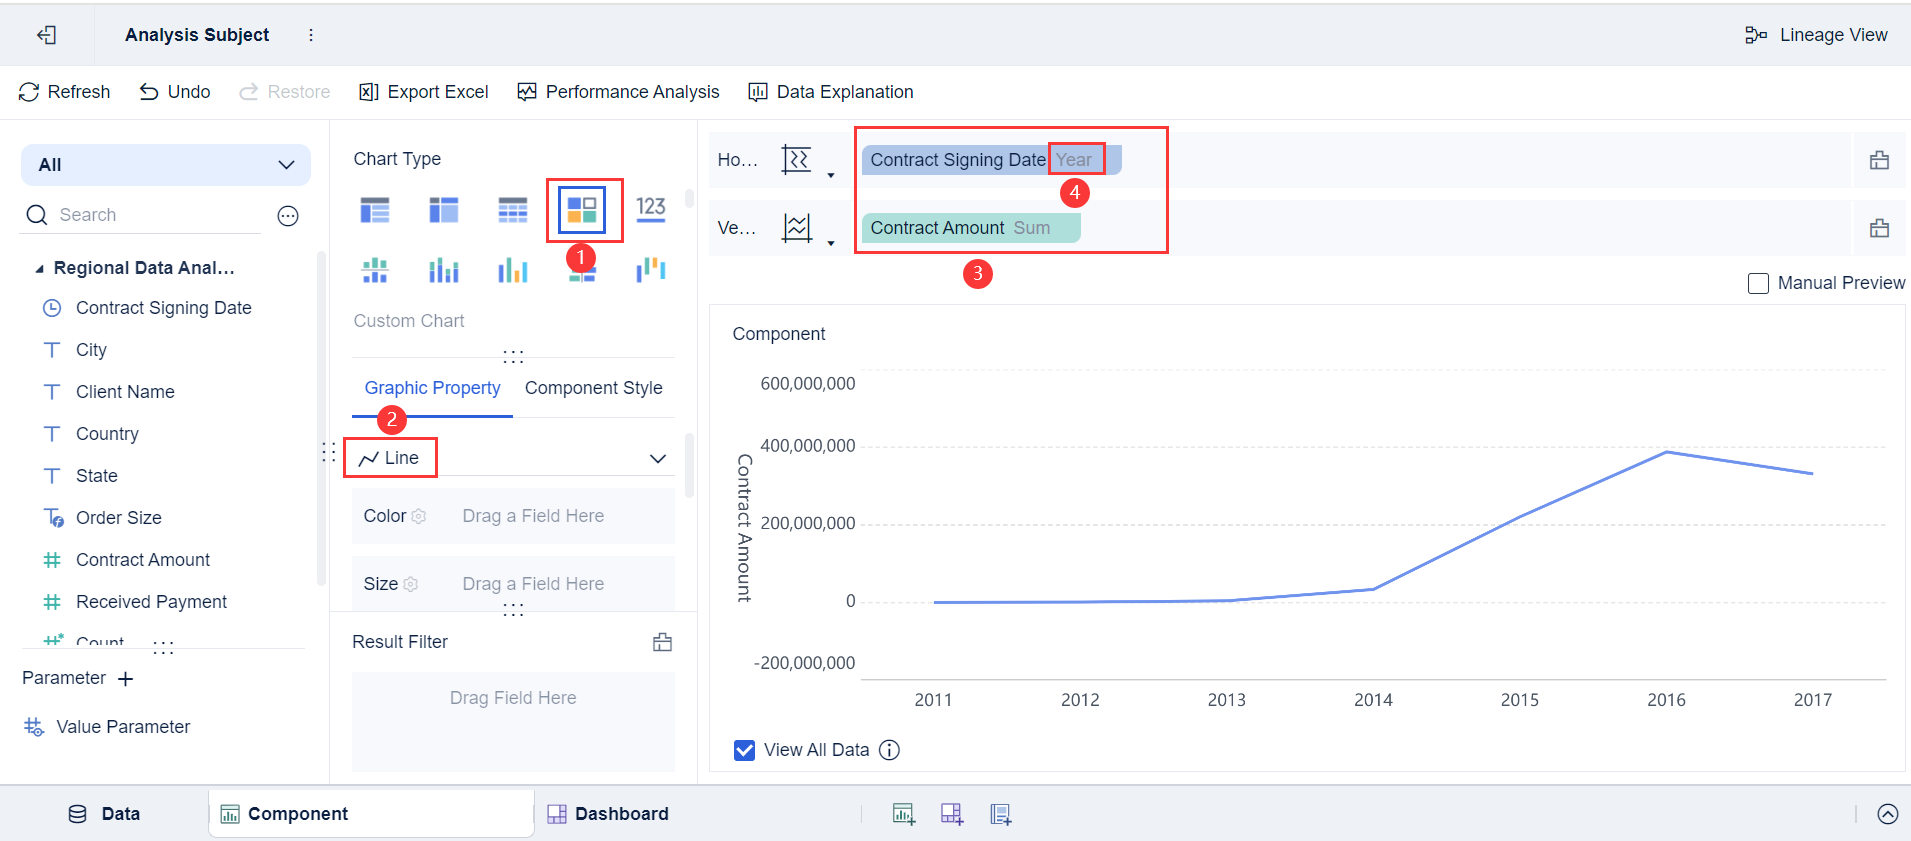
- Click Add Component in the lower left corner.
- Click the Custom Chart icon in Chart Type and choose Line from the drop-down list in Graphic Property. Drag Contract Signing Date to Horizontal Axis and Contract Amount to Vertical Axis.
- Hover the cursor over the Contract Signing Date field on the horizontal axis, click the ▼ icon, and choose Year from the drop-down list to display the trend of the contract amount in different years, as shown in the following figure.
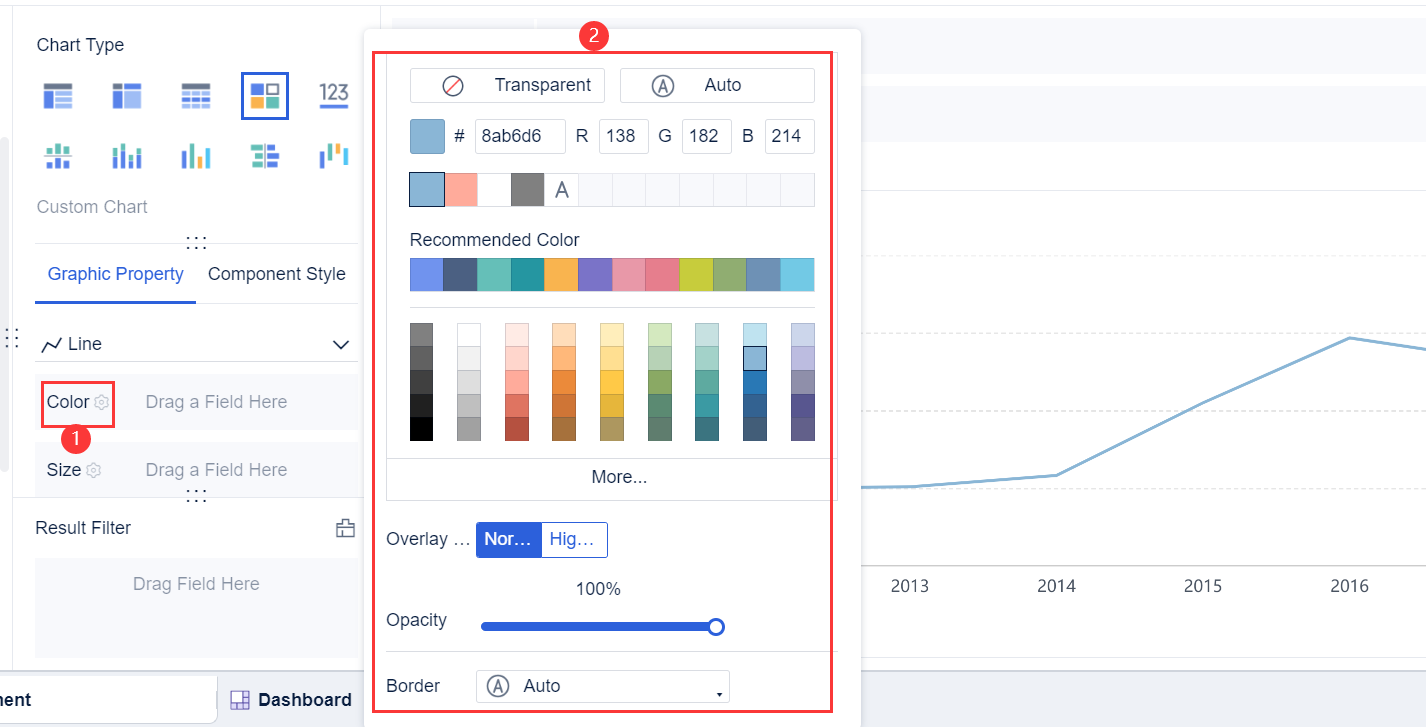
Component Beautification
Comparing FineBI with Other Digital Tools
You might wonder how to make line patterns in different programs. Here is a table to help you compare FineBI, Illustrator, Procreate, and Photoshop:
| Feature | FineBI | Illustrator | Procreate | Photoshop |
|---|---|---|---|---|
| Data Integration | Yes (over 60 sources) | No | No | No |
| Drag-and-Drop Design | Yes | Limited | No | No |
| Vector Drawing | No | Yes | No | Limited |
| Freehand Drawing | No | Yes | Yes | Yes |
| Real-Time Filtering | Yes | No | No | No |
| Dashboard Publishing | Yes | No | No | No |
| Layer Support | Yes | Yes | Yes | Yes |
| Device Compatibility | All devices | Desktop | iPad | Desktop |
FineBI works best if you want to make line patterns that use real data or need interactive features. Illustrator, Procreate, and Photoshop give you more freedom for freehand drawing and artistic effects. You can use these programs to make line patterns in illustrator, make line patterns in procreate, or make line patterns in photoshop, depending on your device and style.
You now know how to make line patterns using digital tools. Try each step and see which method fits your needs. Digital line patterns let you explore endless creative ideas. You can combine art and data to make patterns that are both beautiful and meaningful.
FineBI for Line Patterns Visualization
FineBI gives you a powerful way to turn line patterns into interactive visualizations. You can use this tool to explore, analyze, and share your designs. FineBI works well for both creative projects and business needs. Many companies in manufacturing use FineBI to spot trends, track performance, and make better decisions.
Data-Driven Patterns
You can create line patterns that reflect real data. FineBI lets you connect to over 60 data sources, such as Excel files, databases, or cloud platforms. You can drag and drop data fields to build patterns that show sales trends, production lines, or quality checks. Each line or shape in your pattern can represent a different metric or process.

For example, you might use parallel lines to show production flow. You can use zigzags or waves to highlight changes in quality or output. FineBI helps you turn raw numbers into clear, visual stories. This approach makes it easy to spot problems or successes at a glance.
Tip: Use color and thickness to make important lines stand out in your pattern.
Dashboard Integration
FineBI makes it simple to combine your line patterns with other charts and visuals. You can build dashboards that show all your key information in one place. Add tables, bar charts, or maps next to your line patterns for a complete view.
You can customize the layout by dragging and resizing each component. FineBI supports responsive design, so your dashboard looks good on any device. You can also add filters and controls. This lets you and your team explore the data behind each pattern.
Here is a quick look at what you can include in a FineBI dashboard:
| Component | Purpose |
|---|---|
| Line Patterns | Show trends and flows |
| Bar Charts | Compare quantities |
| Tables | List detailed data |
| Maps | Visualize locations |
Note: You can save and share your dashboards with others. This makes teamwork and feedback easy.
Real-Time Exploration
FineBI gives you tools for real-time data exploration. You can apply filters to your line patterns and see instant updates. This feature helps you answer questions quickly. For example, you can filter by date, product, or region and watch your pattern change.
You can also use FineChatBI, a conversational tool inside FineBI. Just type a question, and FineChatBI shows you the answer with a chart or pattern. This makes data analysis simple, even if you do not have technical skills.
You can export your results as images or Excel files. You can also publish your dashboard for others to view on their own devices.
FineBI helps you turn complex data into clear, interactive line patterns. You can explore, share, and act on your insights with confidence.
You now know how to create beautiful line patterns by hand and with digital tools. Try pencils, pens, or digital software like FineBI to see which method you enjoy most. Explore new shapes, mix techniques, and let your creativity grow. Share your patterns with friends or online. If you want to try something new, use FineBI for data-driven designs. Start drawing today and discover your own unique style!
Click the banner below to try FineBI for free and empower your enterprise to transform data into productivity!

Continue Reading About Line Patterns
16 Types of Chart for Effective Data Visualization
22 Different Types of Graphs in Data Visualization: A Practical Guide


FAQ

The Author
Lewis
Senior Data Analyst at FanRuan
Related Articles

10 Good Data Visualization Examples by Use Case: Sales, Surveys, Finance & Time-Series
If you are searching for $1 , you likely do not need another gallery of pretty charts. You need examples that help sales leaders hit targets, finance teams explain variance, operations managers monitor change, and analys
Yida Yin
Jun 15, 2026

12 Best Data Visualization Tools for 2026: Features, Pricing, Pros and Cons
$1 are software platforms that turn raw data into charts, dashboards, maps, and interactive visual stories for analysis and decision making. 12 best data visualization tools for 2026 at a glance
Lewis Chou
Apr 23, 2026

Top 8 Data Visualization softwares You Should Try in 2026
Compare the top 8 data visualization software for 2026, including FineReport, Tableau, Power BI, and more to find the best fit for your business needs.
Lewis
Mar 19, 2026