You step into the role of a junior data analyst and find that your days move quickly. You handle a mix of tasks—reviewing fresh data, cleaning up messy details, and building reports that help your team make decisions. Tools like Excel, SQL, and Python become your daily companions. This role asks you to spot trends, answer questions, and share insights with others. If you wonder how to become a data analyst or how to get started as an entry-level data analyst, you’ll see that curiosity, teamwork, and a sharp eye for detail matter most.
Typical Day in the Life of a Junior Data Analyst

Have you ever wondered what a junior data analyst does each day? You start your day by making a plan. At the end of the day, you share what you learned to help your team. Let’s look at what a data analyst does during a normal day, step by step, so you can see how everything fits together.
Morning Task Planning
You begin by checking your calendar and looking at your to-do list. Most junior data analysts join a short team meeting. In this meeting, you talk about your main jobs for the day and any problems you have. Your manager might give updates or talk about yesterday’s work. This meeting helps you know what to do first and what is most important.
A normal morning for a data analyst includes these things:
| Time of Day | Activities |
|---|---|
| Morning | Team meetings, collecting data with SQL, fixing data, and using tools to look at data. |
You check your email for new requests or messages from other teams. Sometimes, you get a small project to start your day, like updating a dashboard or finding new numbers for a report. You open FineBI or your spreadsheet tool and get ready to work with data.
Data Gathering and Integration
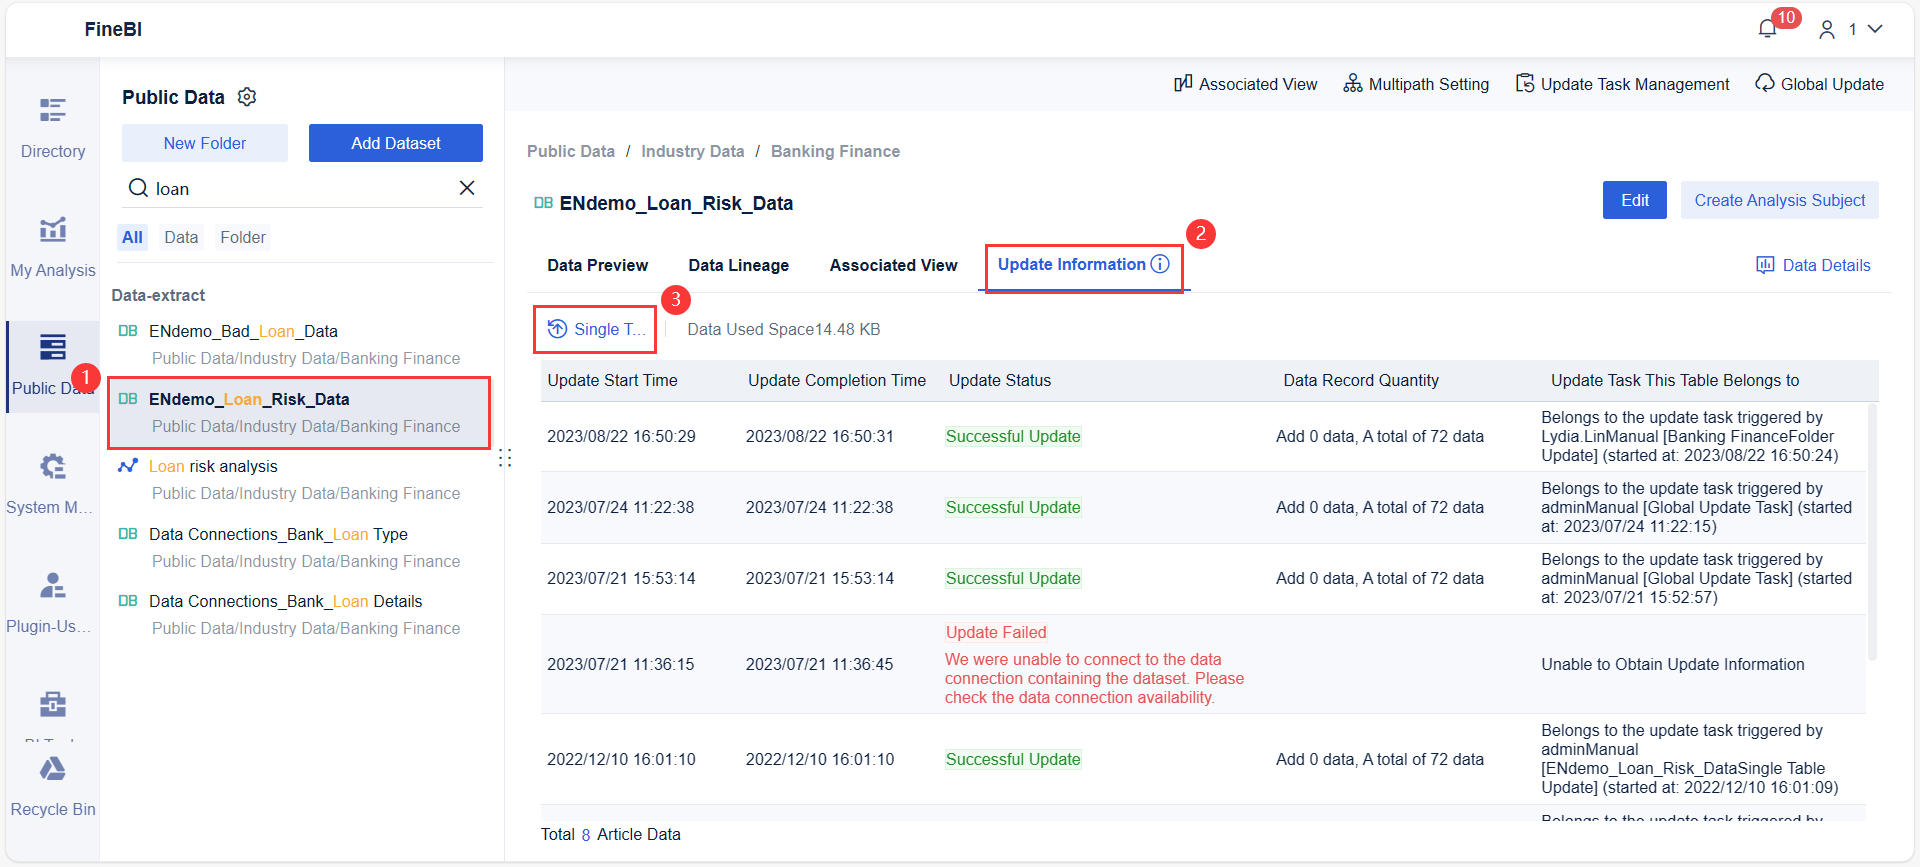
Next, you start collecting data. This means getting data from different places. You might connect to a database, download a CSV file, or use FineBI to get data from the cloud. FineBI helps because you can connect to many types of data, like MySQL, Excel, or APIs, without writing code.
You often need to put data from different places together. For example, you might join sales data with customer feedback. FineBI helps you bring all this data into one place. You can set up updates so your dashboards always have the newest numbers. This saves time and keeps your reports correct.
Collecting data is a big part of your daily work. You make sure you have all the data you need before moving on.

Data Cleaning on a Daily Basis
Now you clean the data. This is one of the most important jobs. Many junior data analysts spend a lot of time making sure the data is correct. Bad data can give wrong answers, so you fix problems before you start looking at the data.
Here are some common data cleaning jobs you do every day:
- Fixing missing data
- Removing repeats
- Correcting mistakes
- Changing data to make it right and the same
- Deleting empty rows and columns
- Making sure tables have unique IDs
- Checking and fixing spelling mistakes
- Removing extra spaces or special marks
- Joining tables from different places
- One-hot encoding for categorical data
FineBI gives you tools to clean your data without coding. You can change field names, fix empty values, and make formats the same with a few clicks. This makes your work faster and helps you avoid mistakes.
Many analysts say cleaning data is one of the hardest parts of their day. You might spend hours making sure everything is right. But this step is very important for good data analysis. If you skip it, your results might not be correct.
Data Analysis and Reporting
When your data is clean, you start analyzing it. You look for patterns, trends, or answers to business questions. Maybe your manager wants to know why sales went down last month. You use FineBI or other tools to do math, make summaries, and look at the numbers.
A normal day for a data analyst includes:
| Responsibility | Description |
|---|---|
| Data Analysis | Collecting, looking at, and putting together different data to make reports for clients. |
| Collaboration | Working with project leaders and other teams to share data ideas. |
| Reporting | Making reports that help people make decisions and plans. |
You might make a quick report or update a dashboard. Sometimes, you explain your findings to your team or answer questions. FineBI lets you make reports that are easy to share and read. You can add notes, highlight important things, and set alerts for big changes.
You also work with other teams, like marketing or finance, to make sure your work helps them. Good communication is a big part of your job. You learn to explain hard ideas in simple words so everyone understands.
Visualizations and Dashboards with FineBI
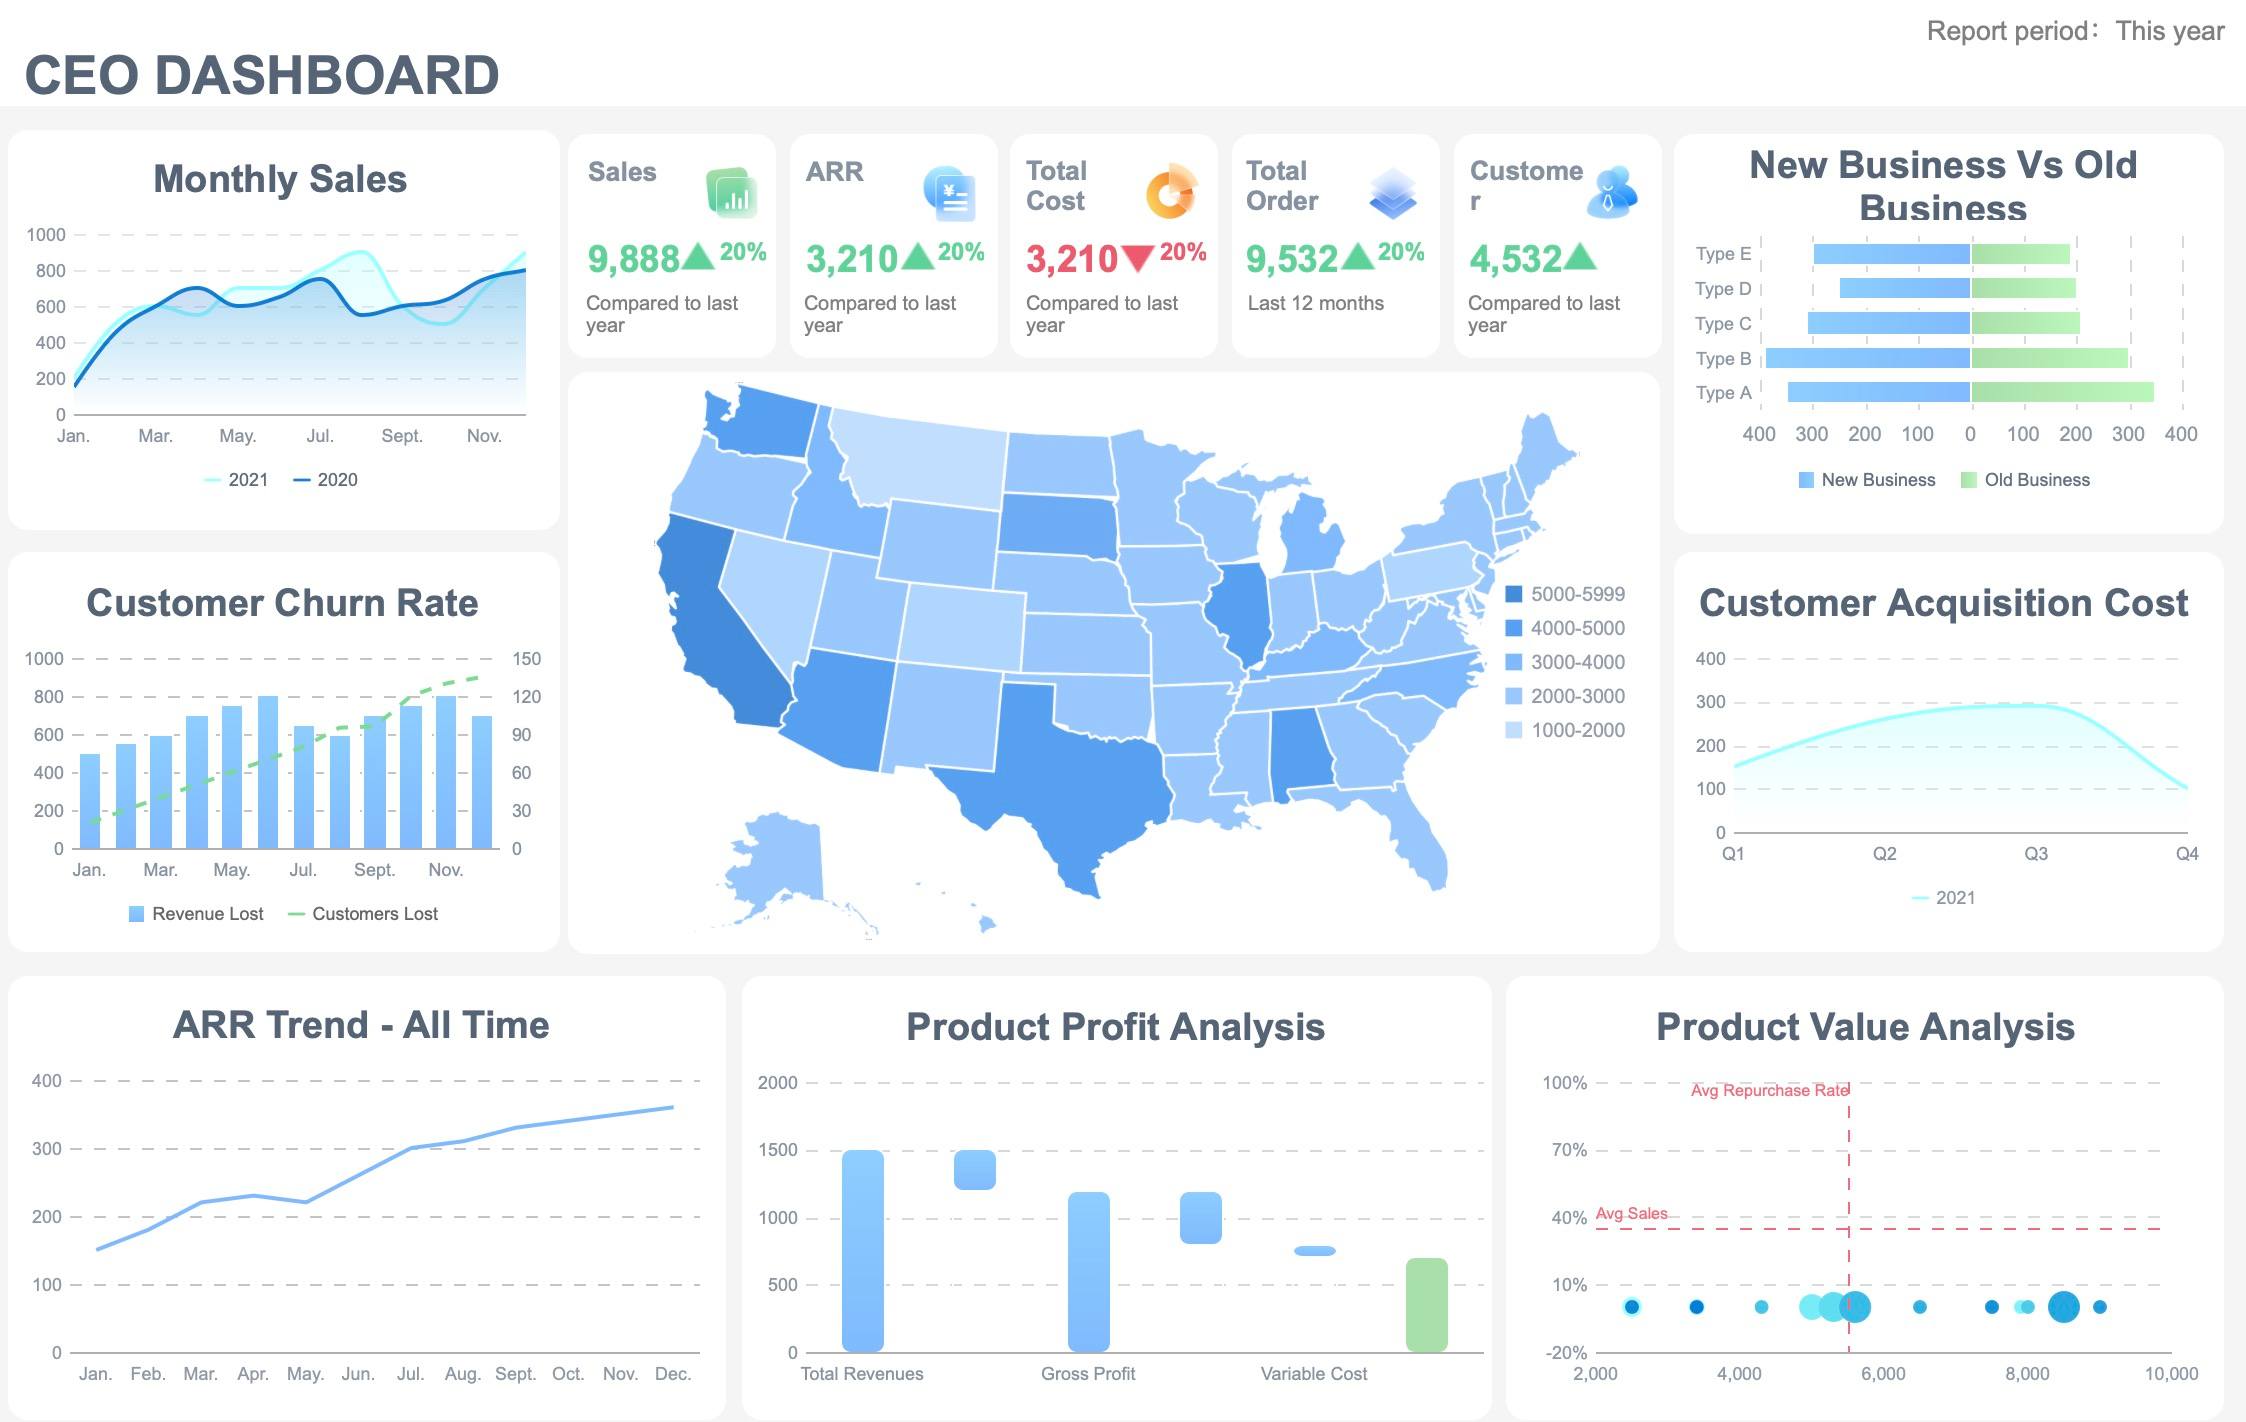
The last step is making your analysis easy to see. Data visualization helps people see trends and make choices faster. FineBI makes this easy with dashboards you can build by dragging and dropping. You can make bar charts, line graphs, maps, and more without coding.
You change your dashboard to show the most important numbers. For example, you might track sales by region, customer happiness, or website visits. FineBI lets you filter data in real time, so your team can look at different views and find answers fast.
Sharing dashboards is easy. You can send them to your team or set who can see private data. FineBI also tracks who looks at your reports, which helps keep data safe.
Here’s a real example. Merry Electronics, a leader in electronic acoustics, used FineBI to make reporting faster and let workers do their own analysis. Before FineBI, the IT team spent too much time making reports. Now, business users can make their own dashboards and answer questions themselves. This made the company work better and helped them get ready for future AI projects.
Every day, you repeat these steps—planning, collecting data, cleaning data, analyzing, and sharing what you find. Each day brings new questions and new data to look at. As a junior data analyst, you help your company make smart choices.
Tip: The best analysts keep learning and ask lots of questions. If you get stuck, ask your team or use training tools. Over time, you will get faster and feel more sure about your data skills.

Essential Tools for Entry-Level Data Analysts
When you start as a data analyst, the right tools help a lot. These tools make it easier to work with data and share what you find. Let’s see which tools you will use most days.
FineBI for Self-Service Analytics
FineBI is a great tool for new data analysts. You can use it to connect to many kinds of data. It helps you clean up messy data and make dashboards. You do not need to write code to use it. FineBI lets you look at data and make nice reports. You can drag charts, filter data fast, and share dashboards with your team.
Here are some features that help you learn data skills:
| Feature | Description |
|---|---|
| Data Classification | You can sort data by business topics to understand it better. |
| Data Modeling | You can set up how data is linked for easier exploring. |
| Visual Data Analysis | You can find problems and get chart ideas for faster work. |
| Self-Service Datasets | You can add columns, filter, and join data with a few clicks. |
| Data Visualization | You can pick from many charts and change your reports to show data better. |
FineBI helps you at every step, from getting data to sharing what you learn. You can work with big sets of data and clean them fast. You can build dashboards that help your team make choices. This tool makes analytics easy and helps you grow as a data analyst.
Spreadsheets and SQL Basics
You will use spreadsheets like Excel almost every day. They let you keep, change, and look at data without coding. Excel is good for quick math, making charts, and simple reports. Many new analysts start with Excel because it is easy.
SQL is another skill you will use a lot. You can use SQL to read, change, and mix data from different places. SQL helps you work with big sets of data and do things like pivot tables but bigger. You can learn SQL fast, and it helps you handle hard data jobs.
Other tools you might use in data analytics are:
- Qualtrics for surveys and managing data
- RStudio for math analysis and reports
- OpenRefine for fixing messy data
- InetSoft for business analytics
These tools help you learn more data skills and do many kinds of analytics work.
Communication Platforms
You need to talk with your team and share your work. Most junior analysts use Slack, Zoom, and Microsoft Teams. These tools help you ask questions, join meetings, and work on projects together. Good talking skills are important for data analysts, especially when you explain your findings or need help.
When you use the right tools, you can do data tasks with confidence. Each tool helps you in its own way and makes your work smoother and better.
Projects and Collaboration in a Data Analyst’s Daily Basis
Routine and Ad-Hoc Projects
A data analyst works on many projects each day. Some jobs happen every week. Other jobs come up without warning. You might start your day with a sales report. Later, you might work on a special project. Your daily work often looks like this:
| Responsibilities | Description |
|---|---|
| Monitor sales and performance | Track key metrics and find ways to grow. |
| Prepare reports | Make regular and special reports for the business team. |
| Collaborate with teams | Work with other analytics teams to do more together. |
| Lead projects | Start and lead your own analytics projects. |
You make reports that show important numbers and trends. These reports help your team see what is happening. They also help your team make good choices. If a manager needs an answer fast, you do quick data analysis to help.
Teamwork and Stakeholder Meetings
You do not work by yourself. Each day, you meet with your team. These meetings help you know what your team and others need. Here are some ways you work with people:
- Meet with your team to talk about tasks and share news.
- Listen to feedback from people who use your data.
- Show how your work helps the business reach its goals.
- Share new insights during weekly dashboard reviews, so everyone knows the latest numbers.
You use these meetings to ask questions and get advice. You also make sure your work matches what the business wants. Good teamwork helps you finish projects and get better results.
Using FineBI for Collaborative Analysis
FineBI helps you work with your team easily. You can make dashboards and share them fast. When you finish a project, you publish your work so others can see it. FineBI lets you choose who can see private data.
Your team can leave comments or ask for new things on dashboards. This helps everyone get better at data analytics. FineBI also shows who looks at each report, so you know what is important.
Merry Electronics is a real example. Before FineBI, their IT team made all the reports. After FineBI, business users did their own data analysis and made their own dashboards. This gave the IT team more time and helped the company use data better. Now, teams at Merry Electronics can track KPIs, share dashboards, and respond to new needs every day.
Tip: Use FineBI’s sharing tools to keep your team updated on key numbers. When everyone sees the same data, projects move faster and results improve.
As a junior data analyst, you do many jobs every day. You gather data and fix mistakes in it. You look for patterns and trends in the data. You also make reports to show what you find. Here are your main jobs:
| Daily Responsibilities of Junior Data Analysts |
|---|
| You collect and clean data to fix mistakes. |
| You look for trends and patterns to find chances and risks. |
| You make reports and charts with SQL, Python, Excel, and Tableau. |
| You work with teams in marketing, finance, and product development. |
FineBI and other tools help you work better. You can make dashboards and look at data with your team. These tools help you get better at data analysis. They also help you in your data analyst job. Working with your team and using self-service analytics helps you do well. Real-time insights also help you succeed as a new data analyst.

Continue Reading About Junior Data Analyst
How Do Data Analyst Jobs Differ in Startups and Big Companies?


FAQ

The Author
Lewis
Senior Data Analyst at FanRuan
Related Articles

What Is Business Management? A Real-World Guide to Strategy, Operations, Finance, and People
$1 is the discipline of turning goals into results. It connects strategy with execution, money with decisions, and people with performance. Whether a company has 5 employees or 50,000, strong management is what keeps pri
Lewis Chou
Jun 24, 2026

What Recruiters Look for in a Data Analysis Portfolio: 10 Criteria to Score Yours Fast
A $1 is not judged like a school assignment. It is judged like a hiring shortcut. Recruiters, hiring managers, and analytics leads use it to answer one question fast: Can this person solve business problems with data in
Lewis Chou
May 29, 2026

What Is Data Analytics Consulting? Beginner’s Guide to Services, Deliverables, and Business Value
$1 helps organizations turn raw data into decisions they can trust. For many business leaders, the challenge is not a lack of data. It is a lack of clarity. Reports conflict, teams track different KPIs, dashboards are un
Lewis Chou
Jun 03, 2026