MS Report Builder gives you a simple way to create detailed reports from your data. You use it to turn raw numbers into clear visuals and tables. Both business professionals and technical users rely on this tool to make sense of information. Reporting tools like MS Report Builder help you work smarter.

MS Report Builder is a standalone report creation tool from Microsoft. You use it to design and publish paginated reports. This tool works as part of the Microsoft reporting ecosystem. You do not need advanced technical skills to get started. The interface uses drag-and-drop features, so you can build reports quickly.
You can launch Report Builder from your browser. It runs on your computer without needing special permissions. You only need to be part of the Report Consumer role to access its features. The tool connects with other Microsoft products, such as SQL Server and Power BI. This makes it easy for you to pull data from different sources and create detailed reports.
Here is a quick look at the core components and how they work together:
| Component | Description |
|---|---|
| Report Builder | A ClickOnce, ad hoc report authoring and publishing tool with drag-and-drop functionality. |
| Deployment | Deployed from a browser, runs on client computers without requiring administrative permissions. |
| Permissions | Users must have appropriate permissions and be part of the Report Consumer role. |
| Report Model Designer | Interacts with Report Builder to create reports based on published report models. |
| Report Manager | Provides a toolbar button to launch Report Builder and manage reports. |
You can see that MS Report Builder fits well into the Microsoft environment. It gives you the flexibility to create, manage, and share paginated reports with ease.
You will find that Report Builder offers many features to help you turn raw data into useful information. The tool supports paginated reports, which means you can create documents that look good both on screen and on paper. You can control every detail of the layout, making your reports clear and professional.
Here are some of the main functions you can use:
The following table highlights the main use cases:
| Use Case | Description |
|---|---|
| Self-Service Reporting | Enables non-technical users to generate their own reports and insights from raw data. |
| Internal Insights | Allows less technical users to access and analyze internal company data for decision-making. |
| External Insights | Facilitates users in gaining insights about product usage and performance. |
| Industry Applications | Applicable across various sectors such as E-Commerce, Healthcare, and Fintech for data analysis. |
MS Report Builder also integrates with other Microsoft products. You can connect to SQL Server, Analysis Services, and Power BI datasets. This lets you use data from many sources in your reports. You can also export your reports to formats like Microsoft Excel.
Here is a summary of how Report Builder fits into the Microsoft reporting ecosystem:
| Feature | Description |
|---|---|
| Authoring Environment | Stand-alone tool for creating paginated reports outside of Visual Studio. |
| Data Sources | Connects to various data sources including SQL Server, Analysis Services, and Power BI Datasets. |
| Report Parameters | Allows customization of data and report presentation by users. |
| Export Options | Reports can be exported to formats like Microsoft Excel. |
| Integration with Power BI | Complements Power BI's interactive capabilities with paginated reports. |
Tip: You can use Report Builder to create highly formatted, print-ready reports. This is useful when you need to share information with others in a clear and organized way.
MS Report Builder stands out as a flexible and user-friendly report creation tool. You can use it for many business and technical tasks, from simple data summaries to complex paginated reports.
MS Report Builder gives you a strong set of tools for creating paginated reports. You can use its intuitive interface to design, connect, visualize, and share your data. These features help you turn raw information into clear, actionable insights. Many of these capabilities are also available in other advanced reporting solutions, such as FineReport by FanRuan, which supports efficient report creation and data integration for business users.
You can start building reports with the report design tool in MS Report Builder. The drag-and-drop layout makes it easy for you to add tables, charts, and images. You can format text boxes and individual items to improve readability and appearance. The Properties dialog box lets you change formatting options for selected items quickly. Tutorials guide you through the process, so you can learn how to format text and structure your reports.
You can also:
| Feature | Description |
|---|---|
| Formatting Text Boxes | Format text boxes and items for better readability and appearance. |
| Properties Dialog Box | Change formatting options for selected items easily. |
| Tutorial Availability | Access tutorials for quick start on formatting text in reports. |
FineReport by FanRuan also provides a user-friendly report designer, allowing you to create pixel-perfect documents and dashboards with ease.
You can connect MS Report Builder to many types of data sources. This flexibility lets you pull information from different systems and combine it in one report. You can use shared data sources, embedded data sources, and even connect to SharePoint lists or XML files. The tool supports integration with SQL Server Reporting Services, which means you can access data from SQL Server, Analysis Services, and other enterprise databases.
Common data sources include:
You can create data sources using the Report Manager web application, from a SharePoint document library, or in a SQL Server Data Tools report project. The query designer helps you build and test queries, making it easier to get the right data for your reports. You can also use shared data sets to standardize data access across multiple reports.
Security is important when you connect to data. MS Report Builder supports secure connections using Windows Authentication, including Kerberos protocol for delegation and impersonation. You can enter report server credentials in the Reporting Services sign-in dialog and save them securely. The system can prompt you for credentials, store them securely, or use Windows integrated security, depending on your needs.
FineReport by FanRuan also supports integration with a wide range of data sources, including databases, files, and cloud services, making it easy for you to centralize your data.
You can present your data using a variety of powerful visuals in MS Report Builder. The tool offers many chart types, so you can choose the best way to show your information. These visuals help you spot trends, compare values, and understand relationships in your data.
| Chart Type | Description |
|---|---|
| Area Charts | Show trends over time. |
| Bar Charts | Compare quantities across categories. |
| Column Charts | Display data changes over time. |
| Line Charts | Show trends in data over time. |
| Pie Charts | Show proportions of a whole. |
| Polar Charts | Display data in a circular format. |
| Range Charts | Show ranges of data. |
| Scatter Charts | Show relationships between variables. |
| Shape Charts | Visualize data in a non-standard format. |
| Sparklines | Show trends in a compact form. |
| Stock Charts | Display stock price movements. |
You can use the query designer to select and shape the data you want to visualize. Paginated reports let you control the layout, so your visuals look great both on screen and in print. FineReport by FanRuan also offers a wide range of visualization options, including interactive dashboards and 3D charts, to help you explore your data in depth.

After you create your paginated reports, you can export them in many formats. This makes it easy to share your findings with others or use the data in other applications. Supported export formats include:
You can distribute your reports through SQL Server Reporting Services, email, or shared folders. This flexibility ensures that everyone in your organization can access the information they need. FineReport by FanRuan also supports multiple export formats and sharing options, making collaboration simple and efficient.
Tip: Use export options to deliver paginated reports in the format your audience prefers. This helps you reach more people and ensures your message is clear.
MS Report Builder stands out for its intuitive interface, strong data connectivity, and advanced visualization features. You can create, customize, and share paginated reports with ease. Many of these features are also available in FineReport by FanRuan, which supports efficient report design and data integration for business intelligence.
You can use ms report builder to improve your business reporting process. This tool helps you create clear, consistent, and professional reports. When you use report builder, you gain several advantages:
Tip: Consistent and secure reporting helps you build trust with stakeholders and meet regulatory requirements.
Report builder gives you strong data analysis capabilities. You can create detailed reports, control access, and use secure authentication. The table below shows some key features:
| Capability | Description |
|---|---|
| Report Creation | You can easily create reports backed by your business data. |
| Access Control | You set permissions, so only the right people see the right data. |
| Authentication | You use secure, token-based authentication for extra protection. |
Technical users also benefit from advanced analytics features:
| Feature | Description |
|---|---|
| Paginated Reports | You create detailed reports that print or export with precise formatting. |
| Integration with Data Sources | You connect to many data sources for deeper analysis. |
| Advanced Data Modeling | You use tools for complex data modeling and in-depth analysis. |
| Self-Service Analytics | You build and customize reports without waiting for IT support. |
You can find similar benefits in FineReport by FanRuan. FineReport supports business reporting and data analysis in industries like manufacturing and finance. For example, in manufacturing, you use FineReport to track production schedules, monitor quality, and control costs. In finance, you automate financial statements, manage budgets, and visualize key metrics. FineReport connects to many data sources, offers pixel-perfect report design, and supports secure sharing. You can also use dashboards and mobile access to keep your team informed anywhere.

Note: Both tools help you turn data into insights, improve efficiency, and support better decision-making.
When you start creating your first report in MS Report Builder, you follow a clear process. This helps you build both simple or complex reports with confidence. Here is a step-by-step guide to get you started:
As you design, you can manage page size and layout to avoid overflow. Pre-process your data in SQL queries for better performance. Set parameters in the right order and style your graphs for clarity. These steps make creating your first report smooth and efficient.
FineReport by FanRuan also offers a streamlined workflow. You use a drag-and-drop interface to connect to data sources, design layouts, and publish reports quickly. This approach saves time and reduces errors, whether you build simple or complex reports.
After creating your first report, you have several ways to share and collaborate with others. You can save shared datasets to a report server or SharePoint site, making them available for other reports. To add a shared dataset, open Report Builder, select the shared dataset, and specify the fields you want to include.
MS Report Builder supports collaborative workflows. You can automate report generation and distribution at set intervals. Reports reach the right people through email, shared folders, or web portals. The table below highlights key collaboration features:
| Feature | Description |
|---|---|
| Automated generation and distribution | Create and send reports automatically at scheduled times. |
| Report delivery | Send reports to specific email addresses or folders. |
| Sharing methods | Share reports via email, file-sharing platforms, or web portals for team access. |
FineReport by FanRuan enhances collaboration with features like scheduled tasks, permission management, and mobile access. You can distribute reports securely and keep your team informed, no matter where they are.

Tip: Use automated scheduling and shared datasets to keep everyone updated with the latest information.
![]()
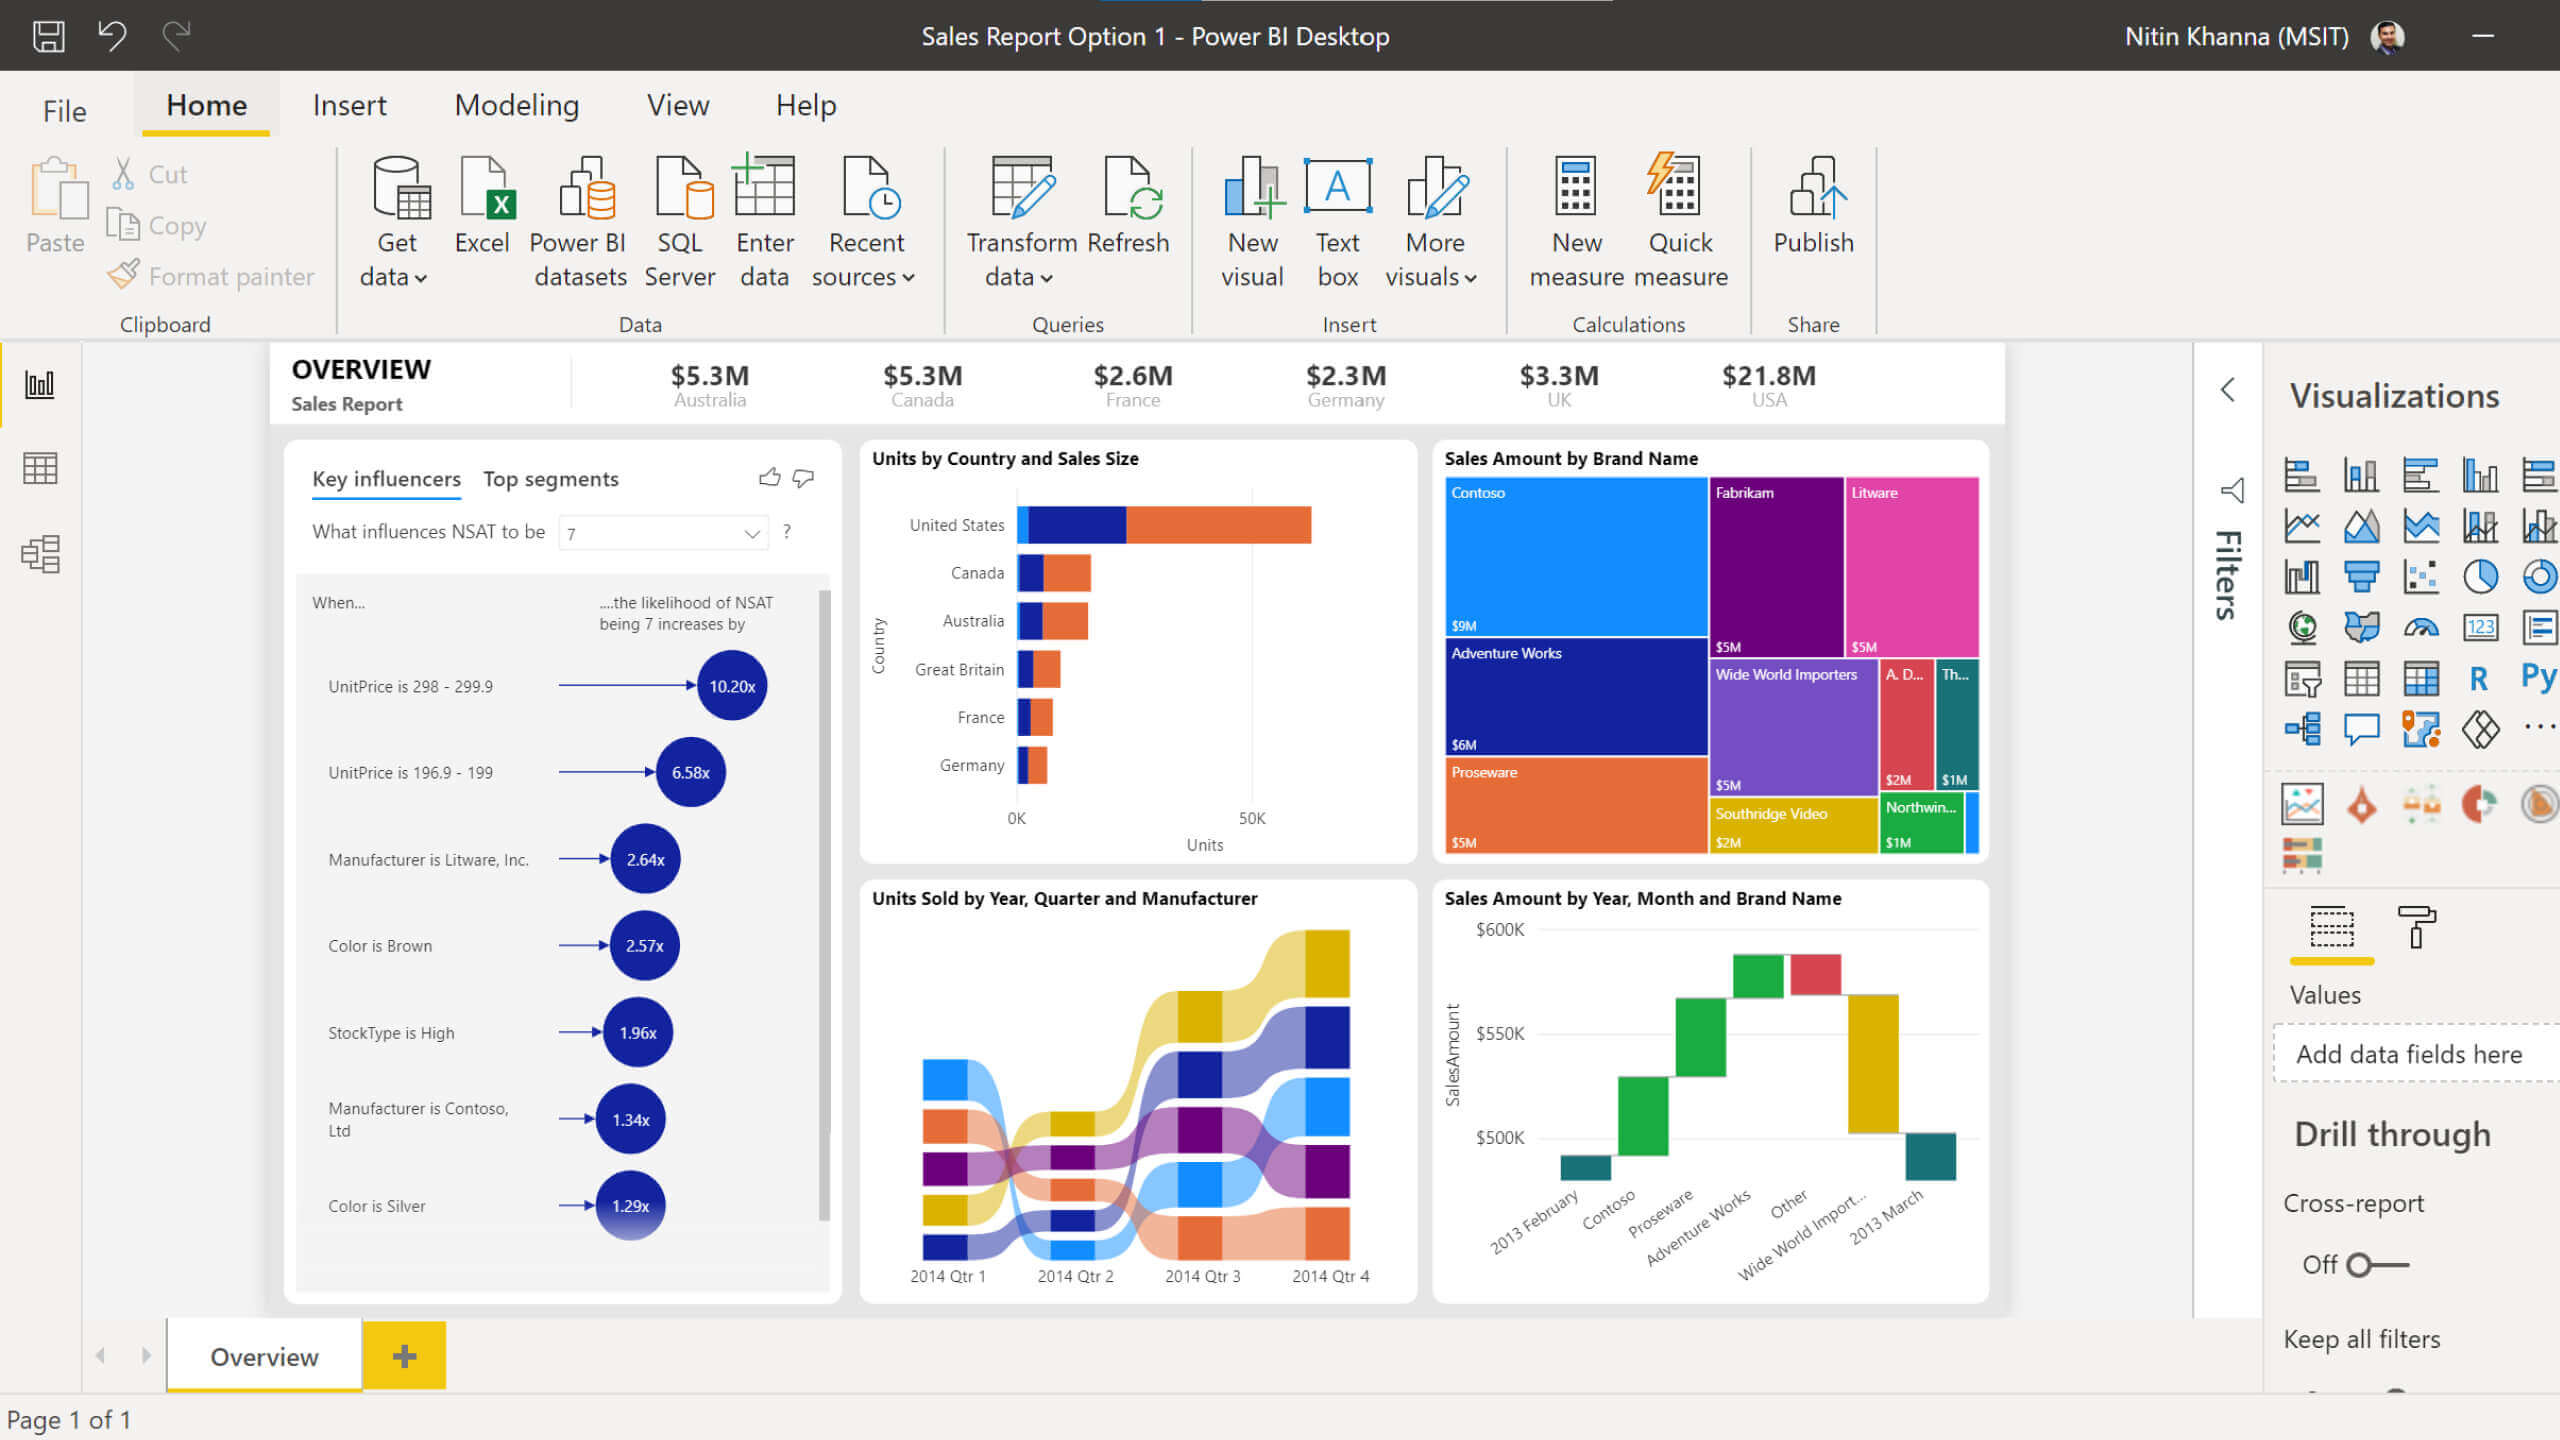
You may have heard about Power BI Report Builder if you work with business data. This tool lets you create paginated reports that look great when printed or saved as PDFs. Power BI Report Builder works as a web-based tool. You can connect to many data sources, such as Excel, SQL Server, and Oracle. The drag-and-drop interface makes it easy for you to build basic reports.
Power BI Report Builder focuses on paginated reports. These reports are perfect for printing or sharing as PDFs. You can use tables, matrices, and charts to show your data. The tool gives you basic visuals and some interactivity. However, it does not offer the advanced visuals or custom options you find in Power BI Desktop.
Here is a table to help you see the differences between Power BI Report Builder and Power BI Desktop:
| Aspect | Power BI Report Builder | Power BI Desktop |
|---|---|---|
| Type | Web-based tool | Windows-based application |
| Data Sources | Supports Excel, SQL Server, Oracle, and more | Advanced data modeling, table relationships, DAX formulas |
| Visuals and Interactivity | Basic visuals, limited interactivity | Broad visuals, custom visuals, advanced interactivity (drill-down, cross-filter) |
| Reporting Types | Paginated reports (print/PDF optimized) | Interactive dashboards, paginated reports, mobile reports |
| Ease of Use | User-friendly drag-and-drop | Requires advanced skills in modeling and calculations |
You use Power BI Report Builder when you need detailed, print-ready reports. If you want interactive dashboards or advanced visuals, you may choose Power BI Desktop.
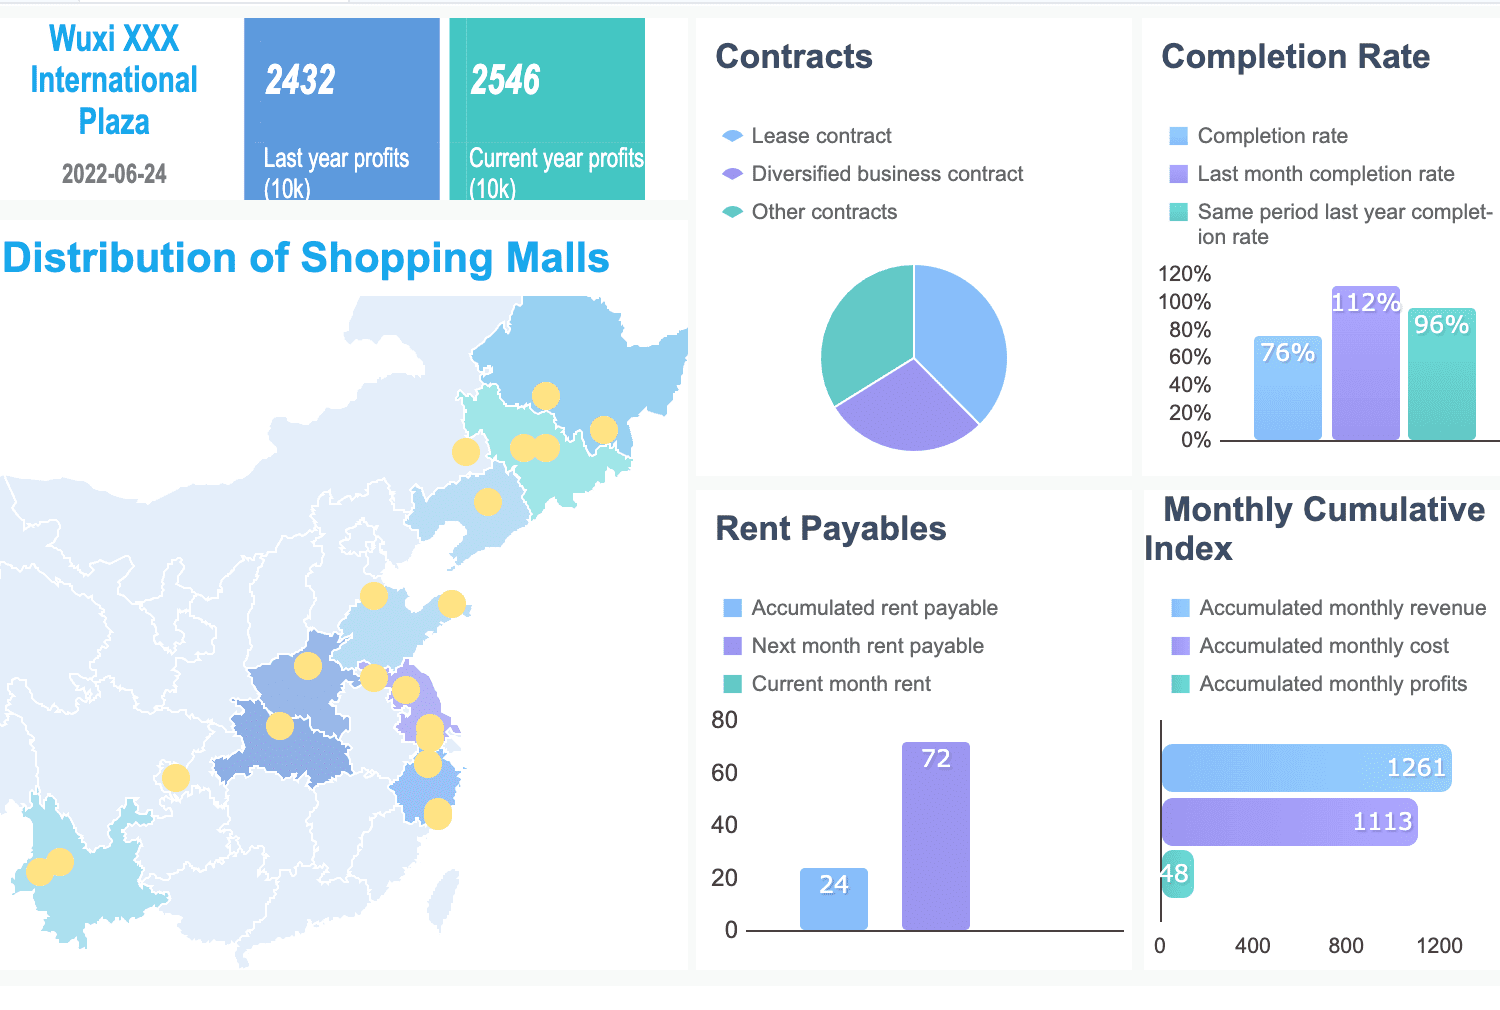
FineReport by FanRuan gives you a powerful way to create enterprise-level reports and dashboards. You can use its drag-and-drop designer to build pixel-perfect documents. FineReport connects to many data sources, including databases, files, and cloud services. You can create complex reports, interactive dashboards, and even 3D visualizations.
FineReport stands out because you can manage user permissions, automate report scheduling, and share reports on any device. You get strong integration with other business systems. FineReport supports real-time data updates, so your reports always show the latest information. You can use it for business reporting, data analysis, and decision-making across industries like manufacturing and finance.
Note: FineReport helps you centralize your data, streamline reporting, and support collaboration in your organization.
When you choose a reporting tool, you should think about your needs. If you want to create paginated, print-ready reports, Power BI Report Builder is a good choice. You can use it for simple business reports and share them as PDFs or Excel files. If you need interactive dashboards or advanced analytics, Power BI Desktop offers more features.
FineReport by FanRuan gives you a complete solution for enterprise reporting. You can connect to many data sources, design complex reports, and automate distribution. FineReport supports mobile access and real-time updates. You can use it to manage large data sets and support decision-making at every level.
You should look at your business goals, data sources, and reporting needs. Power BI Report Builder works well for paginated reports. FineReport gives you more flexibility and integration for enterprise use.
MS Report Builder gives you the power to create clear, paginated reports with ease. When you choose the right reporting tool, you set your business up for long-term success. The table below shows how the right tool can help you:
| Benefit | Description |
|---|---|
| Improved data accuracy | Clean data leads to better decisions. |
| Increased efficiency | Automation saves time and reduces errors. |
| Better decision-making | Visuals help you spot trends quickly. |
| Improved collaboration | Easy sharing boosts teamwork. |
For advanced analytics and flexible reporting, you can explore FineReport by FanRuan. This solution supports your growth and helps you make smarter choices.
Click the banner below to try FineReport for free and empower your enterprise to transform data into productivity!


The Author
Lewis
Senior Data Analyst at FanRuan
Related Articles

How to create an HTML report from scratch in 2026
Build an html report from scratch in 2026 with easy steps, tools, and tips for customization, sharing, and making your data clear and interactive.
Lewis Chou
Mar 23, 2026

What Are the Main Types of Financial Statements and Their Examples
See the main types of financial statements with examples: balance sheet, income statement, cash flow, and equity statement.
Lewis Chou
Mar 23, 2026

Top MySQL Reporting Tools for Teams in 2026
See the top MySQL reporting tools for teams in 2026. Compare features, pricing, and collaboration to choose the best solution for your business needs.
Lewis Chou
Mar 20, 2026


