For project managers and operations directors, reporting is the bridge between execution and strategy. Yet, for many teams, it remains a painful, manual process of assembling slides from disparate spreadsheets—a static snapshot delivered too late to influence outcomes. Modern project reporting must evolve from retrospective history books to proactive intelligence systems. This requires two layers: a trusted, visual dashboard foundation for real-time status, and an AI assistant layer that turns that data into timely insights, alerts, and recommended actions. With FineBI + Dora, teams can move from people hunting through dashboards to an AI digital employee that helps them ask, analyze, generate, push, alert, and follow up on project performance.
At its core, project reporting is the structured communication of a project's status, progress, and performance against its planned objectives. It transforms raw data on tasks, resources, timelines, and costs into a coherent narrative for stakeholders.
Defining Project Reports
A project report is a formal document or dashboard view that provides detail on the overall health of a project. It synthesizes data across dimensions—schedule, budget, scope, resources, risks, and quality—into an accessible format. In the era of Agentic BI, a "report" is no longer just a PDF; it's an interactive, chat-based analysis view generated from your governed data assets, capable of answering follow-up questions in real time.
The Role of Reports in Project Management
Reports serve as the central nervous system for project governance. For executives, they offer visibility for strategic steering. For project managers, they are essential for tracking, forecasting, and resource allocation. For team members, they clarify priorities and dependencies. Effective reporting closes the loop between planning and doing, ensuring accountability and enabling data-driven adjustments.
Common Types of Project Reports
While needs vary, several report types are fundamental:
Status/Progress Reports: High-frequency updates on task completion, milestones, and current workstreams.
Financial/Budget Reports: Tracking actual spend against budget, forecasting to completion (EAC), and highlighting variances.
Resource Utilization Reports: Showing team capacity, allocation, and potential bottlenecks or overallocation.
Risk & Issue Registers: Logging active risks, their probability/impact, and mitigation actions.
Portfolio Dashboards: Aggregating data across multiple projects for leadership to assess overall pipeline health and strategic alignment.
Why Actionable Insights Matter in Reporting
The ultimate goal of reporting is not to document the past, but to illuminate the path forward. Data becomes decision-making fuel only when it is timely, contextual, and points toward concrete action.
From Data to Decisions
A simple percentage-complete figure is data. An insight explains why a critical phase is behind schedule—for example, "Phase 2 is 15% behind plan due to a delayed vendor delivery (Task ID #204), impacting the critical path and risking a 5-day project slip." This insight, especially when pushed automatically to the procurement lead and project manager, turns a status update into an actionable trigger for intervention.
The Cost of Ineffective Reporting
Ineffective reporting manifests as manual data wrangling, stale information, and "analysis paralysis." The costs are tangible: missed early warning signs leading to budget overruns, missed deadlines due to unrecognized resource conflicts, and strategic misalignment as projects drift from original goals without timely correction. Teams spend more time assembling reports than acting on their findings.
5 Best Practices for Better Project Reports
This image shows a FineBI horizontal bar chart displaying sales volumes across three product categories.
Moving from cumbersome to compelling reporting requires a disciplined approach centered on clarity, consistency, and actionability.
1. Define Clear Objectives and Audience
Before building a single chart, ask: "Who is this for, and what decision do they need to make?" A weekly team sync report focuses on immediate task blocks. A monthly steering committee report highlights strategic ROI and milestone risks. Tailor content, depth, and terminology accordingly.
2. Standardize Templates and Tools
Ad-hoc reporting breeds confusion. Standardize on a core set of report templates built on a unified platform like FineBI. This ensures consistency, reduces rebuild time, and—crucially—creates a trusted semantic foundation of defined KPIs, filters, and business terms that an AI Data Agent like Dora can reliably query and interpret.
3. Focus on Key Metrics and Visuals
Avoid "dashboard sprawl." Identify the 5-10 truly vital metrics for each audience. Use clear visualizations: Gantt charts for timelines, burn-down charts for sprint progress, and variance bars for budget. In an AI-enhanced workflow, these visuals can be generated on-demand via chat, pulling from the governed FineBI assets.
4. Ensure Timely and Consistent Updates
The shelf life of a project report is short. Automate data pulls to ensure reports reflect the latest state. Establish a regular publishing rhythm (e.g., every Monday morning) so stakeholders know when to expect insights. With Dora, this can be escalated to scheduled, AI-generated briefings pushed before key meetings.
5. Foster a Culture of Review and Action
A report without a review process is merely documentation. Embed report reviews into regular project rhythms. Use them to trigger discussions on risks, celebrate milestones, and assign action items. The report should be the starting point for conversation, not the end product.
How to Create an Effective Project Report
A practical, three-step framework can guide the creation of any project report, whether built manually or assisted by AI.
Step 1: Gather and Validate Data
Pull data from all relevant sources: task management tools, financial systems, timesheets, and risk registers. The critical step is validation—ensuring data accuracy and consistency. This is where a governed BI layer (FineBI) is indispensable, acting as the single source of truth.
Step 2: Analyze Trends and Identify Issues
Don't just present numbers. Compare actuals to baselines. Look for trends: Is the burn rate accelerating? Is velocity declining? Identify outliers and root causes. This analytical heavy-lifting is prime for augmentation by a Dora Data Analyst digital employee, which can perform preliminary attribution analysis against historical patterns.
Step 3: Summarize Findings and Recommend Actions
Synthesize analysis into a clear executive summary. State the current status (Green/Yellow/Red), key achievements, top risks, and critical decisions needed. The most powerful reports conclude with specific, owner-assigned recommended actions. This transforms the report from an informational tool into a catalyst for progress.
How an AI Data Agent Handles This Scenario
Imagine moving beyond static dashboards to an interactive AI assistant that acts as a Report Researcher and Risk Alert Officer. This is the shift enabled by Dora, FanRuan's enterprise Data Agent platform, built on the trusted metric and semantic foundation of FineBI.
A project manager doesn't need to navigate to a dashboard. Instead, they ask in natural language:
“Dora, prepare a summary for the Q3 product launch steering meeting tomorrow. Focus on current status against the Phase 3 milestone, budget variance, and highlight any high-priority risks that need escalation.”
Retrieve & Understand:Dora accesses the governed FineBIproject portfolio dashboard. It understands the business definitions of "Phase 3," "Budget Variance," and "High-Priority Risk" from the semantic layer.
Analyze & Generate: It queries the latest data, analyzes trends against the baseline, and identifies that a key vendor task is flagged red.
Create Output:Dora generates a concise, chart-based summary for the meeting. It includes a milestone timeline showing the delay, a variance chart, and a focused risk table.
Detect & Alert: Simultaneously, because a threshold was breached (risk score > 80), Dora's Risk Alert Officer Skill triggers an automatic notification to the procurement owner with the specific task details and suggested mitigation action.
Push & Follow-up: The briefing is pushed to the project manager and meeting attendees 30 minutes before the meeting. After the meeting, Dora can be asked to update the risk register with new action items discussed.
This workflow exemplifies fourth-generation Agentic BI: natural-language request, trusted semantic layer, governed query execution, followed by answer, alert, and follow-up—all with higher stability and lower operational friction than manual processes or generic AI chatbots.
Elevating Reporting with Modern Approaches
The final evolution in project reporting integrates technology not just for automation, but for intelligent assistance, weaving insights directly into daily workflows.
Leveraging Technology for Efficiency
Modern BI platforms like FineBI automate data aggregation and visualization. The next step is layering on an AI assistant like Dora to automate the interpretation and distribution of those visualizations. This means moving from building every report manually to configuring digital employees for repeatable data work: daily stand-up briefings, weekly portfolio summaries, and real-time anomaly alerts.
Integrating Reporting into Team Workflows
The most impactful reports are those consumed within natural workflows. Integrate insights into collaboration tools (Teams, Slack) via Dora's push notifications. Embed live, interactive dashboard views in project wikis. The goal is to make the insight find the user, not the other way around. For IT teams, the role shifts from manually crafting every report to curating the data connections, semantic rules, and reusable AI Skills that empower business users with self-service, chat-based analytics.
Conclusion: From Status Updates to Strategic Value
Project reporting should be a strategic accelerator, not a retrospective tax. By adopting the best practices outlined—clarity, standardization, focus on metrics, timeliness, and a culture of action—teams establish a strong foundation. Building this manually, however, remains complex and resource-intensive.
This is where FineBI + Dora delivers a practical path forward. FineBI enables teams to build the trusted dashboard, metric, and semantic foundation. Dora acts as the AI assistant layer, turning those assets into a proactive Daily Briefing Secretary and Risk Alert Officer. It answers questions in chat, generates dashboard-style analysis views, pushes scheduled summaries, monitors anomalies, and can follow up with responsible owners.
Get Ready-to-Use Dashboard Templates in Fine Gallery
The result is more than a BI upgrade; it's an operational evolution. Teams shift from manually compiling history to being guided by an AI digital employee that ensures the right insights reach the right people at the right time, transforming project reporting from a chore into a core competitive advantage.
The main purpose is to transform raw project data into a coherent narrative for stakeholders, providing visibility into status, progress, and performance against objectives to enable strategic steering and data-driven decisions.
Common types include status or progress reports, financial or budget reports, resource utilization reports, risk and issue registers, and portfolio dashboards that aggregate data across multiple projects.
Focus on providing timely, contextual insights that explain the 'why' behind the data and point toward concrete interventions. Standardize templates and automate data updates to ensure reports are current and can trigger immediate review and action.
Key practices include defining clear objectives for your audience, standardizing templates and tools, focusing on a vital few key metrics and visuals, ensuring timely and consistent updates, and fostering a culture where reports are reviewed and acted upon.
Data is a raw figure, like a percentage complete. An insight adds context and explanation, such as identifying that a delay is due to a specific vendor task impacting the critical path, which turns a status update into a trigger for management action.
Product Trial
FineReport
Pixel-perfect reports · Interactive dashboards · Easy data entry · Digital twins


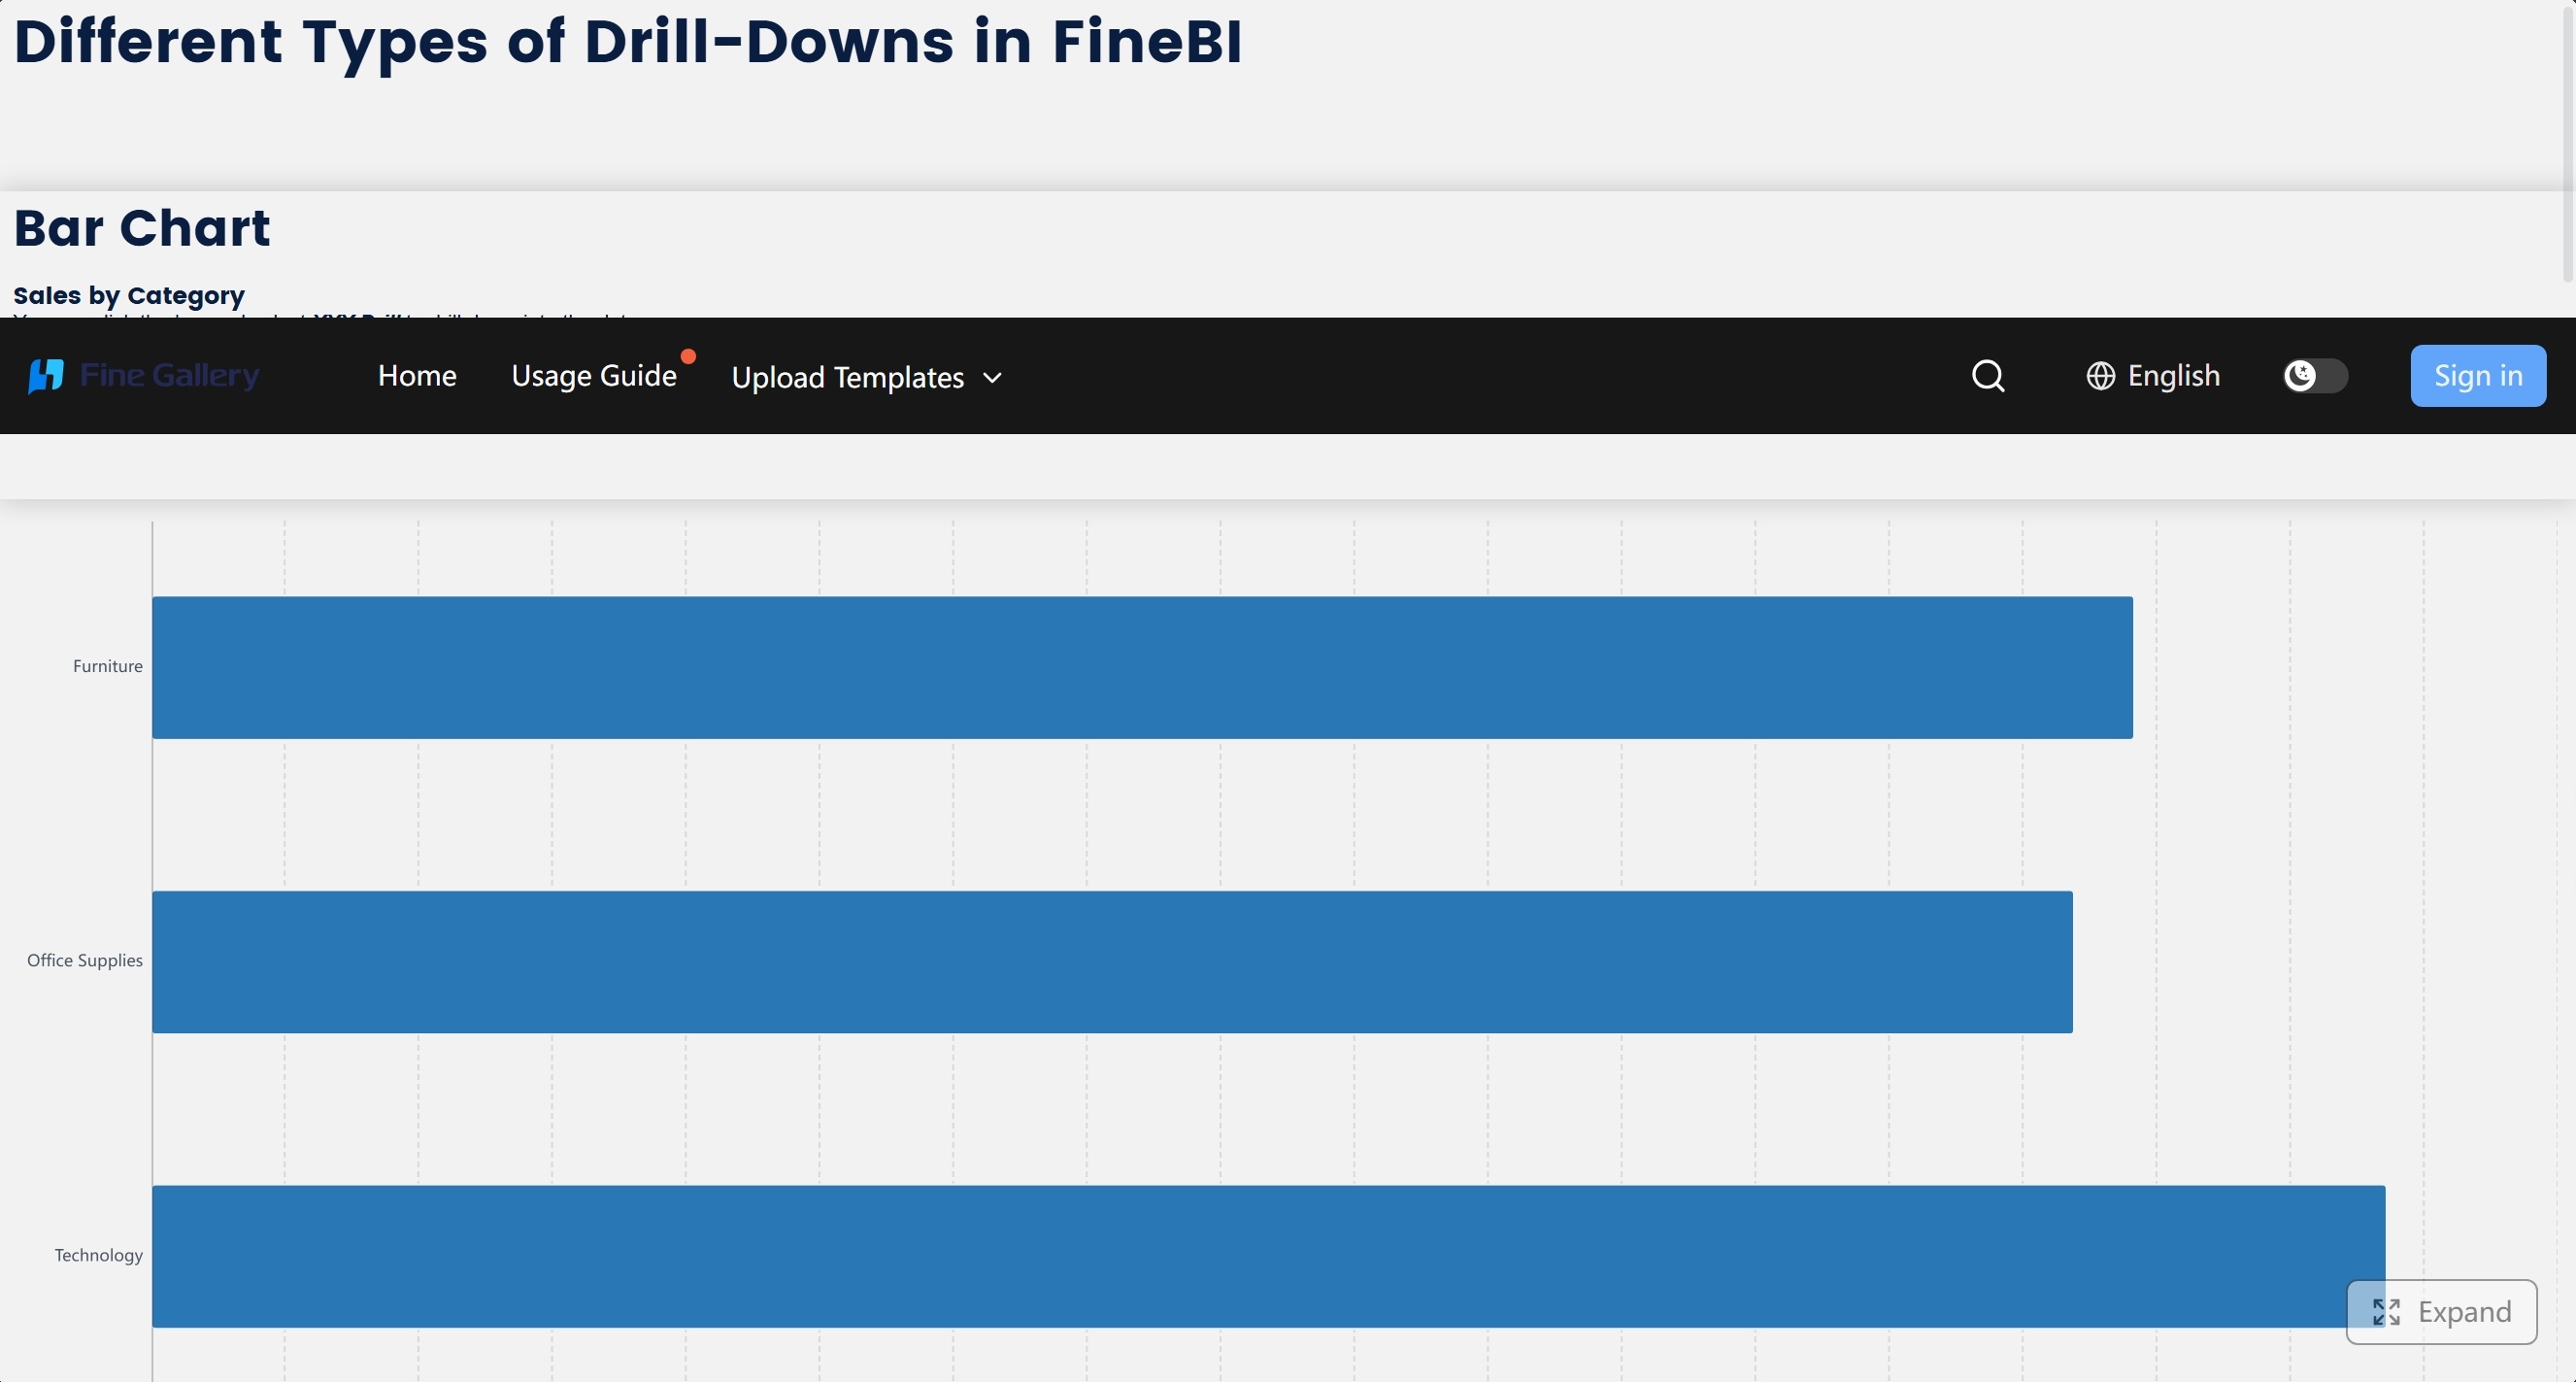 This image shows a FineBI horizontal bar chart displaying sales volumes across three product categories.
 Imagine moving beyond static dashboards to an interactive AI assistant that acts as a Report Researcher and Risk Alert Officer. This is the shift enabled by