In today’s dynamic marketplace, reporting analytics have become indispensable tools for businesses. These analytical tools help you navigate uncertainties and adapt to market changes. By understanding customer preferences and optimizing operations, you can maintain a competitive edge. Visual analytics, in particular, offer transformative benefits. They enhance performance metrics and bring clarity to decision-making, empowering you to innovate and stay ahead of competitors. Tools like FineReport simplify reporting analytics, enabling you to unlock actionable insights and drive success. Are you curious about the up-and-coming star FineReport? Click the button here and try FineReport for free.
Understanding Reporting Analytics in Business
What Is Reporting? Transforming Data into Actionable Summaries
Reporting involves converting raw data into structured, meaningful summaries that guide decision-making. It focuses on presenting historical data in a clear and concise format, often through business reports, dashboards, or through specialized approaches such as project management reporting, which caters specifically to tracking project progress. For example, monthly sales reports provide insights into revenue trends, helping you identify areas for improvement. Tools like FineReport simplify this process by automating report generation and integrating data from multiple sources.
The importance of reporting is evident in its ability to streamline business operations. By organizing data into actionable summaries, you can monitor performance metrics, track progress, and allocate resources effectively. This ensures that your business remains agile and responsive to market demands.
What Is Analytics? Extracting Insights from Data
Analytics goes beyond reporting by uncovering patterns, trends, and correlations within data. It transforms raw information into actionable insights using robust analytics reporting tools, enabling you to make informed decisions. For instance, predictive analytics can forecast customer behavior, helping you tailor marketing strategies to boost engagement.
Key components of analytics include:
- Data Visualization: Simplifies complex datasets, making trends easier to identify.
- Statistical Analysis: Provides a deeper understanding of data patterns.
- Machine Learning: Predicts outcomes by analyzing historical data.
In an e-commerce context, analytics can predict future buying patterns by analyzing past transactions. This empowers you to optimize inventory and enhance customer satisfaction.
The Role of Reporting Analytics in Driving Business Success
Combining reporting and analytics creates a powerful tool for achieving business success. Reporting provides a snapshot of past performance, while analytics offers insights into future opportunities. Together, they enable you to make data-driven decisions that drive growth.
The growing importance of reporting analytics is reflected in market trends:
Consider these statistics:
- The business analytics market is projected to reach $177 billion by 2030, growing at a CAGR of 11.2%.
- In 2023, 91.9% of organizations reported measurable value from data and analytics investments.
These figures highlight how reporting analytics can transform your business. By leveraging these tools, you can enhance decision-making, improve efficiency, and gain a competitive edge.
Key Benefits of Reporting Analytics for Business Success
Enhancing Decision-Making with Data Analytics
Data analytics empowers you to make informed decisions by uncovering patterns and trends that might otherwise go unnoticed. By analyzing historical and real-time data, you can predict future outcomes and align your strategies accordingly. For instance, companies like Amazon and Netflix use data analytics to enhance customer experiences. Amazon’s recommendation engine suggests products based on browsing and purchase history, driving sales and improving customer satisfaction. Similarly, Netflix analyzes viewer preferences to produce shows that resonate with its audience.
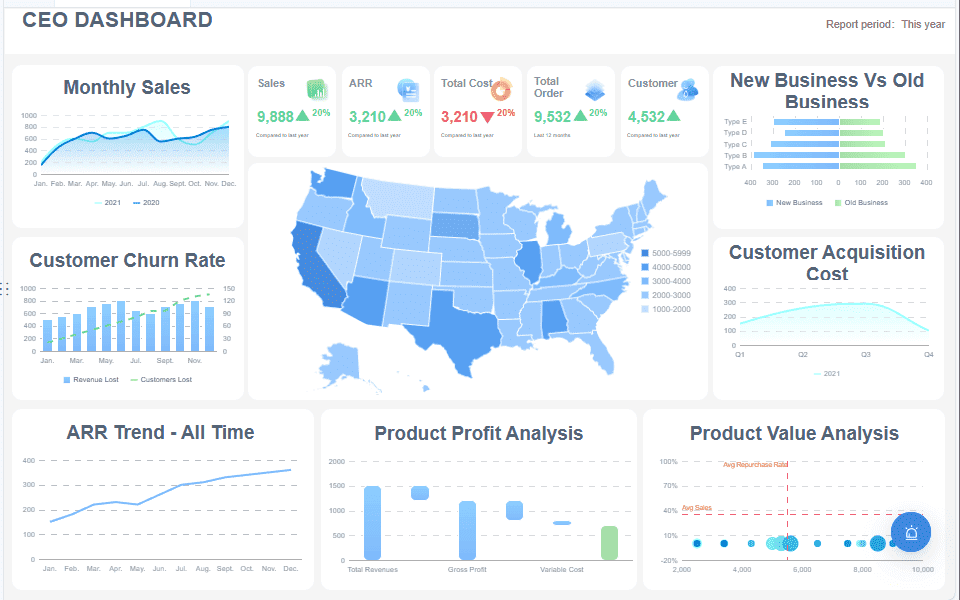
With reporting analytics, you can also identify areas of improvement and allocate resources more effectively. This approach ensures that your business remains agile and responsive to market demands. Data analysis helps you anticipate customer behavior, optimize inventory, and refine marketing strategies. These actionable insights enable you to stay ahead in a competitive marketplace. Here is the dynamic data analysis page created by FineReport.

Tip: Use tools like FineReport to simplify data analysis and generate actionable insights. This will help you transform raw data into meaningful business reports that guide your decision-making process.
Boosting Operational Efficiency and Reducing Costs
Reporting analytics play a crucial role in streamlining operations and minimizing costs. By analyzing data from various business functions, you can identify inefficiencies and implement solutions to address them. Companies like Domino’s Pizza and Siemens have successfully leveraged analytics to improve their operations. Domino’s uses analytics for supply chain management, reducing waste and increasing profitability. Siemens employs predictive maintenance strategies, which lower energy costs and enhance sustainability.
Incorporating reporting analytics into your operations allows you to monitor performance metrics in real time. This enables you to make quick adjustments and avoid potential bottlenecks. For example, predictive analytics can help you forecast demand, ensuring optimal inventory levels and reducing excess stock. Additionally, tools like FineReport automate business reporting, saving time and reducing errors.

Note: Automating routine tasks with reporting tools not only boosts efficiency but also frees up resources for strategic initiatives.
Gaining a Competitive Edge Through Data-Driven Strategies
In today’s data-driven world, leveraging insights from reporting analytics gives you a significant competitive advantage. By analyzing large datasets, you can uncover trends and opportunities that drive innovation. In the life sciences sector, for example, 33% of firms invest in data-driven technologies to enhance efficiency and innovation. This investment helps organizations transform data into actionable insights, supporting strategic decision-making and anticipating market trends.
Data-driven strategies also enable you to personalize customer experiences, which strengthens brand loyalty. Businesses that use analytics to understand customer preferences can tailor their offerings to meet specific needs. This approach not only improves customer satisfaction but also increases revenues. By staying informed about market dynamics, you can position your business for long-term success.
Tip: Stay ahead of competitors by integrating tools like FineReport into your analytics strategy. These tools provide real-time insights that help you adapt to changing market conditions.

Identifying Growth Opportunities with Reporting Analytics
Identifying growth opportunities is essential for any business aiming to thrive in a competitive market. Reporting analytics equips you with the tools to uncover these opportunities by analyzing patterns, trends, and performance metrics. By leveraging data, you can pinpoint areas where your business can expand, innovate, or optimize operations.
One way reporting analytics helps is by providing a clear view of your organization’s internal metrics. For example, examining hiring velocity can reveal how efficiently your company attracts talent compared to industry standards. A median hiring velocity of 30 days for technical roles, compared to an industry median of 45 days, indicates a competitive advantage. Similarly, analyzing the R&D-to-total-headcount ratio can highlight your investment in innovation. A high ratio, such as 25% or more, often correlates with future revenue growth in tech firms. These insights allow you to allocate resources effectively and prioritize initiatives that drive growth.
| Metric Type | Example Insight |
|---|---|
| Hiring Velocity | Median hiring velocity of 30 days for technical roles vs. industry median of 45 days indicates a competitive advantage. |
| R&D-to-Total-Headcount Ratio | A high R&D ratio (>25%) in a tech firm correlates with future revenue growth based on historical data. |
| Support-to-Core Ratio | A low support-to-core ratio suggests a lean operational model, while a high ratio indicates potential inefficiencies. |
| R&D Headcount Percentage | Comparing R&D headcount as a percentage of total employees against industry standards reveals under-investment in innovation. |
Beyond internal metrics, reporting analytics enables you to identify external growth opportunities. By analyzing market trends and customer behavior, you can uncover untapped markets or emerging demands. For instance, business analytics can help you understand shifts in consumer preferences, allowing you to tailor your offerings accordingly. This proactive approach ensures your business remains relevant and competitive.
Business reporting also plays a critical role in identifying inefficiencies that hinder growth. For example, a high support-to-core ratio might indicate operational inefficiencies, while a low ratio suggests a leaner model. By addressing these inefficiencies, you can streamline operations and reinvest savings into growth initiatives.
To maximize the potential of reporting analytics, you need tools that simplify data analysis and visualization. FineReport, for instance, allows you to create dynamic business reports that highlight key growth indicators. These reports provide actionable insights, enabling you to make informed decisions and seize opportunities as they arise.
Tip: Regularly review your business reports to track progress and identify new growth opportunities. This practice ensures you stay ahead of market trends and maintain a competitive edge.
Applications of Reporting Analytics Across Business Functions
Marketing: Leveraging Data Analytics for Customer Insights
Data analytics has revolutionized marketing by providing actionable insights into customer behavior. By analyzing customer preferences, purchase history, and engagement patterns, you can create personalized marketing strategies that resonate with your audience. For instance, customer surveys offer valuable data to understand experiences and expectations. When you analyze responses at scale, such as 200 survey results, you gain accurate insights that enhance your marketing efforts.
| Evidence | Explanation |
|---|---|
| Customer surveys provide a good starting point for understanding customer experience. | This indicates that data analytics can be effectively leveraged to gain insights into customer behavior, which is crucial for marketing strategies. |
| Analyzing customer responses at scale (200 responses) provides fairly good survey accuracy. | This statistic supports the idea that sufficient data collection leads to better insights, enhancing marketing effectiveness. |
| Implementing data from customer surveys can improve digital marketing strategies. | This directly links the use of data analytics to tangible benefits in marketing efforts. |
By leveraging reporting analytics, you can also track the performance of marketing campaigns in real time. This allows you to identify what works and what doesn’t, enabling you to allocate resources effectively. Tools like FineReport simplify this process by offering dynamic business reports and data visualization, helping you monitor key metrics such as conversion rates and customer acquisition costs.
Tip: Use reporting analytics to segment your audience based on demographics, behavior, or preferences. This ensures your marketing messages reach the right people at the right time.
Finance: Optimizing Budgets and Managing Risks
In finance, reporting analytics plays a critical role in optimizing budgets and managing risks. By analyzing financial data, you can identify market opportunities, predict cash flow trends, and monitor key performance indicators (KPIs). Advanced analytics tools, such as machine learning and business intelligence software, reveal insights from complex datasets, enabling you to make informed financial decisions.
- Financial analytics helps optimize business operations and identify market opportunities and risks.
- It improves an organization's financial and business strategy.
- Leveraging big data technology allows professionals to enhance decision-making and operational performance.
Financial Performance Management (FPM) further enhances your ability to assess financial health. By using reporting, planning, and analytics, you can monitor budgets, forecasts, and trends. For example, predictive analytics can forecast future financial performance, allowing you to adjust strategies proactively. This approach supports operational changes based on financial insights, ensuring your business remains resilient in a dynamic market.
Note: Tools like FineReport streamline financial reporting by automating the generation of business reports. This saves time and reduces errors, enabling you to focus on strategic initiatives.
Operations: Streamlining Processes with Reporting Analytics
Reporting analytics enhances operational efficiency by identifying gaps and opportunities for improvement. Organizations that adopt data-driven decision-making report a 20-30% increase in productivity. By monitoring quality metrics through statistical process control, you can reduce defects by up to 40%, leading to higher customer satisfaction.
- Reporting tools can reduce or eliminate manual repetitive tasks.
- Automation improves accuracy and speeds up report generation.
- Predictive analytics allows businesses to anticipate future trends and demands.
For example, predictive analytics helps you forecast demand, ensuring optimal inventory levels and minimizing waste. Tools like FineReport automate routine tasks, such as report generation and data analysis, freeing up resources for more strategic activities. This not only improves accuracy but also accelerates decision-making.
Tip: Regularly review operational metrics using reporting analytics to identify inefficiencies and implement corrective actions. This ensures your processes remain streamlined and cost-effective.
Sales: Tracking Performance and Identifying Opportunities
Sales performance tracking is essential for identifying opportunities and driving growth. By leveraging reporting and analytics, you can monitor key metrics, uncover inefficiencies, and refine your strategies. This approach ensures that your sales team remains focused on achieving targets and adapting to market demands.
Key Metrics for Sales Performance Tracking
Tracking the right metrics provides valuable insights into your sales process. These metrics help you evaluate your team’s efficiency and identify areas for improvement. Consider the following:
- Sales by New vs. Existing Customers: This metric highlights business growth and customer loyalty. A higher percentage of sales from new customers indicates successful acquisition strategies, while consistent sales from existing customers reflect strong retention efforts.
- Deal Loss Reasons: Analyzing why deals are lost reveals weaknesses in your sales process. For example, frequent losses due to pricing objections may indicate the need for better value communication.
- Lead-to-Opportunity Conversion Rate: This metric measures how effectively your team qualifies leads and engages prospects. A low conversion rate suggests the need for improved lead nurturing strategies.
Tip: Regularly review these metrics to ensure your sales strategies align with your business goals. Tools like FineReport can simplify this process by automating business reporting and providing real-time insights.
Tools for Effective Sales Tracking
Modern tools enhance your ability to track sales performance and identify opportunities. They streamline processes and provide actionable insights. Here’s how specific features can help:
| CRM Feature | How It Helps Sales Tracking |
|---|---|
| Automated Reporting | Automatically generates reports at specified intervals, saving time and providing real-time insights. |
| Lead Scoring | Assigns scores to leads based on their engagement, helping you prioritize high-value prospects. |
| Pipeline Visibility | Offers a clear view of where each deal stands, so your team can focus on moving them forward. |
| Activity Tracking | Monitors activities like calls and emails, ensuring nothing falls through the cracks. |
| Performance Dashboards | Provides a snapshot of sales performance, making it easier to track progress and adjust strategies. |
These tools not only improve efficiency but also empower your team to focus on high-impact activities. For instance, automated reporting eliminates manual tasks, allowing your team to dedicate more time to closing deals.
Identifying Opportunities with Sales Analytics
Sales analytics enables you to uncover hidden opportunities within your data. By analyzing trends and patterns, you can make informed decisions that drive growth. Key areas to explore include:
- Lead Conversion Rate: A high conversion rate indicates effective lead qualification and engagement.
- Average Deal Size: Monitoring this metric helps you identify opportunities to upsell or cross-sell.
- Sales Cycle Length: Shorter cycles suggest streamlined processes, while longer cycles may highlight bottlenecks.
- Customer Retention Rate: High retention rates reflect strong relationships and customer satisfaction.
For example, analyzing customer retention rates can reveal opportunities to enhance loyalty programs. Similarly, understanding deal loss reasons can guide you in refining your sales pitch or pricing strategy.
Note: Use business analytics tools to visualize these metrics and gain deeper insights. FineReport’s dynamic business reports make it easier to track performance and identify growth opportunities.
By integrating reporting and analytics into your sales strategy, you can optimize performance and stay ahead of competitors. These tools provide the clarity needed to make data-driven decisions, ensuring your business remains agile and responsive to market changes. Do you want to have a try now? Just a click and you can start your reporting and analytics trip.
Types of Reporting Analytics and Their Use Cases
Descriptive Analytics: Understanding Past Performance
Descriptive analytics focuses on summarizing historical data to identify patterns and trends. It answers the question, "What happened?" and provides insights that guide future decisions. For example, a clothing store might analyze past sales metrics to discover that jackets sell well during the fall. This insight enables targeted marketing strategies, boosting sales and performance.
| Aspect | Description |
|---|---|
| Purpose | Summarizes historical data to identify patterns, trends, and insights. |
| Key Question | Answers 'What happened?' by analyzing past data. |
| Applications | Used in supply chain management, marketing, customer segmentation, operational efficiency, etc. |
| Comparison | Retrospective focus, unlike predictive or prescriptive analytics. |
Companies using descriptive analytics gain a competitive advantage, especially in uncertain economic environments. By understanding past performance, you can identify risks and optimize operations effectively.
Predictive Analytics: Forecasting Future Trends
Predictive analytics uses historical data to forecast future outcomes. It helps you anticipate trends and make proactive decisions. For instance, accurate forecasting enables efficient resource allocation, ensuring financial stability and maximizing profitability.
| Aspect of Forecast Accuracy | Description |
|---|---|
| Critical Financial Decisions | Accurate forecasts enable efficient resource allocation, maximizing profitability and maintaining financial stability. |
| Impact on Returns on Investment | Inaccurate forecasts can lead to poor investment decisions, affecting ROI and future projections. |
| Mitigating Financial Risk | Accurate forecasting helps anticipate market trends and formulate risk management strategies, ensuring liquidity and preventing insolvency. |
| Promoting Long-Term Growth | Provides insights for strategic decisions regarding expansion, new markets, and product launches. |
Predictive analytics empowers businesses to stay ahead of market changes. By leveraging these insights, you can align strategies with future demands, ensuring sustained growth.
Prescriptive Analytics: Recommending Optimal Actions
Prescriptive analytics goes a step further by recommending the best course of action based on data. It combines historical and predictive insights to answer, "What should we do?" For example, Genentech optimized bioreactor operations using prescriptive analytics, achieving a 25% increase in product titer and saving $50 million annually.
- Genentech improved efficiency and reduced costs through optimized operations.
- Recursion Pharmaceuticals compressed drug discovery timelines from years to months by applying prescriptive algorithms.
- GSK reduced clinical trial enrollment periods by 20% and improved patient stratification accuracy by 30%.
Prescriptive analytics enhances decision-making by providing actionable recommendations. It ensures that your business remains agile and competitive in a dynamic market.
Real-Time Reporting: Making Instant Decisions with Live Data
Real-time reporting empowers you to make instant decisions by providing live data insights. This capability is crucial in today’s fast-paced business environment, where timely actions can determine success. By accessing up-to-the-minute information, you can respond to changes, optimize operations, and seize opportunities as they arise.
Organizations that integrate real-time insights into their workflows experience significant benefits. For example, a retail giant dynamically adjusted pricing and inventory during a promotional event, leading to improved sales. Similarly, hospitals using real-time monitoring systems reduced wait times and enhanced patient care. These examples highlight how live data transforms decision-making across industries.
| Evidence Type | Description | Impact |
|---|---|---|
| McKinsey Study | Organizations integrating real-time data | Up to 20% increase in operational efficiency |
| Data Warehouse Institute | Retail company using real-time insights | 30% reduction in excess stock |
| Dresner Advisory Services | Organizations using real-time analytics | 77% reported better financial performance |
| Major Airline Case | Implemented real-time data analysis | 25% reduction in delays, increased customer loyalty |
| Deloitte Study | Organizations using live data insights | 30% improvement in decision-making speed |
| Gartner Report | Businesses using advanced analytics | 60% increase in operational efficiency |
| Hospital Case | Real-time patient monitoring systems | 40% increase in patient satisfaction |
Real-time reporting also enhances operational efficiency. By analyzing live data, you can identify bottlenecks and implement solutions immediately. For instance, major airlines reduced delays by 25% through real-time data analysis, improving customer loyalty. Retailers using real-time insights reported a 30% reduction in excess stock, showcasing the value of dynamic inventory management.
The ability to act on real-time insights also accelerates decision-making. Deloitte found that organizations using live data improved decision-making speed by 30%. This advantage allows you to adapt quickly to market changes, ensuring your business remains competitive. Tools like FineReport simplify real-time reporting by automating data collection and visualization, enabling you to focus on strategic actions.

Tip: Use real-time reporting to monitor key metrics and adjust strategies instantly. This ensures your business stays agile and responsive to evolving conditions.
Overcoming Challenges in Implementing Reporting Analytics
Addressing Data Silos and Ensuring Integration with FineDataLink
Data silos often hinder your ability to gain a unified view of your business. These silos occur when departments store data in isolated systems, making it difficult to access and integrate information. FineDataLink offers a solution by consolidating data from various sources into a single platform. This integration standardizes data formats, ensuring consistency and accessibility.
- Integration tools like FineDataLink consolidate siloed systems, enabling seamless data sharing.
- Standardized data formats simplify analysis and improve collaboration across departments.
- Cross-department collaboration fosters consistent data practices, reducing silos.
By addressing data silos, you can streamline reporting workflows and improve decision-making. FineDataLink’s real-time synchronization ensures that your data remains up-to-date, enabling accurate and timely reporting. This approach enhances operational efficiency and supports a holistic view of your organization.
Building a Data-Driven Culture with FineReport
Creating a data-driven culture requires tools that make data accessible and actionable. FineReport empowers you to build this culture by providing centralized dashboards that display critical business information. These dashboards allow you to identify trends and patterns, enabling informed decision-making.
- Dashboards provide quick access to essential information, fostering a data-driven mindset.
- Centralized platforms ensure stakeholders can make timely decisions based on accurate data.
- Consistent use of dashboards promotes collaboration and strategic planning.
FineReport simplifies reporting by automating data visualization and analysis. This automation reduces manual effort, allowing you to focus on strategic initiatives. By integrating FineReport into your operations, you can enhance collaboration and drive a culture of data-informed decision-making.

Ensuring Data Quality and Governance for Reliable Insights
Reliable insights depend on the quality of your data. Ensuring accuracy, consistency, and completeness is essential for effective reporting and analytics. Data governance frameworks help you manage data quality and align it with your business objectives. These frameworks identify and correct errors, transforming raw data into valuable insights.
Data reliability influences every aspect of your organization’s decision-making process. Accurate and consistent data ensures that your reports reflect the true state of your operations. By implementing robust governance practices, you can maintain data integrity and support sound decision-making.
FineDataLink and FineReport enhance data quality by automating processes and providing tools for validation. These solutions ensure that your data remains accurate and actionable, enabling you to make informed decisions that drive success.
Reporting and analytics are essential for thriving in today’s data-driven world. They provide clarity, enabling you to make informed decisions and improve efficiency. Tools like FineReport and FineDataLink simplify these processes, helping you stay competitive.
| Metric | Importance |
|---|---|
| Customer Acquisition Cost | Helps balance spending and revenue generation, leading to sustainable growth. |
| Return on Investment (ROI) | Assesses the effectiveness of investments, guiding budget allocation. |
| Sales Growth | Indicates overall business performance and market competitiveness. |
By addressing challenges and leveraging the right solutions, you can unlock the full potential of reporting and analytics, driving long-term success.
Now Click the banner below to try FineReport for free and empower your enterprise to transform data into productivity!
Continue Reading about Reporting Analytics
What is Enterprise Analytic and Why is it important
What is Retail Analytics Software and Why is it important
How to Craft an Effective Analytics Dashboard
15 Best Software Reporting Tools for 2025


FAQ

The Author
Lewis
Senior Data Analyst at FanRuan
Related Articles

What Is Business Management? A Real-World Guide to Strategy, Operations, Finance, and People
$1 is the discipline of turning goals into results. It connects strategy with execution, money with decisions, and people with performance. Whether a company has 5 employees or 50,000, strong management is what keeps pri
Lewis Chou
Jun 24, 2026

What Recruiters Look for in a Data Analysis Portfolio: 10 Criteria to Score Yours Fast
A $1 is not judged like a school assignment. It is judged like a hiring shortcut. Recruiters, hiring managers, and analytics leads use it to answer one question fast: Can this person solve business problems with data in
Lewis Chou
May 29, 2026

What Is Data Analytics Consulting? Beginner’s Guide to Services, Deliverables, and Business Value
$1 helps organizations turn raw data into decisions they can trust. For many business leaders, the challenge is not a lack of data. It is a lack of clarity. Reports conflict, teams track different KPIs, dashboards are un
Lewis Chou
Jun 03, 2026