Retail industry data analysis involves examining vast amounts of retail data to uncover patterns, trends, and actionable insights. It plays a crucial role in modern retail by helping you understand customer preferences, predict market trends, and optimize operations. Big Data Analytics enables you to integrate data from multiple sources, offering a clearer picture of consumer behavior. This allows you to customize shopping experiences and streamline processes, boosting operational efficiency.
Despite its potential, only 20% of retailers fully utilize data analytics. Challenges like data silos and poor data quality often hinder progress. Tools like FineBI and FineDataLink can help overcome these barriers by centralizing data and enabling real-time analysis. With these solutions, you can create personalized marketing campaigns, optimize inventory, and enhance customer satisfaction, making retail industry data analysis a game-changer for your business.
Key Takeaways on Retail Industry Data Analysis
Retail data analysis helps stores understand customer preferences and improve decisions. Tools like FineBI and FineDataLink speed up the process of making smarter choices.
Effective data use creates better ads, optimizes stock management, and sets smart prices. Predictive tools and KPIs help keep store operations efficient and on target.
Training staff in data skills and using AI technology enhances customer service and store performance. This leads to more informed decisions and better service overall.
Understanding Retail Industry Data Analysis
What is Retail Industry Data Analysis?
Retail industry data analysis involves examining data from various sources to uncover insights that drive better business decisions. It helps you understand customer behavior, optimize operations, and improve profitability. By analyzing sales trends, customer preferences, and inventory levels, you can make informed choices that align with your business goals. For example, tools like FineBI allow you to visualize data trends and identify patterns in customer purchases, making it easier to tailor your strategies.
The primary goals of retail industry data analysis include:
Improving decision-making
Understanding customer behavior
Optimizing inventory and supply chain management
Enhancing pricing strategies
Increasing overall profitability
Additionally, it helps you reduce stockouts, minimize the need for discounts, and improve personalization. This ensures you capture more demand and make better pricing decisions. With solutions like FineDataLink, you can integrate data from multiple systems, enabling a seamless analysis process.
Key Components of Retail Data Analysis
Retail data analysis relies on several key components to deliver actionable insights. These include:
Business Intelligence (BI):BI tools like FineBI empower you to explore data independently. They provide real-time dashboards and visualizations, helping you track key performance indicators (KPIs) and identify trends.
Sales Forecasting: Predicting future sales based on historical data allows you to plan effectively. FineReport simplifies this process by generating detailed reports that highlight sales patterns.
Demand Forecasting: Understanding demand trends ensures you stock the right products at the right time. FineDataLink supports this by integrating data from various sources, enabling accurate forecasting.
These components work together to provide a comprehensive view of your business. For instance, combining BI with demand forecasting helps you align inventory levels with customer needs, reducing waste and improving efficiency.
How Retail Data Analysis Differs from General Data Analysis
Retail data analysis focuses specifically on the unique challenges and opportunities within the retail sector. Unlike general data analysis, which applies to a broad range of industries, retail analysis emphasizes customer behavior, sales trends, and inventory management. It answers questions like:
What is the value and number of products sold in an average order?
Which products sell the most and least?
Who are your most valuable customers?
What is the true demand, and where have you lost sales in the past?
What are the optimal suggested order quantities?
Retail-specific tools like FineBI and FineReport cater to these needs by offering tailored solutions. FineBI provides self-service analytics, enabling you to explore customer data and identify trends. FineReport excels in creating pixel-perfect reports that detail sales performance and inventory levels. Together, these tools help you address the complexities of retail data analysis, ensuring you stay ahead in a competitive market.
The Importance of Retail Industry Data Analysis
Enhancing Decision-Making with Data
Retail industry data analysis empowers you to make informed decisions based on actual data rather than relying on intuition. By analyzing customer behavior, sales trends, and inventory levels, you gain a deeper understanding of your business. For instance, tools like FineBI allow you to visualize key performance indicators (KPIs) and identify patterns in customer purchases. This helps you recognize your most valuable customers and determine which products perform best.
Tip: Data-driven decisions often lead to better outcomes. For example, using analytics to optimize pricing strategies can improve profitability and customer satisfaction.
Retail analytics also supports strategic planning. It enables you to forecast demand, set optimal pricing, and manage inventory effectively. FineDataLink simplifies this process by integrating data from multiple sources, ensuring seamless analysis. With these insights, you can align your operations with market trends and customer needs, reducing risks and maximizing opportunities.
Improving Customer Experience and Personalization
Retail industry data analysis plays a crucial role in enhancing customer experience. By leveraging customer data, you can create personalized shopping experiences that resonate with individual preferences. For example, Starbucks uses data from its app and loyalty program to deliver tailored offers to its customers. Similarly, Sephora analyzes customer preferences to provide a customized shopping journey both online and in-store.
Dynamic pricing models also improve customer satisfaction. Macy's, for instance, increased online sales by adjusting prices in real time based on demand and user behavior. Tools like FineBI and FineReport enable you to track customer behavior and test different marketing strategies. This ensures your website remains user-friendly and attractive, reducing abandoned carts and improving conversion rates.
Customer segmentation further enhances personalization. By grouping customers based on shared characteristics, you can target your marketing efforts more effectively. FineBI's self-service analytics make it easy to analyze customer data and implement targeted campaigns, boosting engagement and loyalty.
Optimizing Inventory and Operational Efficiency
Efficient inventory management is essential for meeting customer demand while minimizing costs. Retail industry data analysis helps you achieve this balance by providing insights into demand trends and stock levels. FineDataLink integrates data from various systems, enabling accurate demand forecasting. This ensures you stock the right products at the right time, reducing waste and avoiding stockouts.
Operational efficiency also improves with data-driven insights. FineReport generates detailed reports that highlight inefficiencies in your supply chain, allowing you to address them proactively. For example, Target used big data to identify underperforming products and replace them with more in-demand items, enhancing profitability.
Note: Real-time data analysis is a game-changer. Tools like FineBI provide real-time dashboards, helping you monitor operations and make quick adjustments as needed.
By optimizing inventory and streamlining operations, you can reduce costs, improve customer satisfaction, and drive revenue growth. Retail industry data analysis ensures your business remains agile and competitive in a dynamic market.
Driving Revenue Growth and Profitability
Retail industry data analysis plays a pivotal role in driving revenue growth and improving profitability. By leveraging data effectively, you can identify opportunities to boost sales, enhance customer engagement, and optimize operational efficiency. Tools like FineBI, FineReport, and FineDataLink empower you to analyze key performance indicators (KPIs) and make data-driven decisions that directly impact your bottom line.
To measure revenue growth, focus on metrics that provide actionable insights. For example:
Sales Performance: Track same-store sales growth and average transaction value to understand how well your stores are performing.
Customer Engagement: Use metrics like Customer Engagement Score (CES) and foot traffic to gauge how effectively you attract and retain customers.
Inventory Management: Monitor Gross Margin Return on Investment (GMROI) and Days Sales of Inventory (DSI) to ensure your inventory strategy supports profitability.
Financial Health: Analyze Cost of Goods Sold (COGS) and Operating Cash Flow (OCF) to maintain a healthy financial position.
FineBI simplifies the process of tracking these metrics by providing real-time dashboards and visualizations. For instance, you can use its OLAP analysis capabilities to drill down into sales data and identify trends that drive revenue. FineReport complements this by generating detailed reports that highlight areas for improvement, such as underperforming products or regions.
Customer segmentation is another powerful way to increase profitability. By grouping customers based on their purchasing behavior, you can tailor your marketing strategies to meet their specific needs. FineBI’s self-service analytics make it easy to segment customers and analyze their preferences. For example, you might discover that high-value customers respond well to exclusive promotions, while new customers prefer introductory discounts. Acting on these insights can significantly improve your conversion rates and customer loyalty.
Optimizing pricing strategies also contributes to revenue growth. Dynamic pricing, supported by tools like FineDataLink, allows you to adjust prices in real time based on demand and market conditions. This ensures you remain competitive while maximizing profits. Additionally, FineDataLink’s real-time data synchronization capabilities enable you to integrate data from multiple sources, providing a unified view of your business performance.
Finally, effective marketing campaigns can amplify your revenue. FineVis, FanRuan’s data visualization tool, helps you analyze the impact of your campaigns by visualizing key metrics like Return on Marketing Investment (ROMI) and conversion rates. With these insights, you can refine your strategies to achieve better results.
By combining advanced tools with retail industry data analysis, you can unlock new opportunities for growth. Whether it’s through better inventory management, personalized marketing, or dynamic pricing, data-driven strategies ensure your business stays ahead in a competitive market.
Types of Retail Industry Data Analysis
Descriptive Analytics in Retail
Descriptive analytics helps you understand what has happened in your retail business by analyzing historical data. It provides a clear picture of past sales, customer behavior, and inventory trends. For example, you can use FineBI to create visual dashboards that display sales performance over time, helping you identify peak shopping seasons or popular product categories.
This type of analysis answers questions like:
How many units of a product did you sell last month?
Which store locations performed the best?
What were the most common customer complaints?
Descriptive analytics focuses on summarizing data to provide insights into past events. It serves as the foundation for more advanced types of analysis. The table below highlights the difference between descriptive and diagnostic analytics:
By leveraging tools like FineReport, you can generate detailed reports that summarize key metrics, making it easier to track your business's historical performance.
Diagnostic Analytics for Problem Identification
Diagnostic analytics goes a step further by helping you understand why certain events occurred. It identifies patterns and relationships within your data, allowing you to pinpoint the root causes of issues. For instance, if sales dropped in a specific region, diagnostic analytics can reveal whether the cause was poor inventory management, ineffective promotions, or external factors like weather conditions.
FineBI simplifies this process by enabling you to drill down into your data and uncover hidden insights. You can analyze customer feedback, sales trends, and operational data to identify bottlenecks or inefficiencies. This type of analysis answers questions such as:
Why did a particular product underperform?
What caused an increase in customer returns?
Why did foot traffic decline in certain stores?
By addressing these questions, diagnostic analytics empowers you to make informed decisions and implement corrective actions. FineDataLink enhances this capability by integrating data from multiple sources, ensuring you have a comprehensive view of your business.
Predictive Analytics for Future Trends
Predictive analytics uses historical data and advanced algorithms to forecast future trends. It helps you anticipate customer behavior, optimize inventory, and refine pricing strategies. For example, FineBI allows you to analyze past sales data and predict demand for specific products during upcoming seasons.
This type of analysis offers several benefits:
It identifies popular products and anticipates demand fluctuations.
It enables personalized marketing strategies based on customer insights.
It improves inventory management by forecasting demand accurately.
Retailers can also use predictive analytics to build dynamic pricing models. FineDataLink supports this by synchronizing real-time data, ensuring your pricing strategies remain competitive. Additionally, tools like FineVis help visualize predictive models, making it easier to communicate insights across your team.
For instance, analyzing historical sales data alongside external factors like weather patterns can help you adjust inventory levels to meet customer needs effectively. This proactive approach ensures you stay ahead of market trends and maintain customer satisfaction.
You can try it out in the demo model below:
Prescriptive Analytics for Strategic Actions
Prescriptive analytics takes retail industry data analysis to the next level by not only predicting future trends but also recommending specific actions to achieve desired outcomes. This type of analytics empowers you to make strategic decisions that optimize operations, enhance customer satisfaction, and drive profitability.
For example, prescriptive analytics can help you determine the best stock levels for your stores. By analyzing past sales data and predicting demand, you can ensure products are available when customers need them. Tools like FineBI make this process seamless by providing real-time dashboards that visualize demand forecasts and suggest optimal stock quantities. This ensures you avoid overstocking or running out of popular items, saving costs and improving customer satisfaction.
Another powerful application of prescriptive analytics is in order management. Retailers often struggle with deciding how much inventory to order and where to allocate it. Prescriptive analytics simplifies this by recommending purchase quantities and allocations based on historical data and current trends. FineDataLink enhances this process by integrating data from multiple sources, ensuring accurate and timely recommendations. With this approach, you can streamline your supply chain and reduce inefficiencies.
Dynamic pricing is another area where prescriptive analytics shines. By analyzing customer behavior and market conditions, you can adjust prices in real time to maximize revenue. FineReport supports this by generating detailed reports that highlight pricing opportunities and their potential impact on sales. For instance, you might discover that offering discounts on slow-moving items during off-peak hours boosts sales without affecting profitability.
Prescriptive analytics also plays a crucial role in marketing strategies. By leveraging tools like FineVis, you can analyze the effectiveness of past campaigns and identify the best channels and messages for future promotions. This ensures your marketing efforts resonate with your target audience, driving higher engagement and conversion rates.
Incorporating prescriptive analytics into your retail operations allows you to make data-driven decisions with confidence. Whether it's optimizing inventory, refining pricing strategies, or enhancing marketing campaigns, this advanced form of retail industry data analysis ensures your business stays competitive and customer-focused.
Applications of Retail Industry Data Analysis
Personalizing Marketing Campaigns
Retail industry data analysis enables you to create highly personalized marketing campaigns that resonate with your customers. By analyzing consumer behavior, you can segment your audience into specific groups based on preferences, purchase history, and demographics. For instance, FineBI allows you to visualize customer data and identify patterns, making it easier to design targeted campaigns.
Understand consumer behavior: Analyze customer preferences to group them into target segments.
Create targeted offers: Use predictive analytics to offer personalized discounts and promotions.
Improve marketing ROI: Measure campaign performance and allocate budgets effectively.
Increase customer engagement: Build stronger relationships through tailored interactions.
Research by McKinsey shows that 71% of consumers expect personalized interactions, and 76% feel frustrated when companies fail to meet these expectations.
AI-powered tools like FineBI and FineVis enhance this process by analyzing browsing behavior and purchase history. These insights help you deliver personalized product recommendations and optimize marketing strategies. For example, incorporating user-generated content into campaigns can boost engagement and conversions. With tools like FineBI, you can track campaign performance in real time, ensuring your efforts yield maximum results.
Inventory Management and Demand Forecasting
Effective inventory management relies on accurate demand forecasting, which retail industry data analysis makes possible. Machine learning models can predict demand trends, helping you stock the right products at the right time. FineDataLink integrates data from multiple sources, enabling real-time monitoring of inventory and sales trends.
Forecast demand using machine learning: Predict future demand to manage inventory efficiently.
Monitor inventory dynamically: Use real-time analytics to adjust stock levels based on sales trends.
Leverage historical data: Analyze past sales to implement just-in-time inventory management.
For example, FineReport generates detailed reports that highlight inventory inefficiencies, allowing you to address them proactively. By reducing overstock and avoiding stockouts, you can minimize waste and improve customer satisfaction. Retailers like Walmart have successfully used data analytics to optimize their supply chains, ensuring products are always available when customers need them.
Tip: Real-time data integration with FineDataLink ensures your inventory strategy adapts to changing market conditions.
Pricing Strategies and Promotions
Retail industry data analysis plays a critical role in optimizing pricing strategies. By understanding customer behavior and price sensitivity, you can set competitive prices that maximize profitability. FineBI helps you analyze sales data and segment customers, enabling tailored pricing strategies.
Collect and analyze customer data to understand price sensitivity.
Segment products and customers for targeted pricing.
Set pricing rules based on demand and competition.
Test and monitor strategies to refine pricing decisions.
Dynamic pricing models, supported by FineDataLink, allow you to adjust prices in real time. For instance, you can increase prices for high-demand products during peak seasons or offer discounts on slow-moving items. FineReport complements this by generating reports that evaluate the effectiveness of your pricing strategies, ensuring they align with your business goals.
Retailers like Amazon have mastered dynamic pricing by leveraging data analytics. You can achieve similar success by using tools like FineBI and FineDataLink to automate pricing decisions and enhance your promotional efforts.
Enhancing Customer Loyalty Programs with FineBI
Customer loyalty programs are essential for building long-term relationships with your customers. Retail industry data analysis, powered by tools like FineBI, allows you to transform these programs into powerful drivers of engagement and profitability. By analyzing customer data, you can uncover valuable insights that help you create personalized experiences and foster loyalty.
FineBI simplifies the process of understanding customer behavior. Its self-service analytics enable you to segment customers based on their purchase history, preferences, and engagement levels. This segmentation helps you design loyalty programs that resonate with each group. For example, you can identify high-value customers and reward them with exclusive perks, encouraging them to spend more and stay loyal to your brand.
Did you know? Loyal customers spend 67% more on average than new ones. Retaining them is also five times cheaper than acquiring new customers.
Using FineBI, you can track key metrics like customer lifetime value (CLV) and repurchase rates. These insights allow you to measure the effectiveness of your loyalty programs and make data-driven improvements. For instance, if you notice a drop in engagement, you can adjust your rewards or introduce new incentives to re-engage your audience.
Here are some benefits of enhancing customer loyalty programs through data analysis:
Gain precise insights into customer behavior, allowing you to anticipate needs and address concerns.
Create tailored marketing campaigns that result in better engagement and higher conversion rates.
Maximize customer lifetime value by encouraging repeated purchases and increasing spending.
Enhance the overall customer experience by consistently meeting and exceeding expectations.
FineBI’s real-time dashboards provide a clear view of customer interactions and program performance. You can monitor trends, identify patterns, and respond quickly to changes. For example, if a specific reward is driving higher engagement, you can expand its availability to other customer segments.
Loyalty programs also reduce churn rates by turning one-time buyers into repeat customers. FineDataLink enhances this process by integrating data from multiple sources, giving you a comprehensive view of customer activity. With this unified data, you can create seamless experiences across all touchpoints, from online stores to physical locations.
FineReport complements FineBI by generating detailed reports on loyalty program performance. These reports highlight areas for improvement, such as underperforming rewards or inactive members. By addressing these issues, you can optimize your programs and ensure they deliver maximum value.
Incorporating retail industry data analysis into your loyalty strategies not only boosts customer retention but also drives revenue growth. Tools like FineBI and FineDataLink empower you to make informed decisions, ensuring your loyalty programs remain effective and relevant. By leveraging these insights, you can build stronger relationships with your customers and secure their loyalty for years to come.
Tools and Technologies for Retail Industry Data Analysis
Business Intelligence Tools like FineBI
Business intelligence tools play a vital role in retail industry data analysis by helping you synthesize data and track key performance indicators (KPIs). These tools enable you to generate reports, visualize trends, and make informed decisions. FineBI, for instance, empowers you to explore data independently through its self-service analytics capabilities. It provides real-time dashboards that allow you to monitor sales performance, customer behavior, and inventory levels.
Here are some of the most popular business intelligence tools used in retail:
Point-of-sale systems: These track and manage customer transactions, offering insights into purchasing patterns.
Customer relationship management (CRM) software: This helps manage customer interactions and identify sales opportunities.
Business intelligence tools: These synthesize data to track KPIs and generate actionable reports.
Inventory management systems: These monitor stock levels and forecast demand.
Predictive analytics: These use historical data to anticipate future trends and behaviors.
FineBI stands out by offering advanced OLAP analysis, enabling you to drill down into data and uncover hidden insights. Its intuitive interface and drag-and-drop functionality make it accessible even to users with limited technical expertise. By leveraging FineBI, you can transform raw data into meaningful insights that drive your retail strategies.
Data Integration Platforms such as FineDataLink
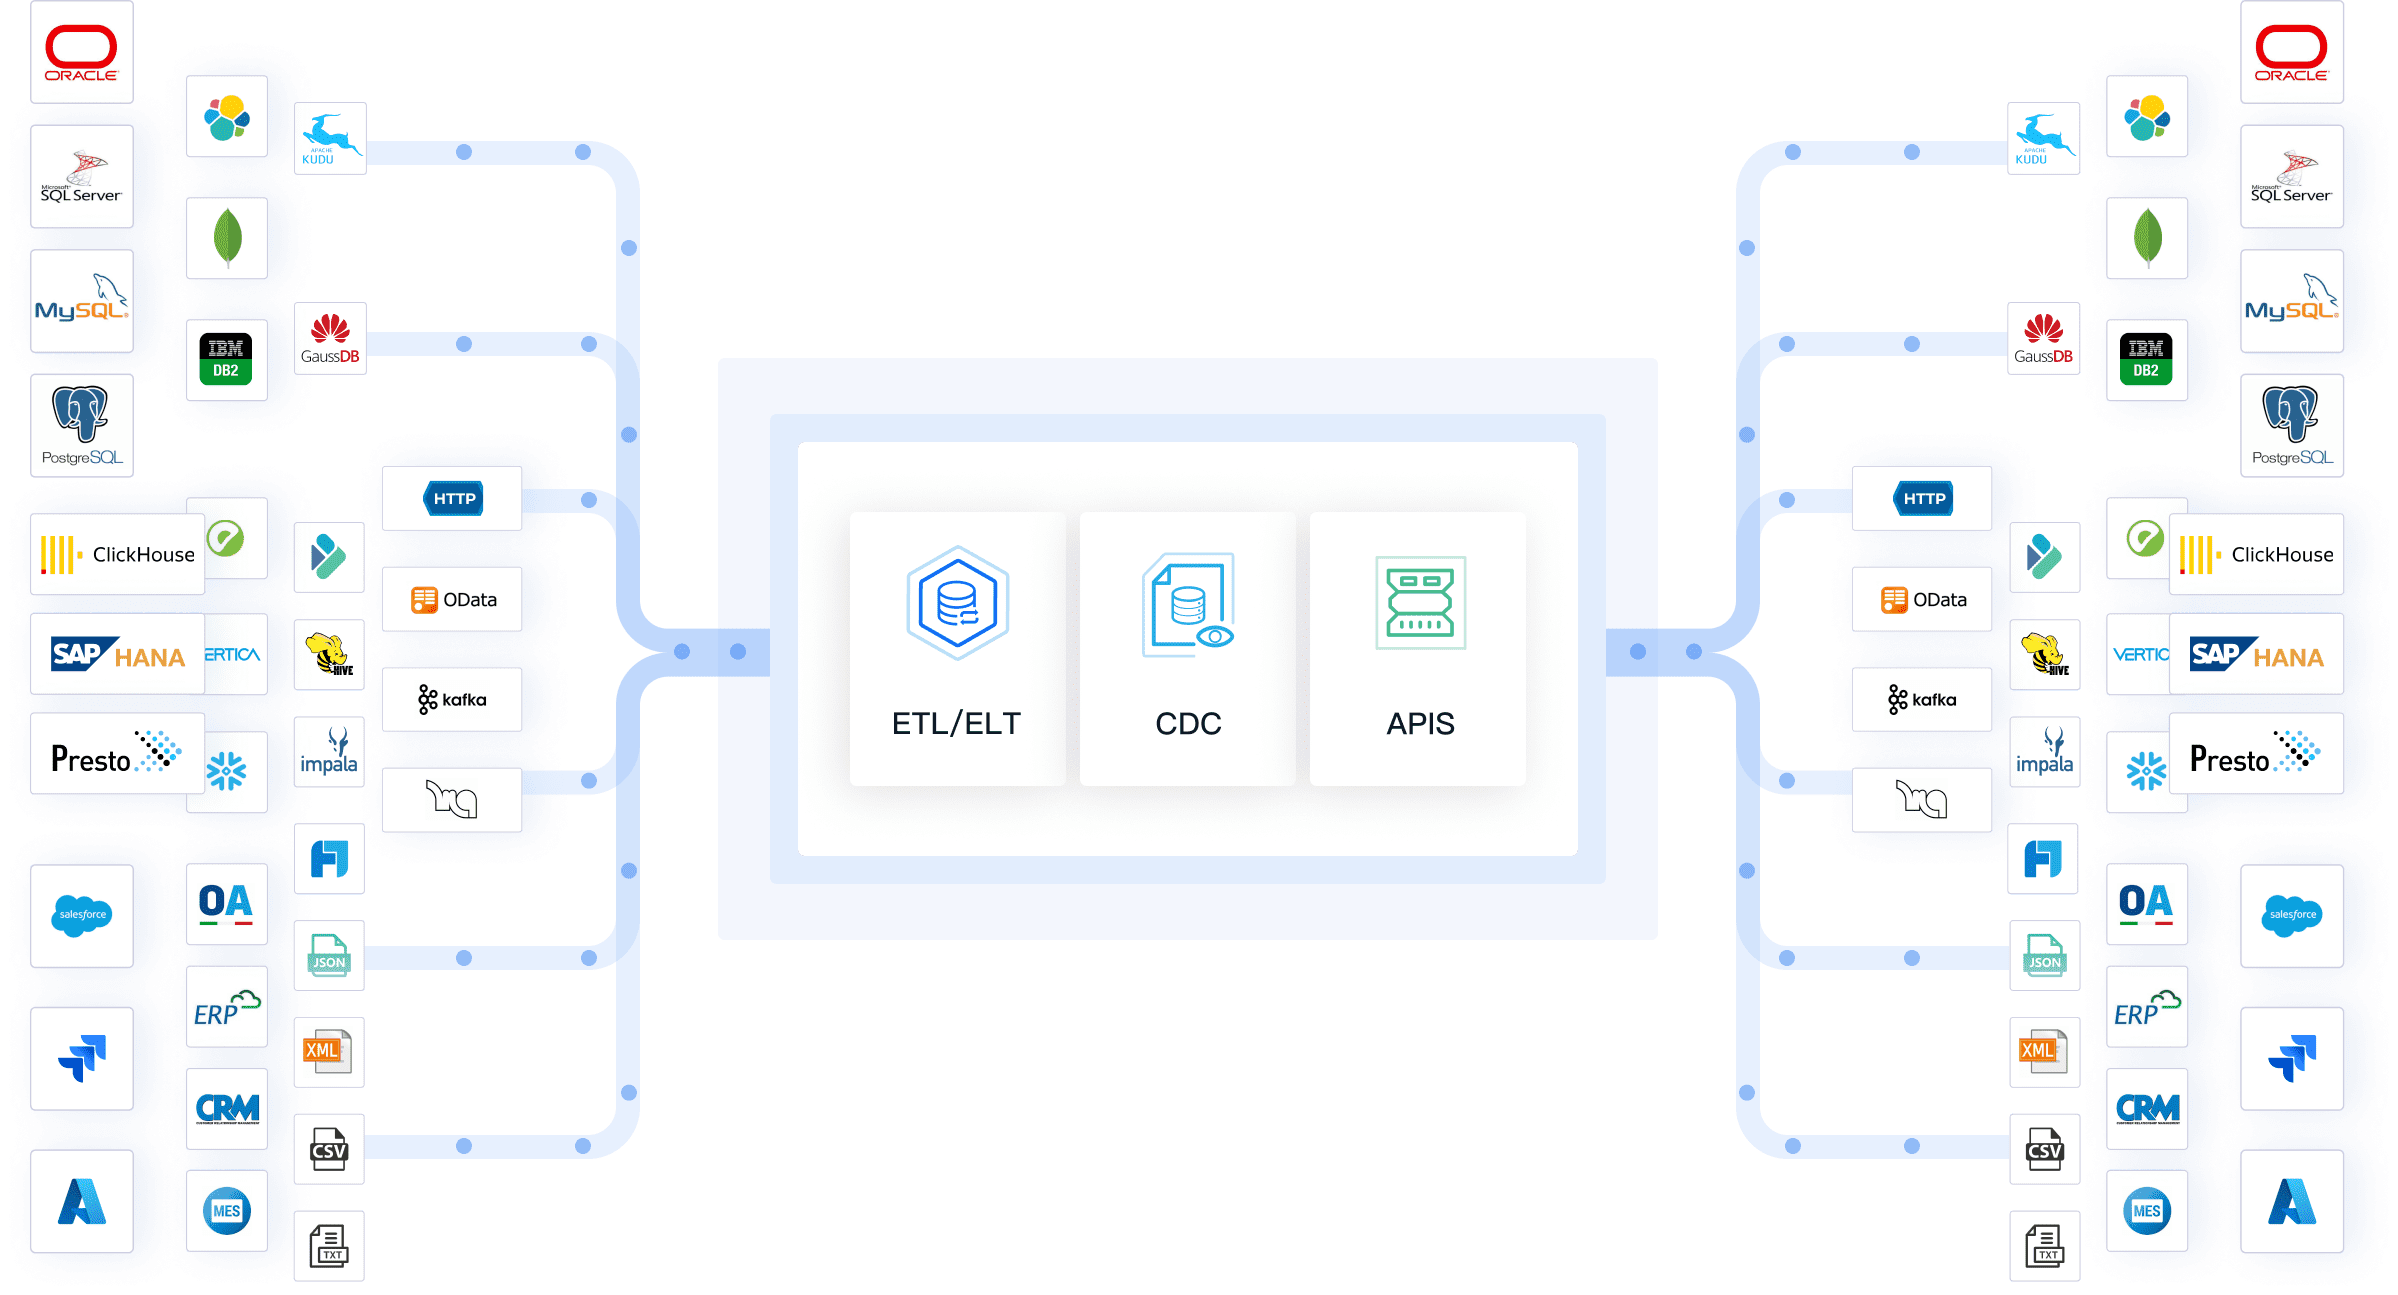
Data integration platforms streamline the process of retail industry data analysis by consolidating data from multiple sources. FineDataLink excels in this area by offering real-time data synchronization, advanced ETL/ELT capabilities, and API integration. These features ensure seamless data flow across your systems, enabling comprehensive analysis.
Key ways data integration platforms enhance retail operations include:
Customer Data Integration: Aggregates customer data from various sources, allowing you to personalize marketing efforts and improve customer service.
Inventory Management: Consolidates inventory data to prevent stockouts and overstock situations, optimizing supply chain efficiency.
Sales and Revenue Analytics: Facilitates detailed analysis of sales data, helping you identify trends and make data-driven decisions.
FineDataLink’s low-code platform simplifies complex data integration tasks, making it easier for your team to manage large datasets. Its ability to connect over 100 data sources ensures you have a unified view of your business operations. By using FineDataLink, you can enhance decision-making and operational efficiency in your retail business.
Reporting and Visualization Tools like FineReport
Reporting and visualization tools are essential for presenting data in a clear and actionable format. FineReport, a leading tool in this category, allows you to create pixel-perfect reports and dynamic dashboards. Its drag-and-drop interface simplifies report creation, while its advanced visualization options help you uncover deeper insights.
FineReport supports multi-source data integration, enabling you to combine data from various systems into a single report. It also offers automated task scheduling, which ensures timely delivery of reports to stakeholders. For example, you can use FineReport to generate detailed sales reports that highlight performance across different regions or product categories.
You can try it out in the demo model below:
The tool’s ability to integrate with FineDataLink further enhances its capabilities. This integration allows you to access real-time data, ensuring your reports reflect the latest business conditions. FineReport’s mobile compatibility ensures you can access your dashboards and reports anytime, anywhere, making it a versatile solution for retail industry data analysis.
Tip: Combining FineReport with FineBI and FineDataLink creates a powerful ecosystem for data analysis, reporting, and visualization. This ensures you have all the tools needed to optimize your retail operations.
Artificial Intelligence and Machine Learning in Retail Analytics
Artificial intelligence (AI) and machine learning (ML) have revolutionized retail industry data analysis. These technologies empower you to uncover deeper insights, predict trends, and make smarter decisions. By leveraging AI and ML, you can transform raw data into actionable strategies that enhance customer satisfaction and operational efficiency.
AI excels in predictive analytics, enabling you to forecast future trends and customer behaviors with remarkable accuracy. For example, tools like FineBI allow you to analyze historical sales data and predict demand for specific products. This helps you stock the right items at the right time, reducing costs associated with overstock or stockouts. AI-driven inventory management also optimizes stock levels, ensuring your shelves are always ready to meet customer needs.
Tip: AI-powered tools like FineDataLink integrate data from multiple sources, providing a unified view of your inventory and sales trends. This ensures seamless and accurate analysis.
Personalization is another area where AI shines. By analyzing customer data, AI tailors shopping experiences to individual preferences. This not only boosts customer satisfaction but also fosters loyalty. For instance, you can use FineBI to segment customers based on their purchase history and preferences. This allows you to create targeted marketing campaigns that resonate with specific groups. Personalized offers and recommendations can significantly increase conversion rates and customer retention.
AI also enhances pricing strategies through dynamic pricing models. These models adjust prices in real time based on market conditions and customer demand. FineDataLink supports this by synchronizing real-time data, ensuring your pricing strategies remain competitive. For example, you can increase prices for high-demand products during peak seasons or offer discounts on slow-moving items to clear inventory.
In supply chain operations, AI predicts disruptions and optimizes logistics. It can analyze market trends and buyer behavior to adapt delivery routes and pricing strategies quickly. FineReport complements this by generating detailed reports that highlight inefficiencies in your supply chain. These insights help you address issues proactively, improving transit times and customer satisfaction.
Did you know? AI systems can even limit overproduction and waste by generating accurate demand predictions. This not only reduces costs but also supports sustainable business practices.
By integrating AI and ML into your retail industry data analysis, you can unlock new opportunities for growth. Tools like FineBI, FineDataLink, and FineReport provide the advanced capabilities you need to stay ahead in a competitive market. Whether it’s through personalized marketing, optimized inventory, or dynamic pricing, AI ensures your business remains agile and customer-focused.
Best Practices for Effective Retail Industry Data Analysis
Setting Clear Objectives and KPIs
Establishing clear objectives and key performance indicators (KPIs) is essential for successful retail industry data analysis. Without a defined direction, your efforts may lack focus and fail to deliver meaningful results. Follow these steps to set effective objectives and KPIs:
Align with Business Objectives: Identify your business goals and ensure your KPIs reflect these priorities. For instance, if your goal is to improve customer retention, focus on metrics like repeat purchase rates or customer lifetime value.
Prioritize for Impact: Select a few impactful KPIs to avoid overwhelming your analysis. Concentrate on metrics that directly influence your business outcomes, such as sales growth or inventory turnover.
Consider Data Availability and Quality: Ensure the data required for your KPIs is accessible and reliable. Tools like FineDataLink can help integrate data from multiple sources, ensuring high-quality inputs for analysis.
Review and Adapt: Regularly evaluate your KPIs to ensure they remain relevant as your business evolves. For example, you might adjust your focus from in-store sales to online engagement as e-commerce grows.
By following these steps, you can create a roadmap for your data analysis efforts, ensuring they align with your business goals and deliver actionable insights.
Ensuring Data Quality and Accuracy
Accurate and high-quality data forms the backbone of effective retail industry data analysis. Poor data quality can lead to flawed insights and misguided decisions. Retailers often face challenges in maintaining data quality, as shown in the table below:
Data spread across various systems creates blind spots and missed opportunities.
Dirty Data
Incomplete or erroneous data undermines the reliability of analytics.
Not Actionable
Analytics that fail to lead to action become ineffective in driving business decisions.
To overcome these challenges, you need robust tools and strategies. FineDataLink excels in breaking down data silos by integrating information from diverse systems into a unified platform. It also supports real-time data synchronization, ensuring your analysis reflects the latest business conditions. Additionally, FineBI’s self-service analytics allow you to clean and validate data before diving into analysis, reducing errors and enhancing reliability.
Leveraging Tools like FineBI and FineDataLink
The right tools can significantly enhance your retail industry data analysis. FineBI and FineDataLink, developed by FanRuan, offer powerful features to streamline your efforts and maximize results.
FineBI empowers you to explore data independently through its intuitive dashboards and OLAP analysis capabilities. You can visualize trends, track KPIs, and uncover actionable insights without relying on IT support. For example, FineBI’s drag-and-drop interface simplifies the process of analyzing customer behavior or sales performance, enabling you to make informed decisions quickly.
FineDataLink complements FineBI by addressing data integration challenges. Its low-code platform allows you to consolidate data from over 100 sources, ensuring a seamless flow of information. Whether you need to synchronize real-time sales data or preprocess inventory data for analysis, FineDataLink provides the tools to do so efficiently. This integration ensures your analysis remains comprehensive and accurate, giving you a competitive edge in the retail market.
By leveraging these tools, you can transform raw data into meaningful insights that drive growth and profitability. Together, FineBI and FineDataLink create a robust ecosystem for data analysis, helping you stay ahead in a dynamic retail environment.
Training Teams and Building Analytical Skills
Building analytical skills within your team is essential for maximizing the potential of retail industry data analysis. When your employees understand how to interpret data, they can make informed decisions that drive business success. Training your team not only enhances their individual capabilities but also fosters a culture of data-driven decision-making across your organization.
Why Training Matters
Training equips your team with the skills to collect, analyze, and derive actionable insights from data. Employees learn to navigate large datasets, identify key trends, and uncover patterns that might otherwise go unnoticed. This ability to interpret data improves problem-solving and critical thinking, enabling your team to address challenges with confidence.
Tip: A well-trained team can transform raw data into meaningful insights, helping you stay competitive in the fast-paced retail industry.
Benefits of Analytical Skills in Retail
When your team develops analytical skills, your business gains several advantages:
Employees can identify trends in customer behavior, helping you tailor marketing strategies.
Teams become adept at optimizing inventory by predicting demand more accurately.
Decision-making becomes faster and more precise, reducing operational inefficiencies.
A data-driven culture ensures that every department aligns with your business goals.
For example, tools like FineBI empower your team to perform self-service analytics. With its intuitive dashboards and OLAP analysis, employees can explore data independently, uncovering insights without relying on IT support. Similarly, FineDataLink simplifies data integration, ensuring your team has access to accurate and up-to-date information for analysis.
How to Build Analytical Skills
To build analytical skills effectively, focus on these key areas:
Provide Hands-On Training: Use tools like FineBI and FineReport to teach employees how to create dashboards, generate reports, and visualize data trends.
Encourage Collaboration: Foster teamwork by using platforms like FineVis, which allows multiple users to collaborate on data visualizations and share insights.
Offer Continuous Learning: Regular workshops and online courses ensure your team stays updated on the latest trends in retail industry data analysis.
Leverage Real-Time Data: Train employees to use real-time data integration tools like FineDataLink for dynamic decision-making.
Note: Investing in training not only enhances your team's skills but also boosts their confidence in handling complex data tasks.
By empowering your team with analytical skills, you create a workforce capable of driving innovation and efficiency. Tools like FineBI and FineDataLink make this process seamless, ensuring your team can harness the full potential of retail industry data analysis. As a result, your business becomes more agile, customer-focused, and prepared to thrive in a competitive market.
Challenges in Retail Industry Data Analysis
Addressing Data Privacy and Security Concerns
Data privacy and security remain critical challenges in retail industry data analysis. As you collect and analyze customer data, you must address several pressing concerns to maintain trust and compliance. Over-targeting, for instance, can alienate customers by delivering overly precise or intrusive marketing messages. Excessive data collection also raises red flags, especially when you gather more information than necessary. Furthermore, a lack of transparency around how you use customer data amplifies consumer anxieties.
To mitigate these risks, you should adopt robust data governance practices. Tools like FineDataLink can help by centralizing data and ensuring compliance with privacy regulations. Its real-time data synchronization capabilities allow you to monitor data usage and prevent unauthorized access. Additionally, FineBI’s role-based access control ensures sensitive information remains secure, limiting access to only those who need it. By leveraging these tools, you can build a secure and transparent data ecosystem that fosters customer trust.
Managing Large Volumes of Data
Handling large volumes of data is another significant challenge in retail analytics. Without a clear strategy, managing unstructured data and ensuring its quality can become overwhelming. To tackle this, you should establish a well-defined approach that guides your data analysis objectives. Organizing and categorizing data ensures proper management and security, while tools like FineBI and FineReport simplify the process of generating key performance indicators (KPIs) and visualizing complex data.
Cloud computing offers a scalable solution for managing large datasets. FineDataLink integrates seamlessly with cloud platforms, enabling flexible and efficient data storage. It also supports advanced ETL/ELT processes, allowing you to preprocess data for analysis. By employing these strategies, you can transform raw data into actionable insights, ensuring your retail operations remain agile and data-driven.
Integrating Data Across Multiple Systems
Integrating data from various systems poses unique challenges in retail industry data analysis. Siloed systems often lack visibility, creating blind spots in your analytics. Disparate systems and inconsistent data formats further complicate integration efforts, leading to delays in data delivery and inaccurate insights. For example, poor data quality can result in misleading analytics, while delays hinder real-time decision-making.
To overcome these obstacles, you need a unified platform that consolidates data from multiple sources. FineDataLink excels in this area by breaking down silos and providing a single source of truth. Its low-code interface simplifies the integration process, ensuring data flows seamlessly across your systems. Additionally, FineBI’s self-service analytics enable you to analyze integrated data effortlessly, uncovering insights that drive better decisions. By addressing these integration challenges, you can create a cohesive data environment that supports your business goals.
Tip: Regularly monitor and validate your integrated data to maintain its accuracy and reliability. Tools like FineReport can automate this process, ensuring your analytics remain trustworthy.
Keeping Up with Technological Advancements
The retail industry is evolving rapidly, and staying ahead requires you to embrace the latest technological advancements in retail industry data analysis. These innovations not only streamline operations but also provide deeper insights into customer behavior, helping you make smarter decisions.
Modern technologies are transforming how you analyze data. Here are some of the most impactful advancements:
Integration of AI and machine learning for enhanced customer personalization.
Predictive analytics to forecast trends and behaviors.
Natural language processing and computer vision for improved customer interactions.
Virtual shopping assistants and automated customer service.
AI-driven demand forecasting for better inventory management.
These tools allow you to uncover patterns and trends that were previously invisible. For instance, AI and machine learning can analyze vast amounts of customer data to deliver personalized shopping experiences. Tools like FineBI make this process seamless by enabling you to explore customer preferences and segment audiences effectively. This ensures your marketing campaigns resonate with your target audience.
Predictive analytics is another game-changer. By analyzing historical data, you can anticipate future trends and adjust your strategies accordingly. FineDataLink enhances this capability by integrating data from multiple sources, ensuring accurate and real-time forecasting. For example, you can predict demand for specific products during peak seasons, helping you optimize inventory and reduce waste.
Natural language processing (NLP) and computer vision are also reshaping customer interactions. NLP enables chatbots and virtual assistants to understand and respond to customer queries, improving service quality. Meanwhile, computer vision powers features like visual search, allowing customers to find products by uploading images. FineReport supports these innovations by generating detailed reports that track the performance of these technologies, ensuring they align with your business goals.
Tip: Embracing these advancements keeps your business competitive and customer-focused. Tools like FineBI and FineDataLink simplify the adoption process, making it easier for you to integrate cutting-edge technologies into your operations.
AI-driven demand forecasting takes inventory management to the next level. By analyzing sales trends and external factors, you can ensure your shelves are stocked with the right products at the right time. FineVis complements this by visualizing demand patterns, helping you make data-driven decisions with confidence.
Staying updated with technological advancements in retail industry data analysis is no longer optional. It’s essential for maintaining agility in a fast-paced market. By leveraging tools like FineBI, FineReport, FineDataLink, and FineVis, you can harness the power of these innovations to drive growth and enhance customer satisfaction.
Retail industry data analysis drives business success by enabling smarter decisions, improving inventory management, and enhancing customer satisfaction. Tools like FineBI and FineReport simplify this process through data visualization and automation, helping you analyze sales trends and customer behavior efficiently. FineDataLink ensures seamless data integration, providing a unified view of your operations for strategic planning.
Looking ahead, advancements in AI and predictive analytics will transform the retail landscape. These technologies will optimize inventory, personalize customer experiences, and refine pricing strategies. By adopting these innovations, you can stay competitive and meet evolving market demands. Retail industry data analysis will continue to empower businesses, unlocking new growth opportunities and ensuring long-term success.
Click the banner below to also experience FineDataLink for free and empower your enterprise to convert data into productivity!
What is the role of FineBI in retail industry data analysis?
FineBI simplifies retail data analysis by offering self-service analytics. You can explore customer behavior, track sales trends, and visualize KPIs through interactive dashboards. Its OLAP capabilities allow you to drill down into data, uncovering actionable insights that help you make smarter business decisions.
How does FineDataLink improve data integration for retail businesses?
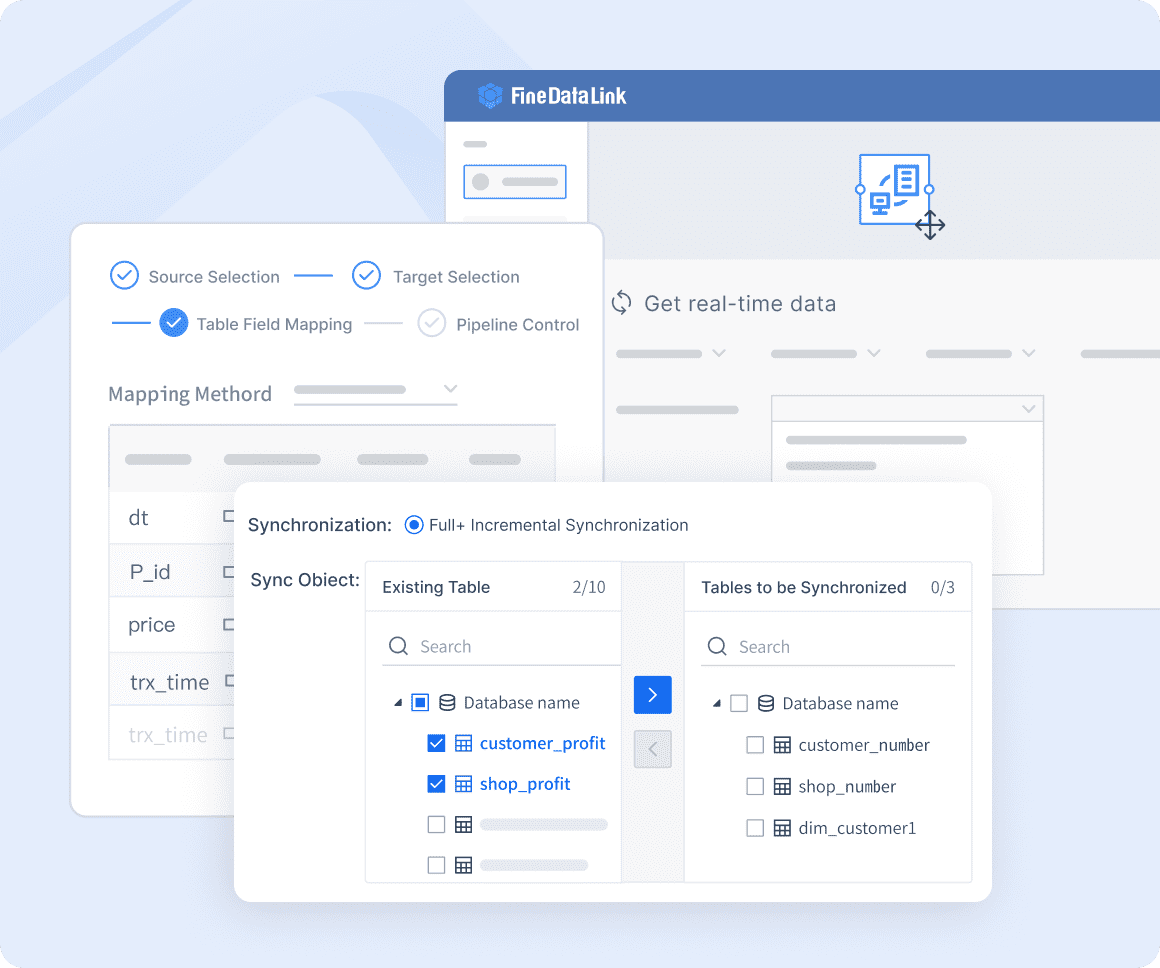
FineDataLink integrates data from over 100 sources, breaking down silos and ensuring seamless data flow. Its real-time synchronization and ETL/ELT capabilities enable you to consolidate inventory, sales, and customer data. This unified view enhances your retail industry data analysis and supports accurate forecasting.
Can FineReport help with inventory management?
Yes, FineReport generates detailed reports that highlight inventory trends and inefficiencies. You can use its automated scheduling to receive regular updates on stock levels. By integrating with FineDataLink, FineReport ensures real-time data accuracy, helping you optimize inventory and reduce waste.
How does FineVis enhance marketing campaigns in retail?
FineVis visualizes campaign performance metrics like conversion rates and ROI. You can analyze customer engagement and identify successful strategies. Its intuitive interface allows you to adjust campaigns in real time, ensuring your marketing aligns with customer preferences and boosts sales.
Why is real-time data important in retail industry data analysis?
Real-time data ensures you respond quickly to market changes. Tools like FineBI and FineDataLink provide real-time dashboards and synchronization, helping you monitor sales, inventory, and customer behavior. This agility improves decision-making and keeps your business competitive.
How can predictive analytics benefit retail businesses?
Predictive analytics forecasts future trends using historical data. FineBI and FineDataLink support this by analyzing past sales and customer behavior. You can anticipate demand, optimize pricing, and personalize marketing. This proactive approach enhances customer satisfaction and drives revenue growth.
What makes FineBI suitable for non-technical users?
FineBI’s drag-and-drop interface and self-service analytics make it accessible to users without technical expertise. You can create dashboards, analyze trends, and generate insights independently. This empowers your team to leverage retail industry data analysis without relying on IT support.
How do FanRuan’s tools work together for retail success?
FineBI, FineReport, FineDataLink, and FineVis form a powerful ecosystem. FineDataLink integrates data, FineBI analyzes it, FineReport generates detailed reports, and FineVis visualizes insights. Together, they streamline retail industry data analysis, helping you optimize operations, enhance customer experiences, and boost profitability.
Product Trial
FineReport
Pixel-perfect reports · Interactive dashboards · Easy data entry · Digital twins