Software reporting tools are systems that automatically collect, organize, and present data from multiple sources as clear reports and dashboards to support informed decision-making.Here are three top software reporting tools that will help you make accurate decisions:
In 2025, software reporting tools play a crucial role in transforming raw data into actionable insights. These tools empower you to make informed decisions by providing clear and concise reports. FineReport and FineBI stand out as top choices for businesses seeking efficient data analysis and visualization. FineReport excels in creating pixel-perfect reports, while FineBI offers self-service analytics for deeper insights. By leveraging these tools, you can enhance your data-driven strategies and drive growth.
Business Intelligence (BI) tools are pivotal in converting raw data into actionable insights, empowering organizations to make informed decisions. By analyzing and visualizing complex datasets, these tools facilitate a deeper understanding of business dynamics, ultimately enhancing strategic planning and operational efficiency. In an increasingly data-driven world, leveraging BI tools is essential for businesses seeking to maintain a competitive edge.

Data visualization tools play a crucial role in transforming raw data into visually compelling representations, making complex information more accessible and understandable. By converting data into charts, graphs, and maps, these tools help identify trends, patterns, and outliers, enabling users to glean insights at a glance. In today's data-centric environment, effective visualization is key to informed decision-making and strategic planning.

Financial reporting tools are essential for managing and analyzing financial data, providing organizations with the insights needed to track performance and make strategic decisions. These tools facilitate effective budgeting and forecasting, enabling businesses to navigate financial landscapes with confidence. By leveraging these tools, organizations can enhance their financial transparency and accountability.
By understanding these types of software reporting tools, you can choose the right solution to meet your business needs and drive growth.

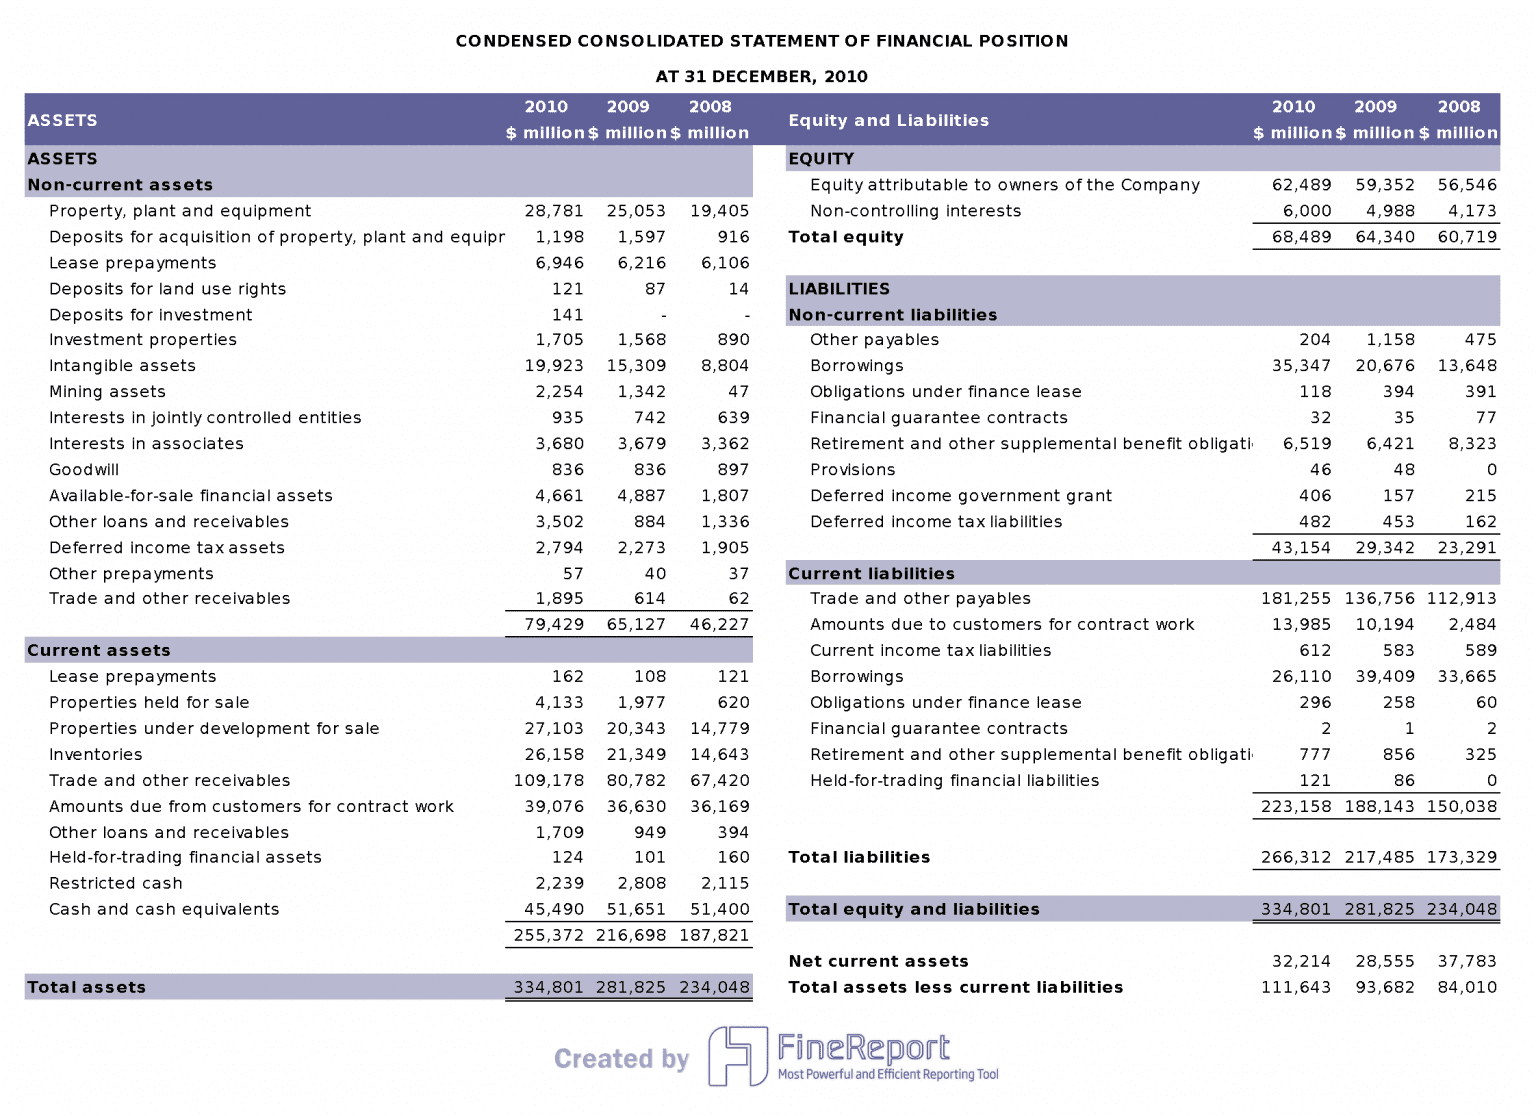
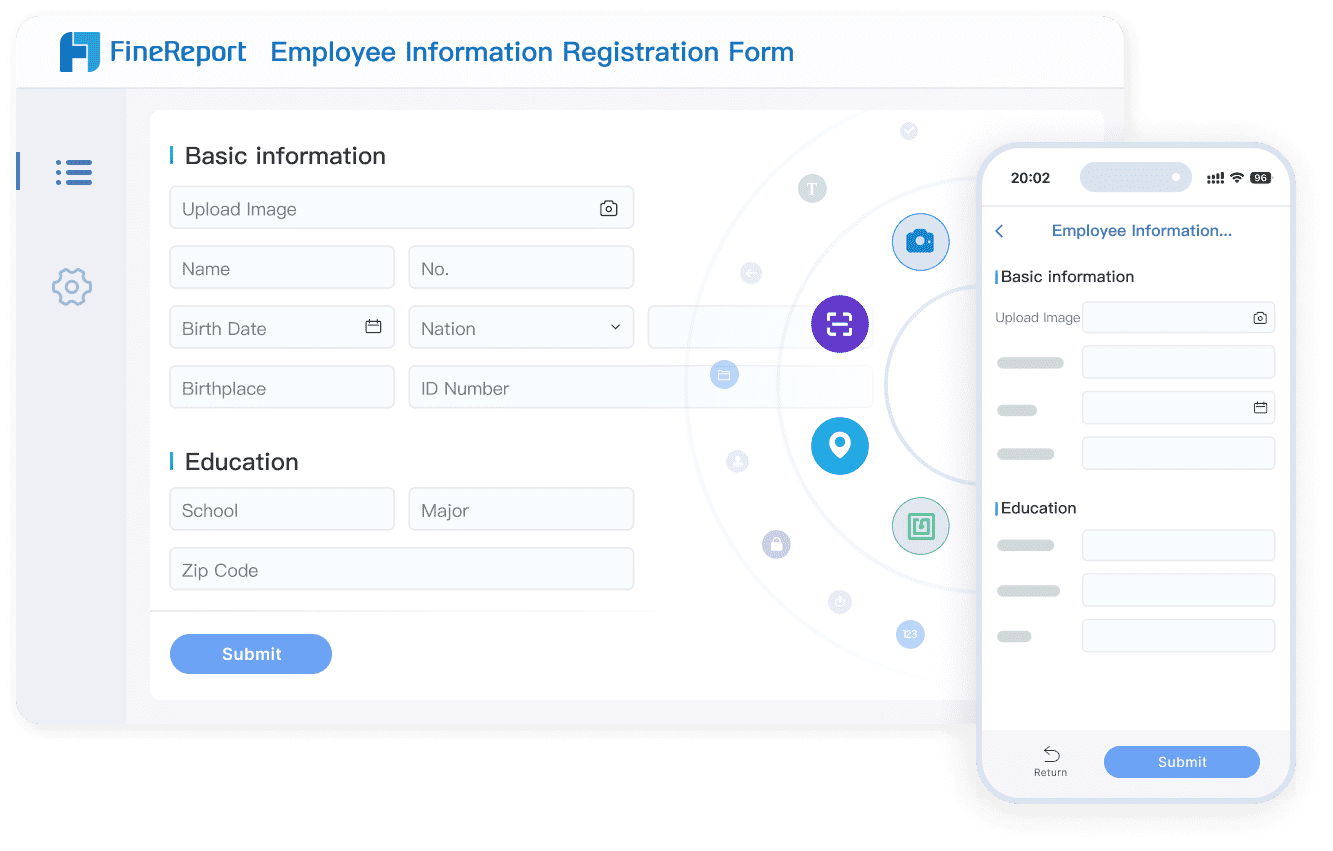
FineReport distinguishes itself as a powerful and versatile reporting tool designed to meet a wide range of business needs. Its user-friendly interface, reminiscent of Excel, ensures that users familiar with spreadsheet software can navigate and utilize its features effortlessly. This intuitive design significantly reduces the learning curve, enabling quick adoption across teams.
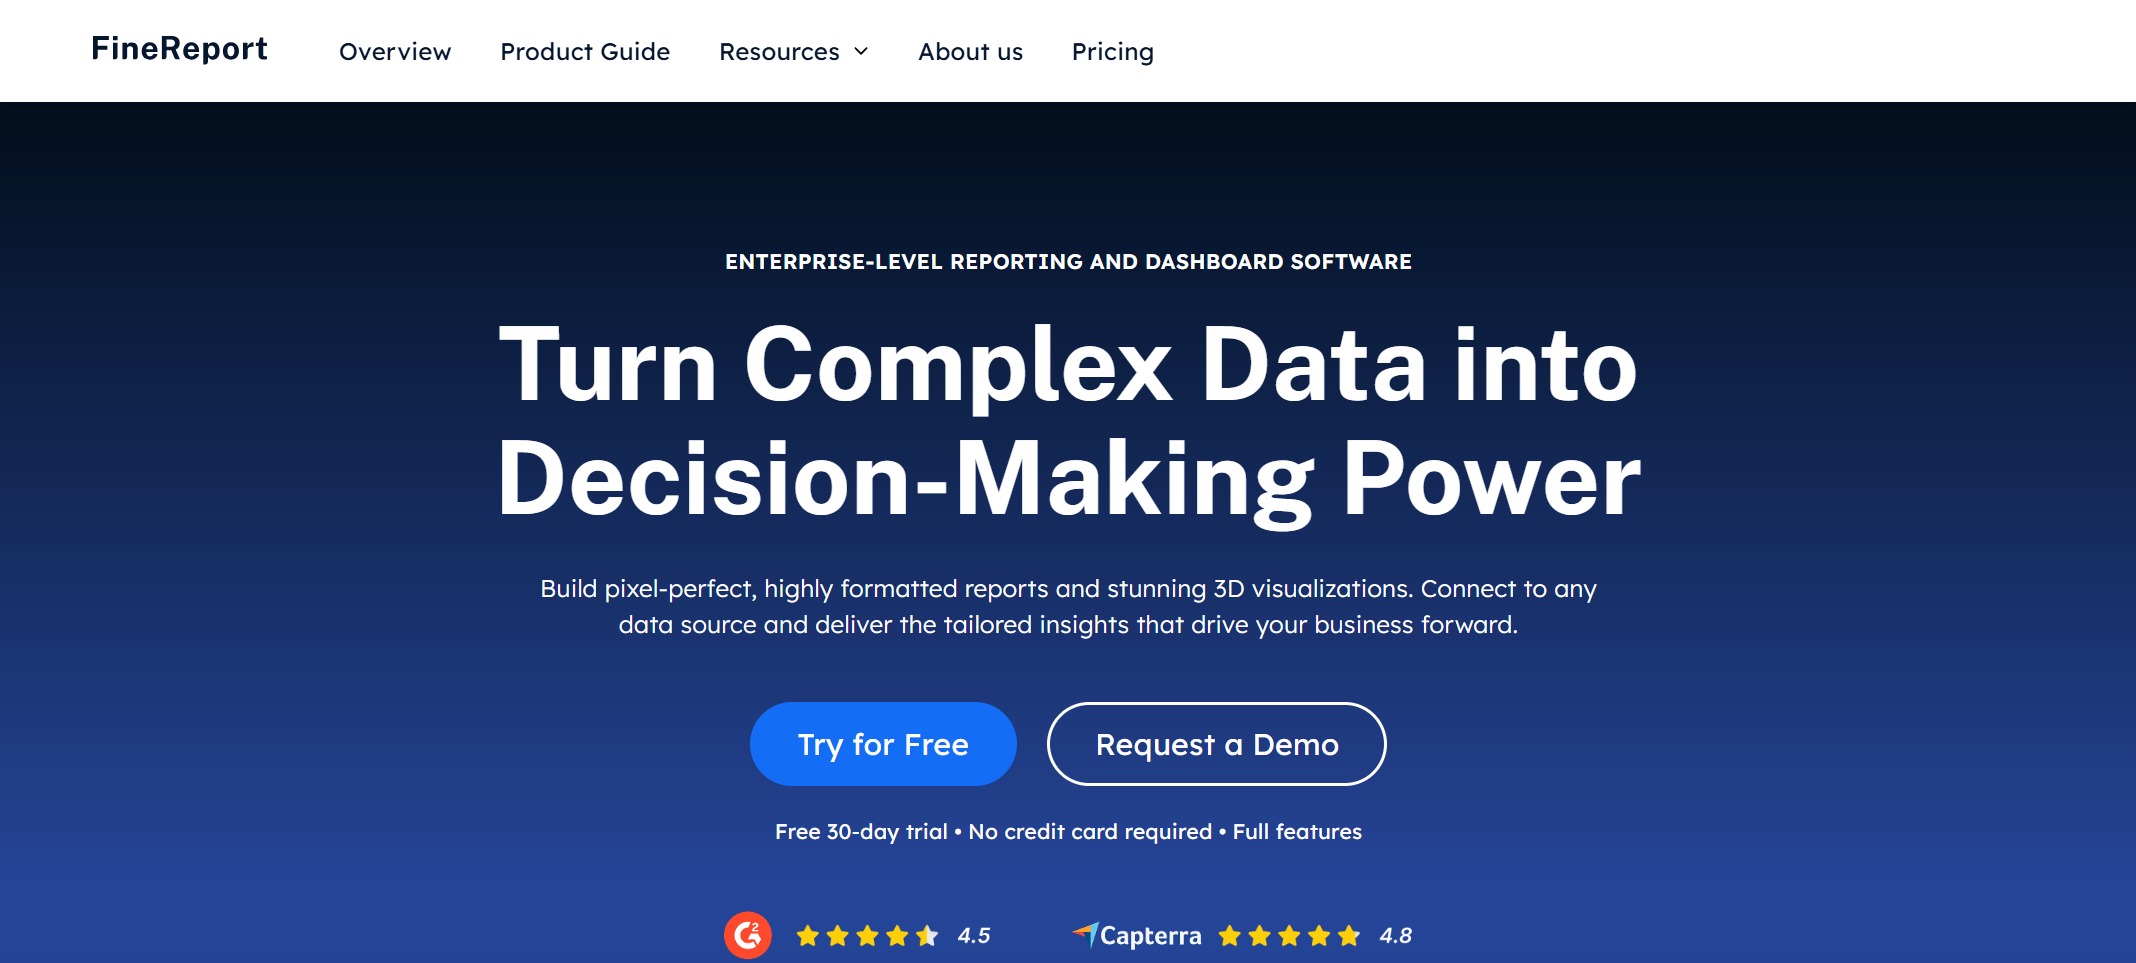
Website: https://www.fanruan.com/en/finereport
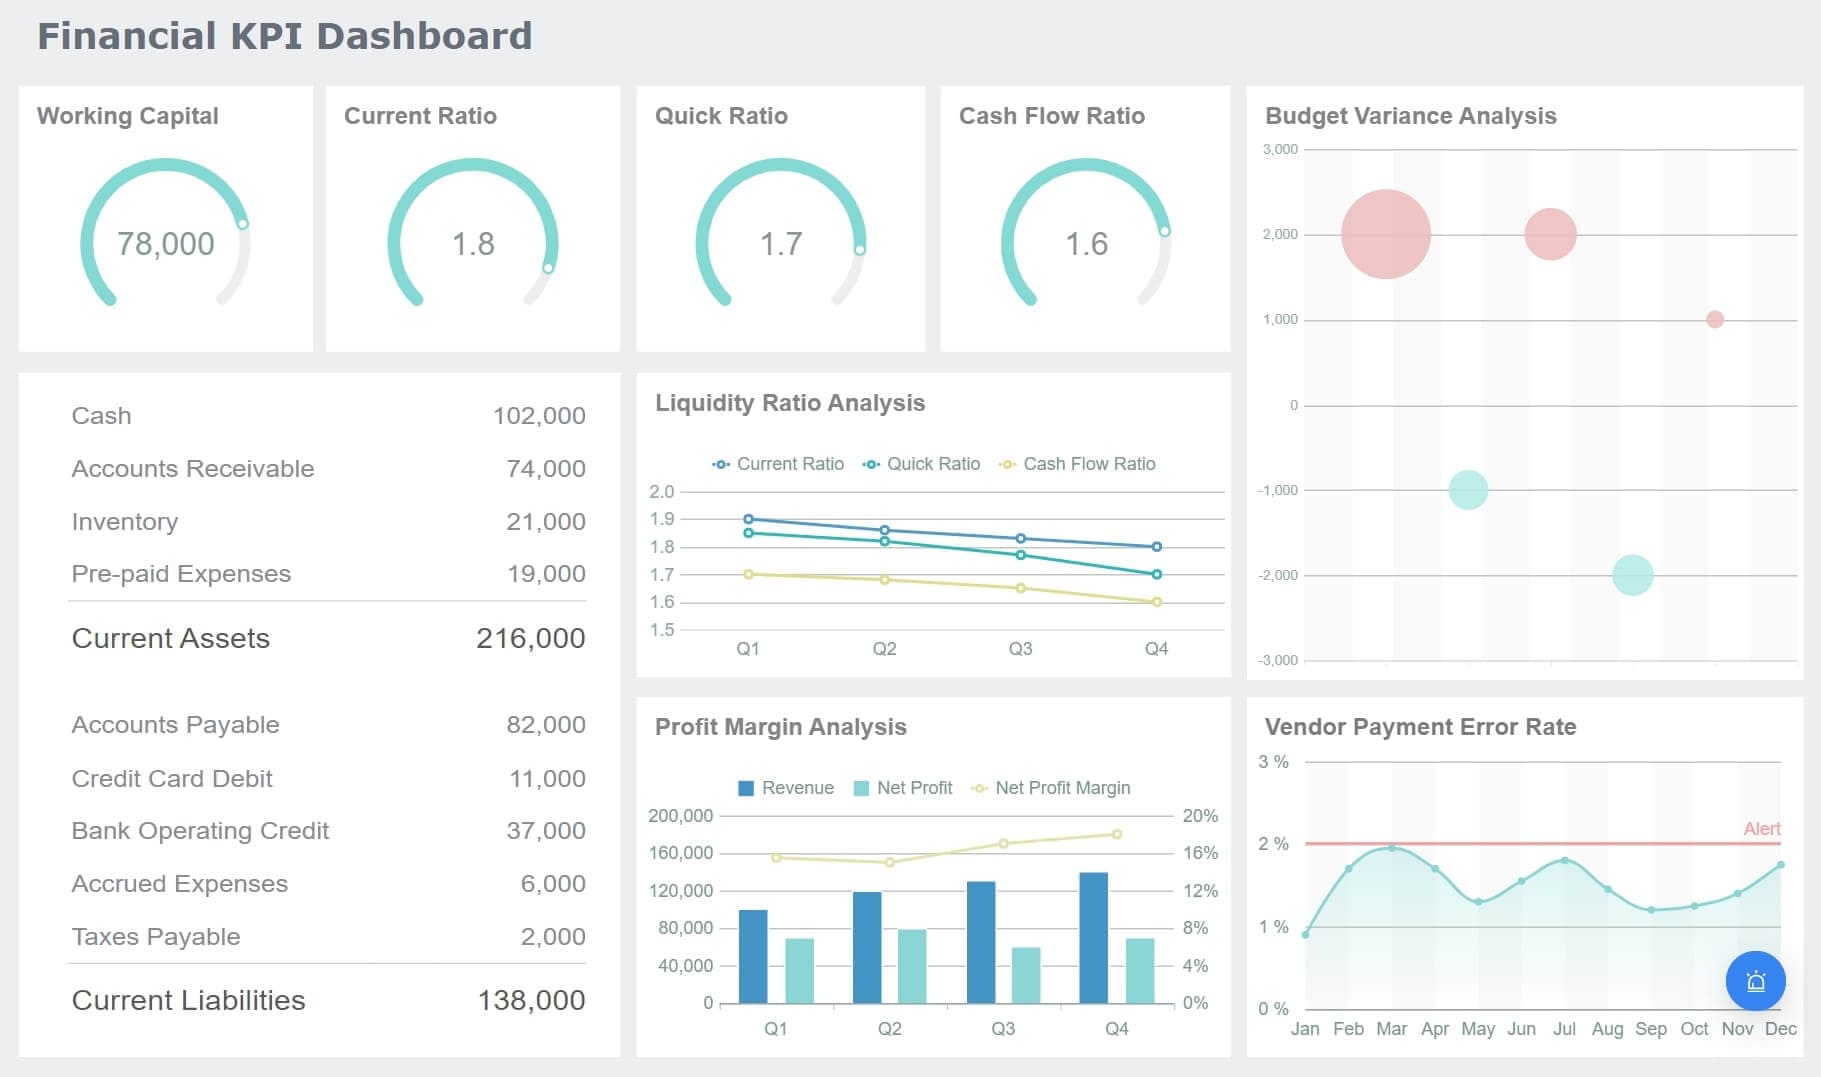
With FineReport, users can effortlessly create pixel-perfect reports that maintain high visual standards. The platform’s drag-and-drop functionality simplifies the report creation process, allowing for quick arrangement and customization of elements. This ease of use empowers users to focus on analyzing data rather than getting bogged down in complex formatting, resulting in efficient and effective reporting that meets the demands of today’s fast-paced business environment.

Pros:
Cons:
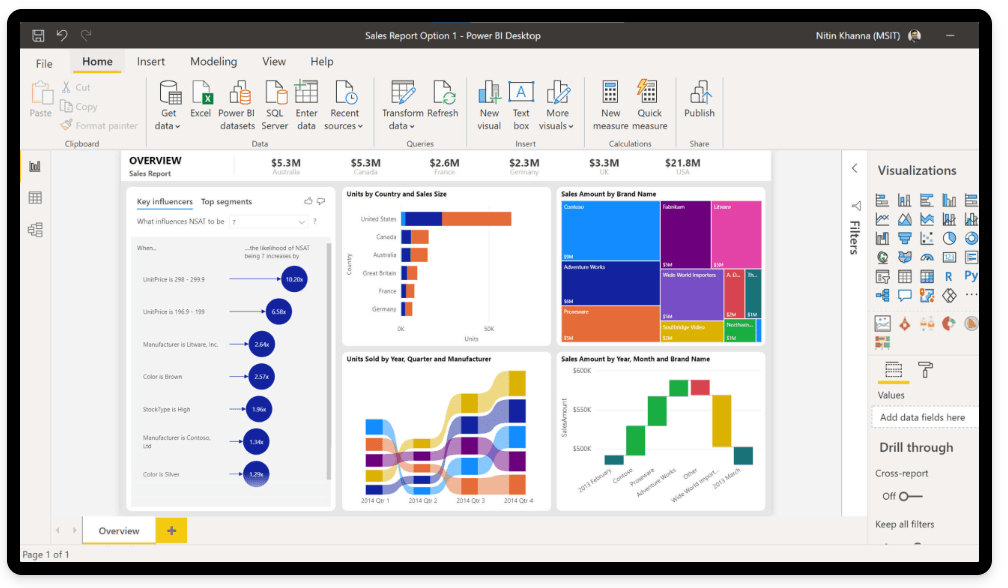
Microsoft Power BI is a powerful business intelligence tool known for its interactive visualizations. It integrates seamlessly with other Microsoft products, making it a popular choice for organizations already using Microsoft Office.
Website: https://www.microsoft.com/en-us/power-platform/products/power-bi
Pros:
Cons:
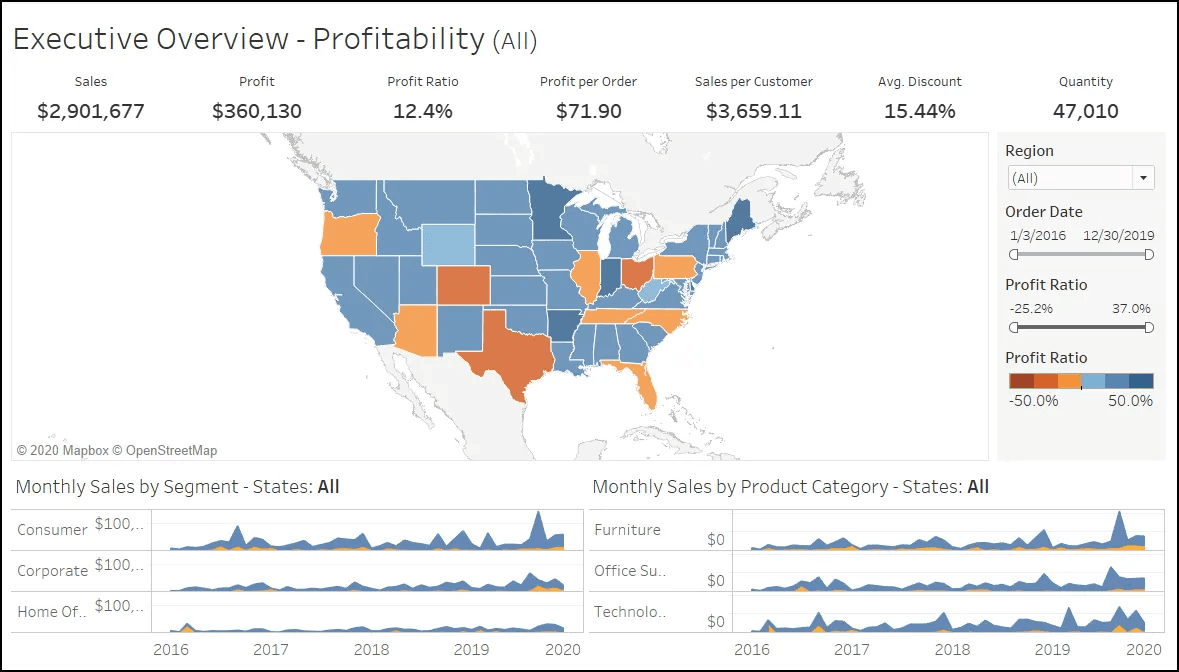
Tableau is renowned for its robust data visualization capabilities. It empowers you to transform raw data into insightful visual stories, making it a favorite among non-technical users.
Website: https://www.tableau.com/
Pros:
Cons:
By comparing these top software reporting tools, you can identify the one that best aligns with your business needs. Whether you prioritize customization, integration, or visualization, each tool offers unique advantages to enhance your data-driven strategies.
Choosing the right software reporting tool requires careful evaluation of several key factors. These considerations ensure that the tool aligns with your business objectives and enhances your data-driven strategies.
When selecting a software reporting tool, it's essential to weigh the cost against the value it delivers. Some tools offer basic features at a lower price point, while others provide advanced capabilities at a higher cost. Consider your budget alongside the specific functionalities you require. A tool that offers excellent value will enhance your reporting capabilities without placing undue strain on your finances. Look for solutions with flexible pricing plans that allow for scalability as your business evolves.
Usability is a critical factor in the effectiveness of any reporting tool. A user-friendly interface ensures that users can navigate the tool with ease and create reports without requiring extensive training. Renowned platforms like Tableau and Microsoft Power BI are celebrated for their intuitive designs, making them accessible to users across various levels of technical expertise. Evaluate the user experience by assessing how quickly you can learn to use the tool and how efficiently you can perform tasks. A well-designed interface will not only save you time but also minimize frustration, leading to a more productive reporting process.
Integration capabilities are another vital consideration when selecting software reporting tools. The ideal tool should seamlessly connect with your existing systems and data sources, enabling you to access and analyze data from multiple platforms without the need for manual data entry. Tools like FineReport and Power BI excel in integrating with diverse data sources, providing a cohesive view of your information. Assess the tool's compatibility with your current software and databases to ensure smooth operations and comprehensive reporting.
By considering these factors—budget, usability, and integration—you can choose software reporting tools that meet your business needs and supports your data-driven goals. Each factor plays a significant role in ensuring that the tool enhances your reporting capabilities and contributes to your organization's success.

Choosing the right software reporting tool is crucial for your business success. It ensures that you can efficiently transform data into actionable insights. Consider your personal needs and preferences when selecting a tool. Look for one that aligns with your capabilities and offers excellent customer support.
The landscape of software reporting tools continues to evolve. Stay informed and adaptable to leverage the best tools available for your data-driven strategies.
Choosing the right software reporting tool involves several key steps:
Identify Your Needs: Determine what you need from a reporting tool. Consider factors like data sources, report types, and user access levels.
Evaluate Features: Look for essential features such as data integration, customization, and automation. Tools like ClearPoint offer unique capabilities to link projects with goals, providing a dynamic view of your strategy.
Consider Usability: Ensure the tool is user-friendly. A tool with an intuitive interface will save time and reduce frustration.
Check Integration: Make sure the tool integrates seamlessly with your existing systems. This ensures smooth data flow and comprehensive reporting.
Assess Cost: Balance the cost against the value provided. Some tools offer flexible pricing plans to fit different budgets.
When selecting a reporting tool, focus on these essential features:
Data Integration: The ability to pull data from multiple sources is crucial. Tools like FineDataLink excel in automating data collection and conversion into visual reports.
Customization: You should be able to tailor reports to match your organization's needs and branding. This flexibility enhances the relevance and impact of your reports.
Automation: Automation reduces repetitive tasks and saves time. Look for tools with built-in automation to streamline your reporting process.
Visualization: Effective data visualization helps in understanding trends and insights. Choose tools that offer diverse visualization options to present data clearly.
By focusing on these aspects, you can select a reporting tool that aligns with your business goals and enhances your data-driven strategies.
Top 12 OLAP Tools for Business Intelligence—Explore Now!
Top Client Reporting Tools for Agencies in 2025!

The Author
Lewis
Senior Data Analyst at FanRuan
Related Articles

10 Custom Reporting Dashboard Tools Compared: Features, Limits, and Best-Fit Use Cases
Compare 10 custom reporting dashboard tools on features, limits, and best-fit use cases.
Lewis Chou
May 03, 2026

10 Best Dashboard Reporting Tools for 2026 Compared: Power BI, Tableau, Looker Studio, and More
Dashboard reporting tools are software platforms that turn business data into interactive dashboards, scheduled reports, and decision ready insights.
Lewis Chou
Apr 27, 2026
How to create an HTML report from scratch in 2026
Build an html report from scratch in 2026 with easy steps, tools, and tips for customization, sharing, and making your data clear and interactive.
Lewis Chou
Mar 23, 2026


