If you want to save hours every month and boost your team’s efficiency, you need to automate reports. Automated reporting tools cut out manual data collection, formatting, and distribution, so you can focus on analysis and decision-making.
With the right reporting tools, you unlock more time for high-value work.
When you automate reports, you unlock a new level of efficiency for your business. Reporting tools help you move away from tedious manual work and focus on what matters most—making decisions and driving results. Many organizations choose automation for several reasons:
Recent case studies show the impact of automated reporting on productivity:
With reporting tools, you spend less time gathering data and more time creating visualizations and exploring actionable insights. Automation lets you respond to trends faster and empowers you to make data-driven decisions. You can use these tools to create dashboards, schedule regular updates, and share results with your team or clients. Reporting software also helps you manage large volumes of information, making it easier to spot patterns and opportunities.
Transitioning to automated reporting comes with its own set of challenges. You may face obstacles such as compliance, cost, and integration. The following table highlights some of the most common issues organizations encounter:
| Challenge Type | Description |
|---|---|
| Compliance and Regulatory Considerations | You must ensure your automated processes align with changing laws and regulations. |
| Cost Implications | Initial investments in software and hardware, plus ongoing maintenance and training, can be significant. |
| Data Integration and Management | Integrating data from different sources, especially legacy systems, can be complex. |
| Software and Technology Selection | Choosing the right reporting software from many options requires careful evaluation. |
| Change Management and Employee Training | Employees may resist new tools, so you need effective training and change management strategies. |
By understanding these challenges, you can plan your automation journey more effectively and select the right tools for your needs.
Choosing the right reporting tools can transform your data reporting process. In 2025, the best solutions combine automation, AI insights, and customizable visualizations to help you automate reports and boost productivity. Here are the top 10 tools you should consider, selected based on user interface, usability, customization, scalability, data sourcing, searchability, and value.
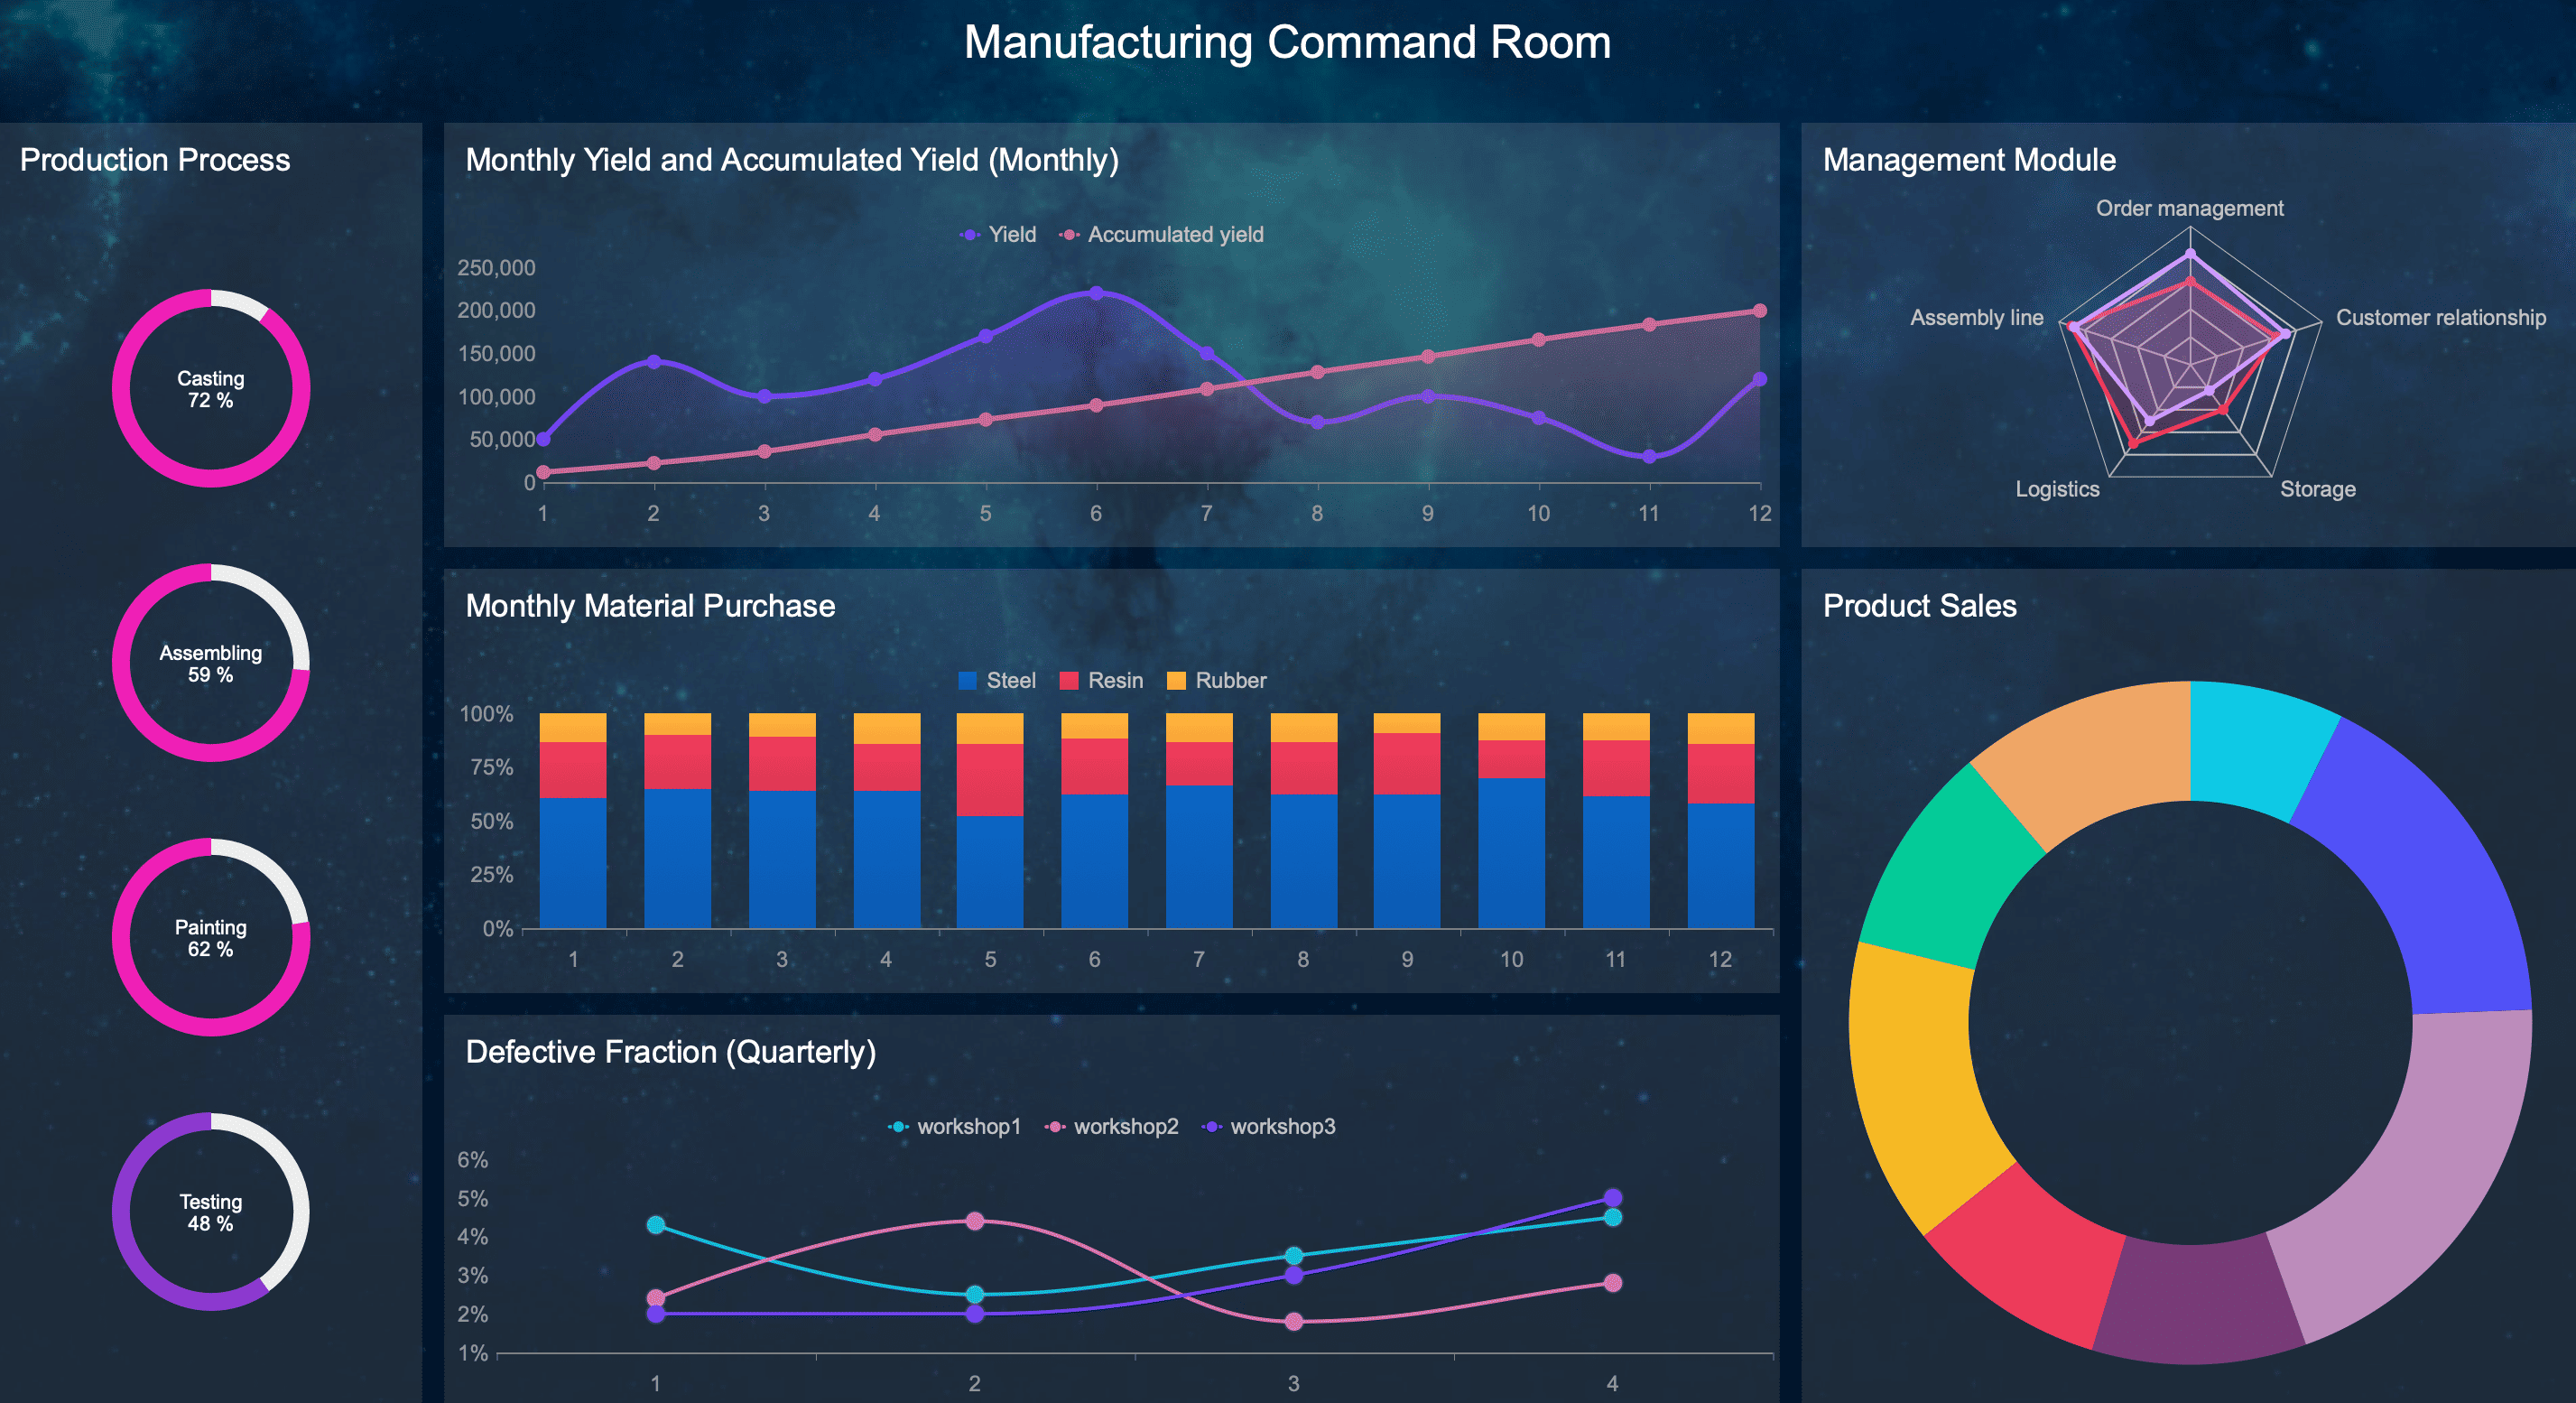
FineReport stands out as a leading enterprise-level reporting software. You can use its intuitive drag-and-drop designer to create pixel-perfect reports and interactive dashboards without coding. FineReport connects to over 500 data sources, making it easy to integrate with your existing systems. You gain advanced dashboards with real-time data, customizable layouts, and robust security features like row-level permissions and single sign-on. Drill-downs, filters, and dynamic text boxes let you explore actionable insights in depth.
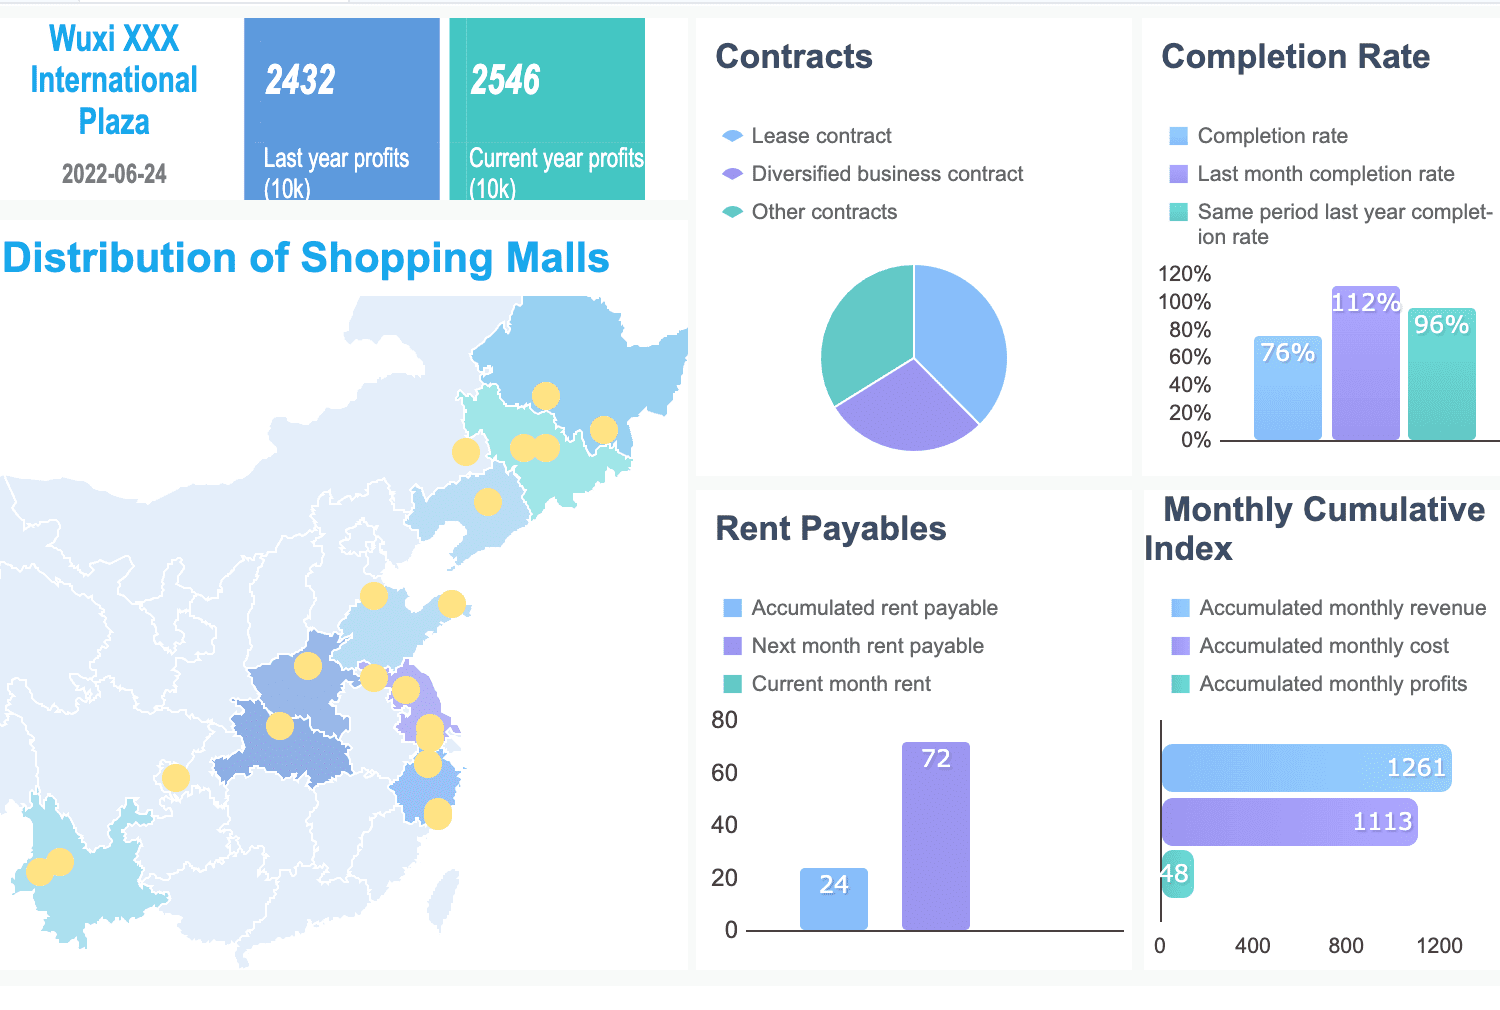
Tip: FineReport’s automated scheduling and distribution features ensure your automated reports reach the right people on time, every time.
| Feature | Description |
|---|---|
| User Interface | Excel-like, drag-and-drop, highly visual |
| Customization | Extensive, supports complex formatting and calculations |
| Automation | Scheduled tasks, automated formatting, and distribution |
| Integration | 500+ data sources, cloud-based and on-premises |
| Security | Row-level security, SSO, permission management |
| Pricing | Custom enterprise pricing; free trial available |
Best for: Enterprises needing scalable, automated, and customizable reporting tools with strong integration and security.
![]()
Microsoft Power BI offers a user-friendly interface with drag-and-drop report creation. You can connect to a wide range of data sources and build interactive dashboards that update in real-time. Power BI integrates seamlessly with Microsoft products like Excel and Teams, making it a natural fit for organizations already using Microsoft software.
| Advantage | Description |
|---|---|
| User-Friendly Interface | Simple drag-and-drop functionality |
| Works Well with Microsoft Tools | Seamless integration with Excel, Azure, and Teams |
| Real-Time Data Access | Dashboards update automatically |
| Frequent Updates | Regular feature enhancements |
| Scalable for Different Needs | Suitable for all business sizes |
| Disadvantage | Description |
|---|---|
| Cost | Advanced features require a paid subscription |
| Takes Time to Learn | Complex features may overwhelm beginners |
| Limited Customization for Visuals | Unique designs can be challenging |
Best for: Teams seeking a cloud-based solution with strong Microsoft integration and real-time data visualization.
![]()
Tableau is known for its powerful visualizations and interactive dashboards. You can create compelling visual stories and automate report refreshes with real-time data connections. Tableau receives high user satisfaction ratings, with 84% of users giving it 4 or 5 stars on G2. While it offers design flexibility, you may find the learning curve steep if you lack a technical background.
Best for: Data analysts and organizations that prioritize advanced data visualization and interactive dashboards.
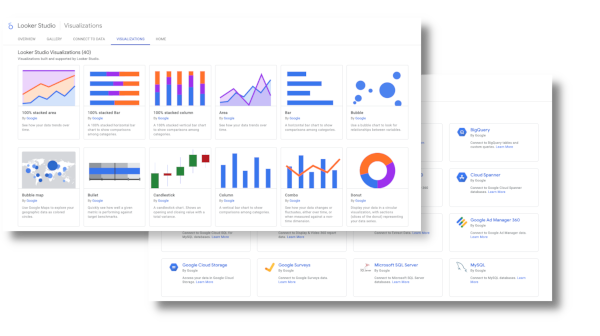
Google Looker Studio (formerly Data Studio) provides a cost-effective way to automate reports and create interactive dashboards. You can use pre-built templates, integrate multiple data sources, and collaborate in real time. The platform is especially popular with small and medium businesses due to its affordability and ease of use.
| Feature | Description |
|---|---|
| Templates | Pre-configured layouts for fast, professional reporting |
| Data Integration | Consolidate data from various sources into one dashboard |
| Customization | Extensive options for tailoring dashboards |
| Collaboration | Real-time editing and shared access |
| Affordability | Free version available; paid plans for advanced features |
Best for: Teams needing affordable, collaborative, and cloud-based reporting tools.
Teamwork.com offers project management with built-in reporting automation. You can generate automated reports on project progress, time tracking, and resource allocation. The platform supports customizable dashboards and integrates with popular business tools.
Best for: Project managers who want to automate reports and monitor team productivity.
Lindy leverages AI reporting tools to automate complex business tasks. You can create custom AI assistants that handle report automation, integrate with over 3,000 business tools, and collaborate through AI teams. Lindy offers flexible pricing, including a free plan for basic needs.
| Plan | Pricing | Key Features |
|---|---|---|
| Free | $0/month | 400 credits, 1M character knowledge base |
| Pro | $49.99/month | 5,000+ credits, premium actions |
| Business | $299.99/month | 30,000+ credits, priority support |
Best for: Businesses seeking the best AI reporting tools for automating repetitive tasks and integrating with a wide range of platforms.
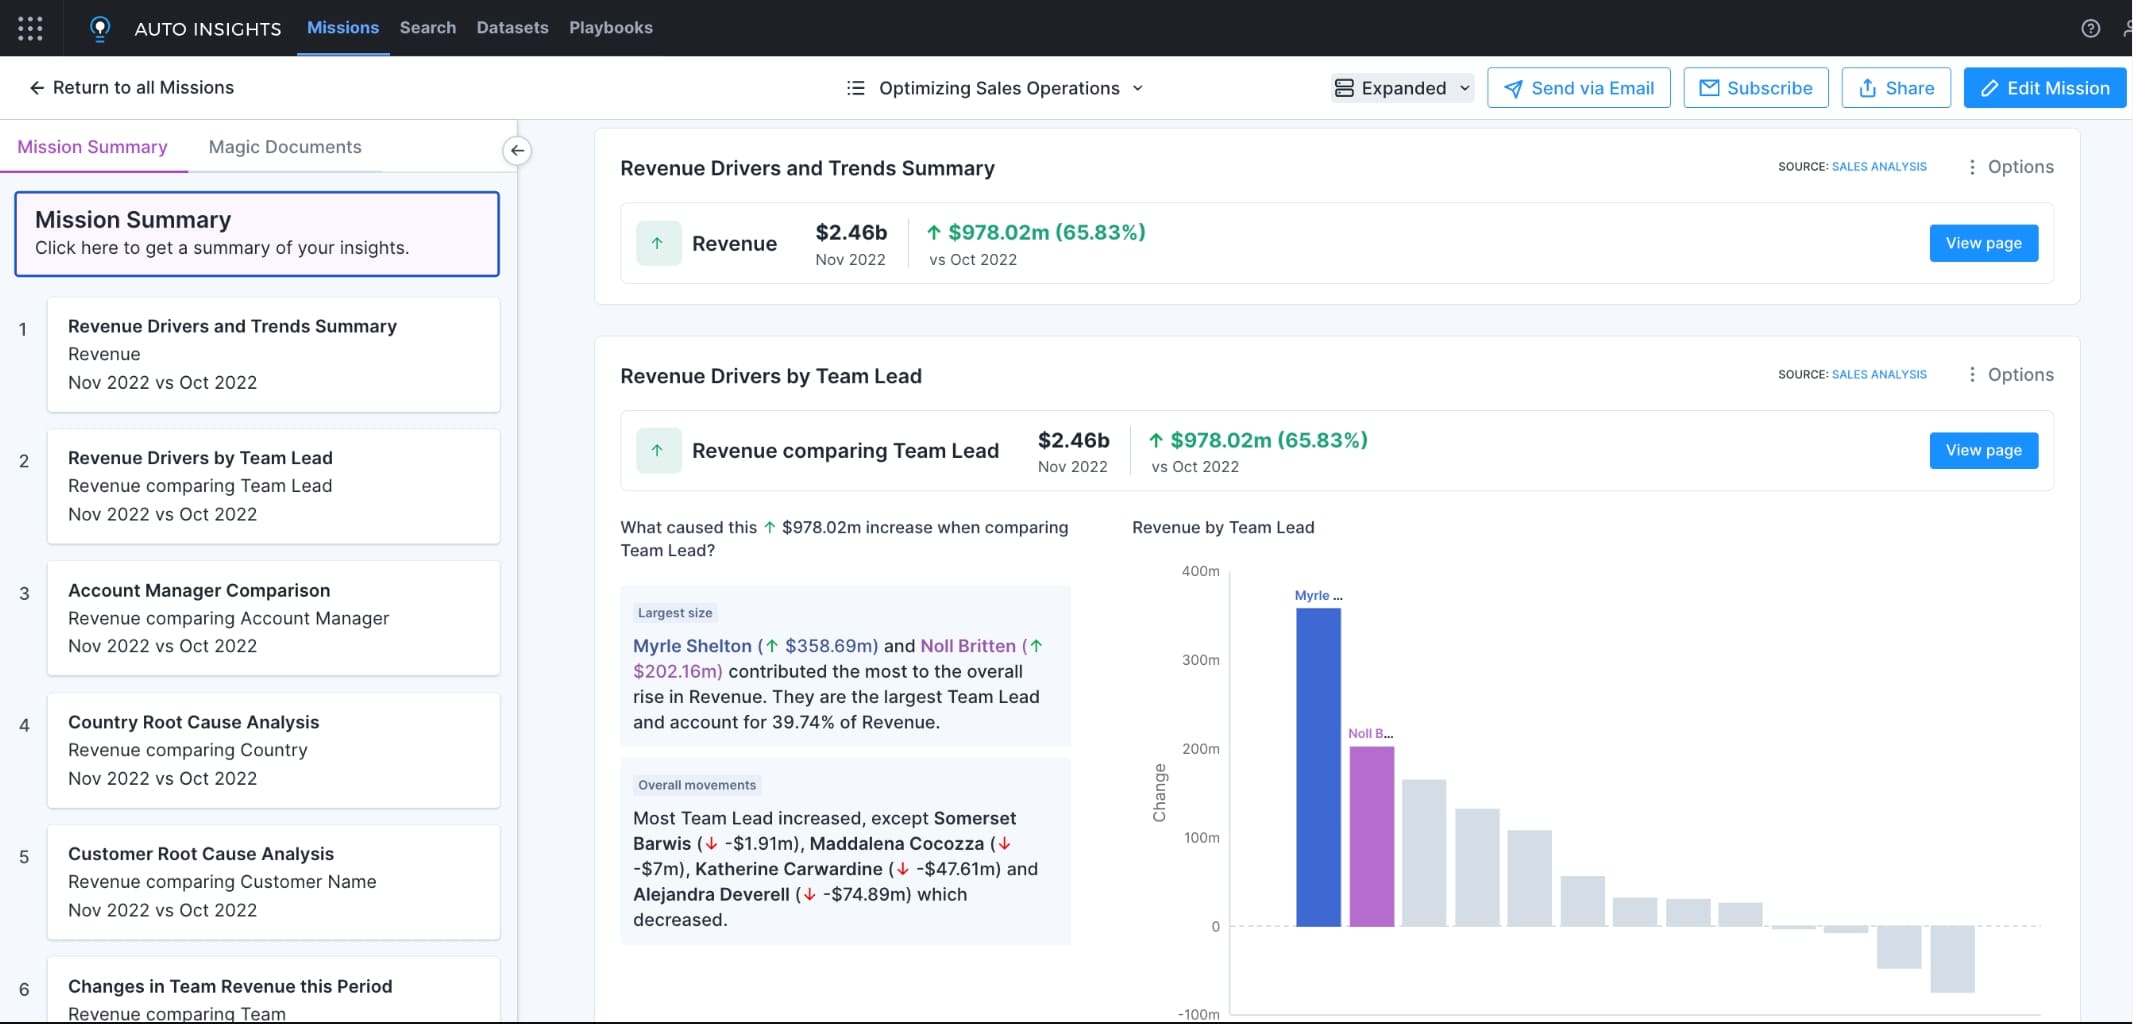
AI report generators use artificial intelligence to deliver automated reports with actionable insights. You can ask questions in natural language, receive predictive analytics, and get real-time reporting as data flows in. These tools reduce the time needed for data collection and analysis, making them ideal for fast-paced environments.
| Functionality | Benefit |
|---|---|
| Automated insights | Faster, more effective data analysis and decision-making |
| Natural language querying | Easy exploration for non-technical users |
| Predictive analytics | Quick response to data changes |
| Real-time reporting | Immediate insights for timely decisions |
Best for: Teams that want to leverage AI insights and automate the data reporting process for faster results.
Alteryx is an industry-leading platform for data preparation, blending, and advanced analytics. You can automate complex workflows and generate reports with minimal manual intervention. Alteryx boasts high customer satisfaction and a robust partner ecosystem, though it has a steep learning curve.
| Strengths | Weaknesses |
|---|---|
| Industry-leading platform | Limited international presence |
| Strong customer base | Dependence on third-party data |
| High satisfaction | Steep learning curve |
Best for: Data professionals who need powerful automation and analytics capabilities in their reporting tools.
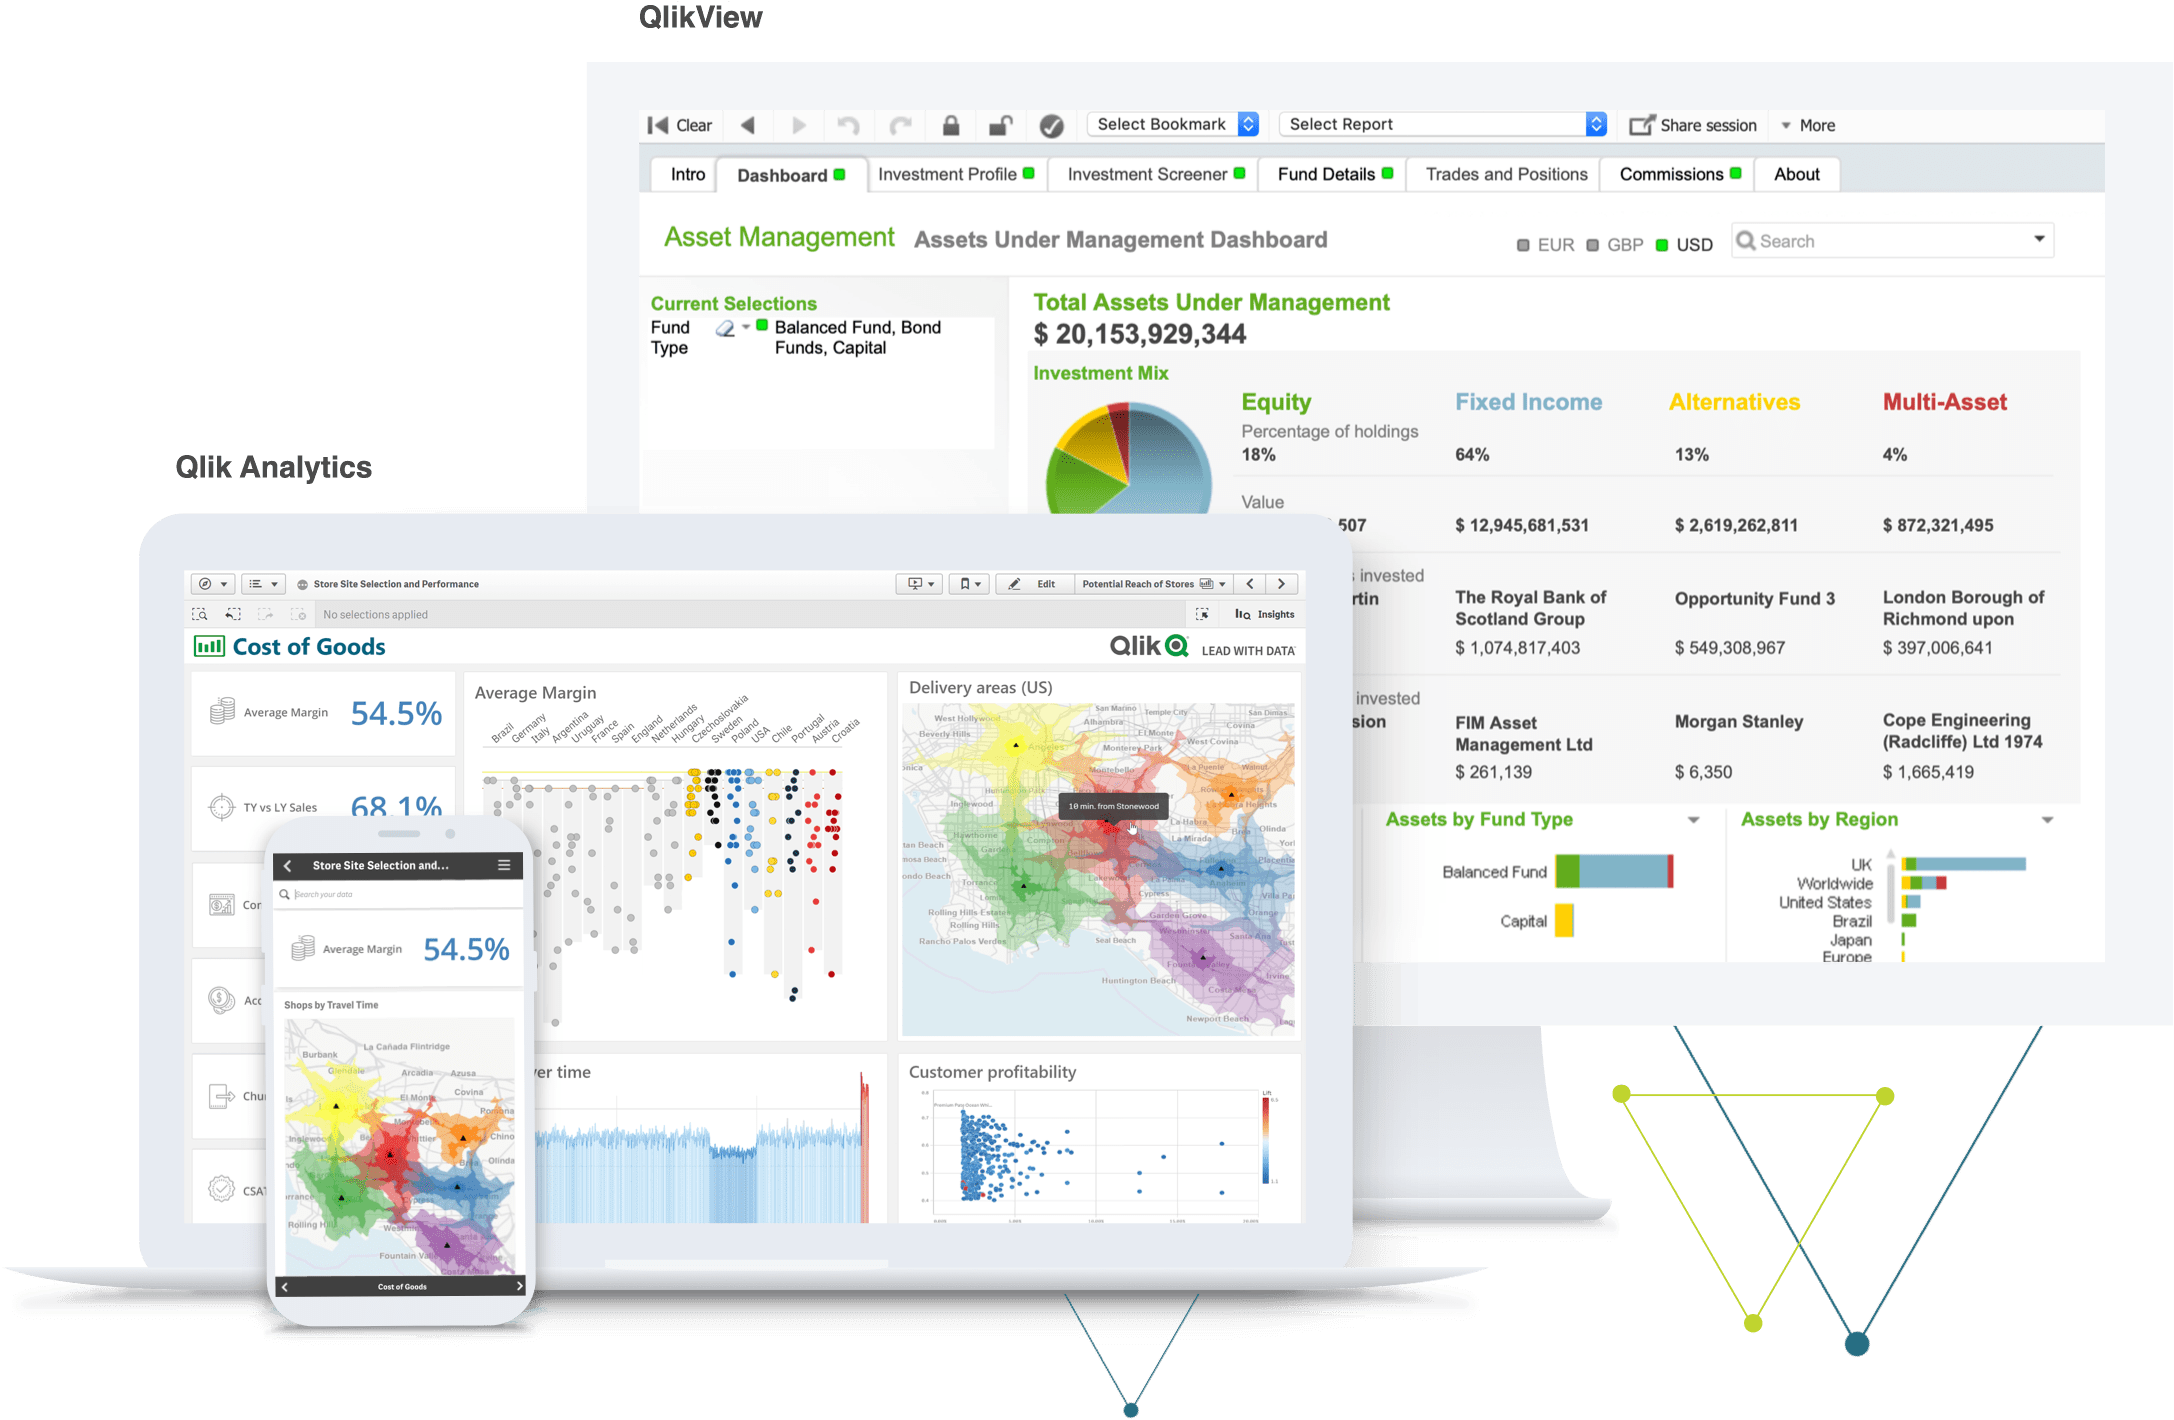
Qlik Sense empowers you to create automated, self-service reports with advanced analytics. You can connect to multiple data sources, build interactive visualizations, and distribute reports without relying on IT. Qlik Sense serves industries like finance, healthcare, retail, and manufacturing.
| Feature | Description |
|---|---|
| Self-Service Capabilities | Create and distribute reports independently |
| Advanced Analytics | Robust data visualization and real-time insights |
| Interactive Visualizations | Instant updates for every chart and table |
Best for: Organizations that value self-service, real-time data, and interactive dashboards across various industries.
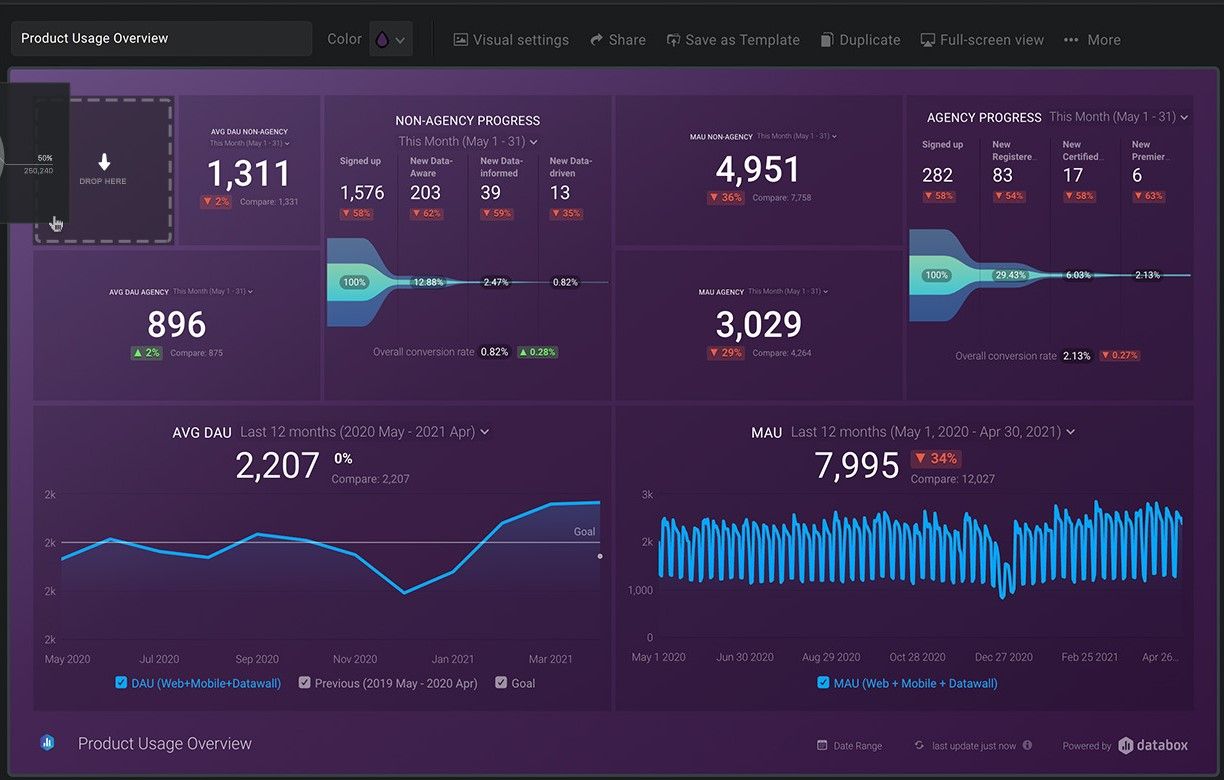
Databox is a cloud-based platform that helps you automate reports and monitor performance metrics. You can integrate with popular tools like Google Sheets, HubSpot, Salesforce, and more. Databox lets you clean, merge, and structure raw data, build interactive dashboards, and share updates automatically.
| Category | Examples/Capabilities |
|---|---|
| Integrations | Google Sheets, Excel, HubSpot, Salesforce, Mailchimp, Zendesk, and more |
| Capabilities | Clean/merge data, build dashboards, share updates, analyze trends |
Best for: Businesses that want a simple, cloud-based solution for automated reporting and performance tracking.
Note: When you select reporting tools, focus on user interface, usability, customization, scalability, integration, searchability, and value. The best ai reporting tools and ai report generators now offer real-time data visualization, automated formatting, and actionable insights that drive smarter decisions.
You now have access to the best ai reporting tools that transform how you automate reports and gain ai insights. These tools use advanced automation to reduce manual work and deliver actionable insights faster than ever. You can expect features like real-time data integration, natural language queries, and predictive analytics. Many ai report generators now offer smart data preparation and dynamic dashboard recommendations, making it easy for you to create automated reports with just a few clicks.
Some of the most innovative ai reporting tools in 2025 include:
You benefit from features like governance and compliance automation, which help you manage access and version control. Real-time data connections ensure your reports always reflect the latest information. Specialized ai report generators such as Gamma and Tome expand your options for different reporting needs.
You can use the best ai reporting tools across many business scenarios. For example, you might automate reports for sales performance, financial analysis, or project management. AI report generator platforms help you create real-time dashboards that update automatically, so you always see the most current data. You can ask questions in plain language and receive instant ai insights, even if you do not have a technical background.
Teams often use ai report generators to track KPIs, monitor operations, and share automated reporting with stakeholders. You can also use these tools to identify trends, detect anomalies, and forecast future outcomes. Real-time data integration supports fast decision-making and keeps your team aligned. With these tools, you unlock the full potential of automation and ai insights for your business.
You can maximize the impact of your automated reports by choosing the right distribution methods. Modern reporting software gives you flexible scheduling options, so you decide when and how reports reach your stakeholders. You might schedule reports to run in real-time, hourly, daily, weekly, or monthly. Some tools even let you trigger report generation based on specific events or data thresholds, which increases responsiveness and ensures timely delivery.
| Feature | Description |
|---|---|
| Flexible Scheduling | Set reports to run in real-time, hourly, daily, weekly, or monthly. |
| Trigger-based Automation | Generate reports when certain events or data thresholds occur. |
| Delivery Options | Send reports via email, dashboards, or messaging platforms. |
You can distribute reports through multiple channels. Email remains a popular choice, but cloud-based dashboards and messaging platforms like Slack or Teams offer instant access and collaboration. Automated report sharing ensures that everyone receives the right information at the right time. When you use customizable scheduling, you tailor delivery to match each stakeholder’s needs.
Modern reporting software also addresses common challenges in report distribution. You can centralize data in a secure hub, clean and validate information, and set up role-based access controls. This approach balances standardization with personalization, so each recipient gets relevant insights while maintaining security and compliance.
Notifications play a key role in keeping your team informed about new or updated reports. Leading reporting software provides a range of notification triggers and delivery formats. You can set alerts for specific metrics, such as campaign ROI changes, ad performance, or social engagement. Notifications can arrive as email dashboards, real-time SMS, or PDF reports.
| Metric Type | Notification Trigger | Delivery Format |
|---|---|---|
| Campaign ROI | Weekly + 15% change | Email dashboard |
| Ad Performance | Daily spend alerts | Real-time SMS |
| Social Engagement | Bi-weekly summaries | PDF report |
You can also set up alerts for operational events, like inventory dropping below a certain level or sales comparisons to previous periods. Automated notifications help you respond quickly to important changes. With customizable settings, you decide who receives which alerts and how often. This level of automation ensures that your team stays proactive and never misses critical updates.
Tip: Use real-time notifications to drive faster decision-making and keep your business agile.
Selecting the right reporting software shapes your team’s productivity and data-driven decision-making. You want a solution that grows with your business and supports your goals. Consider the following criteria when you compare options:
| Criteria | Description |
|---|---|
| Scalability | The software must adapt as your organization grows, adding new functions while maintaining performance. |
| Safety | Security is crucial, especially for sensitive data; choose a reliable publisher with strict protocols. |
| Functional scope | The tool should cover all user requirements and provide essential features like data analysis and visualization. |
| Performance | Must manage large data volumes efficiently and provide timely updates and reports. |
| Ease of use | A user-friendly interface is essential for quick adoption by all team members. |
| Customisation | Allows for tailored reports and collaborative features for team interaction. |
| Speed of deployment | The tool should be easy to set up and integrate with existing applications for immediate use. |
FineReport by FanRuan stands out for enterprises that need robust automation, advanced security, and flexible customization. You can deploy it quickly and scale as your needs change.
Your reporting software should connect seamlessly with your existing business platforms. Integration with ERP, CRM, and other systems unlocks new value:
You gain improved data accuracy, reduced manual entry, and automated workflows. FineReport supports integration with over 500 data sources, making it ideal for organizations with complex data environments.
Budget plays a key role in your decision. Look for software that delivers value without hidden costs. Consider licensing, support, and future scalability. FineReport offers flexible pricing for enterprises, so you can match features to your budget. Automated reporting reduces manual labor, saving costs over time. Investing in the right tools ensures you maximize ROI and support your team’s growth.
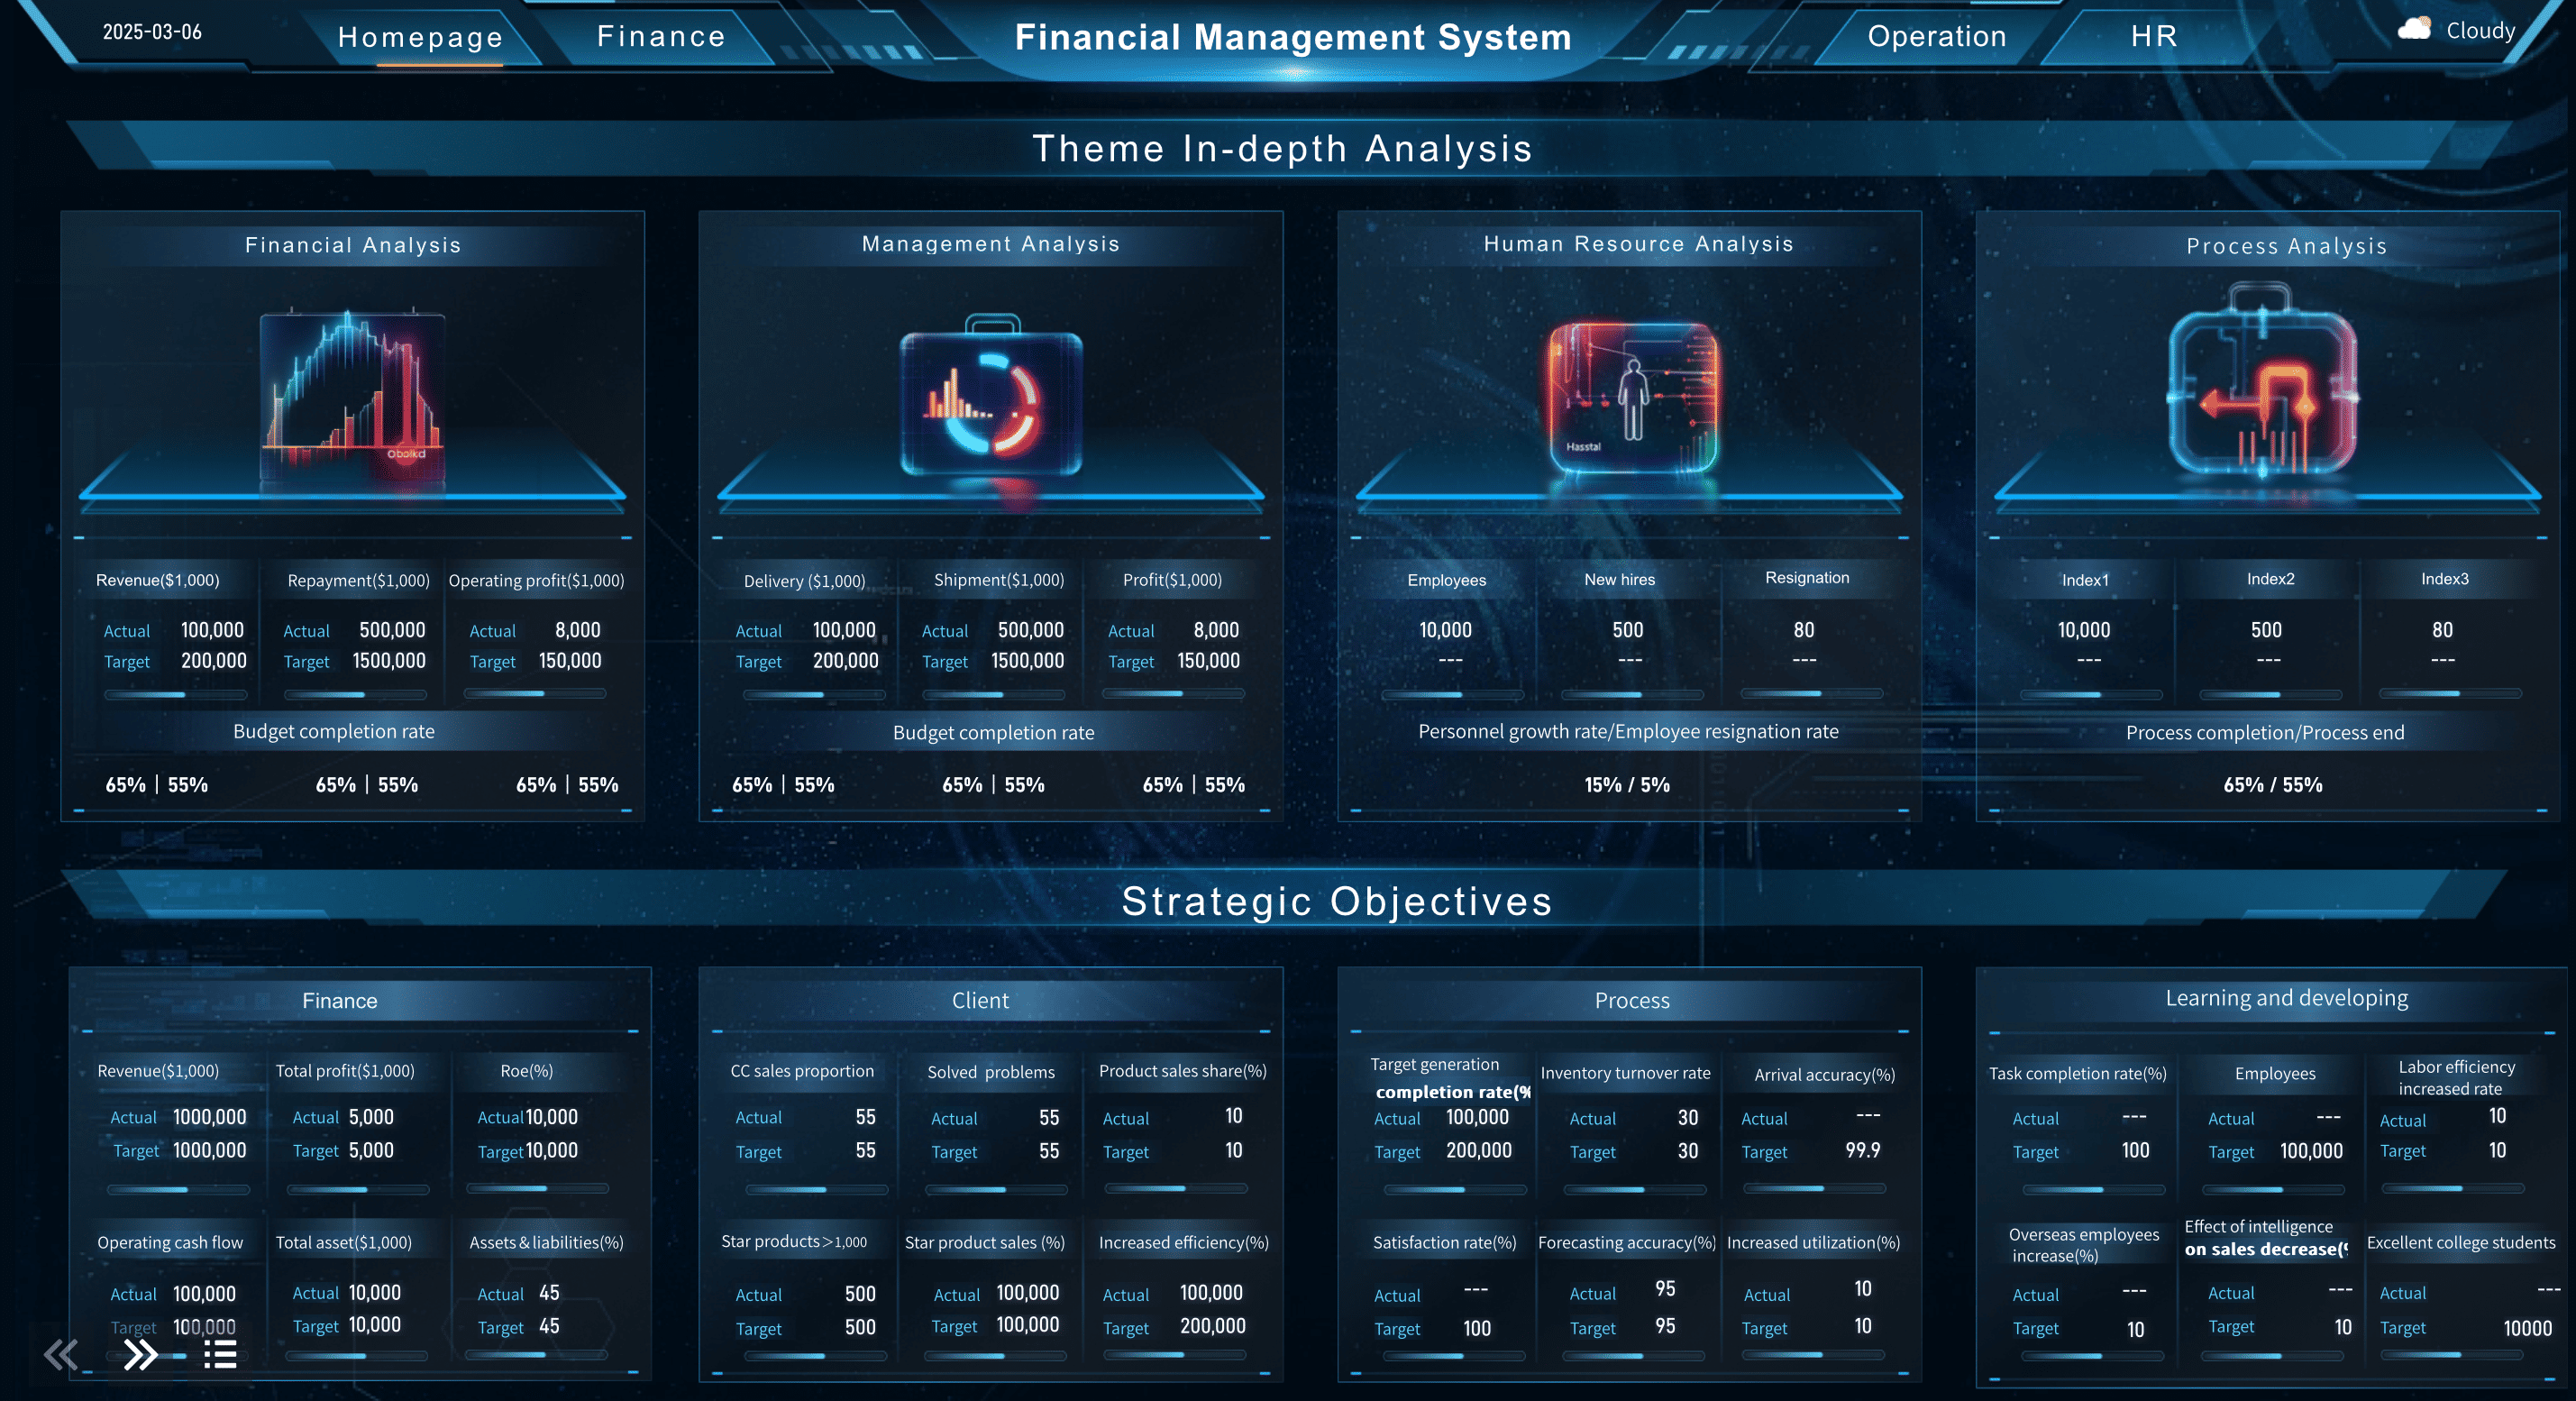
You face unique challenges in financial management, from ensuring compliance to delivering timely insights. Automated reporting tools help you overcome these hurdles by streamlining your processes and reducing manual errors. You gain immediate access to accurate data, which supports faster and more informed decision-making.
Here is how automated reporting tools address your financial management needs:
| Feature | Benefit |
|---|---|
| Real-time data integration | Provides immediate access to accurate data, enabling timely decision-making. |
| Pre-built templates | Ensures accuracy and compliance in financial reports without manual formatting. |
| Customizable dashboards | Allows teams to highlight relevant metrics and KPIs, facilitating clear data visualization. |
| Scalability | Adapts to growing data volumes and reporting needs, supporting business expansion. |
You can streamline financial processes, enhance decision-making, and reduce manual errors. These tools also provide scalable reporting, so your system grows with your business. With customizable dashboards, you highlight the metrics that matter most to your team. Real-time data integration ensures you always work with the latest information, which is essential for compliance and strategic planning.
Tip: Use automation to eliminate repetitive tasks and focus on analysis that drives business growth.
In manufacturing, you need reliable data to optimize operations and maintain efficiency. Automated reporting tools support a wide range of use cases that help you manage complex workflows and improve productivity.
| Use Case | Description |
|---|---|
| Data Gathering & Posting | Automates the collection of actual and forecast data on energy production and consumption, integrating market data. |
| Financial Reporting | Streamlines data collection from legacy systems for financial reporting, reducing manual errors and improving productivity. |
| Transaction Posting | Automates the posting of transactions in ERP systems, reducing errors from manual processing of unstructured data. |
| Inventory Auditing | Automates inventory checks, reconciliations, and reporting, enhancing oversight and data quality. |
| Procurement Process | Automates the entire procurement workflow, from sourcing to invoicing, minimizing human intervention. |
| Freight Payment | Streamlines the paperwork and processes involved in freight payments, ensuring timely and accurate transactions. |
| Fuel Updation | Automates fuel procurement processes, integrating data from various sources for efficiency. |
| Procure-To-Pay | Automates the procure-to-pay process, improving compliance, reducing costs, and enhancing productivity. |
| Price Comparison | Automates the comparison of prices across suppliers to ensure the best deals and reduce duplication. |
You benefit from automation in every step, from data gathering to transaction posting. Automated inventory auditing and procurement processes help you maintain accuracy and reduce costs. You can also automate price comparisons and freight payments, which ensures you always get the best value and timely transactions. These solutions let you focus on continuous improvement and operational excellence.
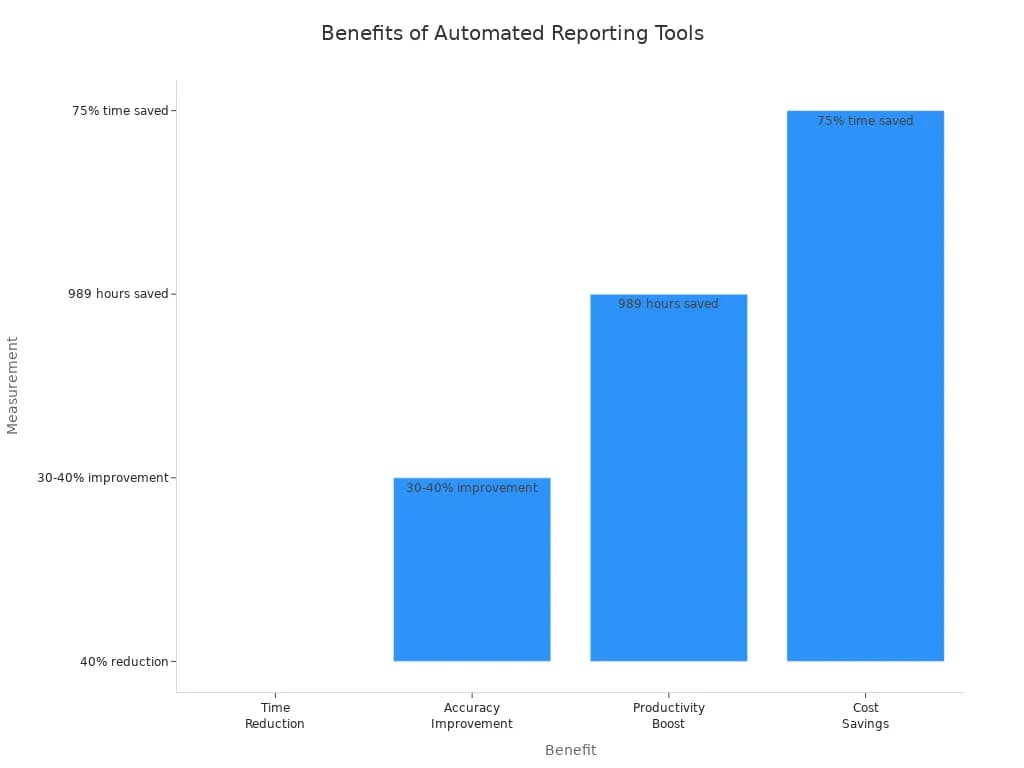
Automating your reports delivers measurable gains. You save time, boost accuracy, and increase productivity. The table below highlights real-world results:
| Benefit | Measurement |
|---|---|
| Time Reduction | Up to 40% less reporting time |
| Accuracy Improvement | 30-40% better financial forecasting |
| Productivity Boost | 989 hours saved in four weeks (Noventiq) |
| Cost Savings | 75% time saved in job posting (PageGroup) |
To find the right solution, follow these steps:
You can start with a free trial of leading tools or explore FineReport for advanced automation and integration. Take action now to transform your reporting process and drive better business outcomes.
Click the banner below to try FineReport for free and empower your enterprise to transform data into productivity!


The Author
Lewis
Senior Data Analyst at FanRuan
Related Articles

10 Best Dashboard Reporting Tools for 2026 Compared: Power BI, Tableau, Looker Studio, and More
Dashboard reporting tools are software platforms that turn business data into interactive dashboards, scheduled reports, and decision ready insights.
Lewis Chou
Apr 27, 2026
How to create an HTML report from scratch in 2026
Build an html report from scratch in 2026 with easy steps, tools, and tips for customization, sharing, and making your data clear and interactive.
Lewis Chou
Mar 23, 2026
What Are the Main Types of Financial Statements and Their Examples
See the main types of financial statements with examples: balance sheet, income statement, cash flow, and equity statement.
Lewis Chou
Mar 23, 2026


