An analytics dashboard plays a crucial role in helping you make data-driven decisions. It presents real-time data in a clear and logical format, allowing you to assess your business efficiency. With an analytics dashboard, you can easily track performance metrics and identify areas for improvement. This tool becomes indispensable as it helps you maintain a competitive edge by optimizing processes. FineBI offers powerful solutions to create effective dashboards. By adopting a systematic approach to dashboard creation, you ensure that your data insights are both actionable and impactful.
Every dashboard here was built with FineBI—your gateway to smarter, faster analytics.
Start your free trial and see what self-service BI can do for you.
Creating an effective analytics dashboard starts with defining its purpose and audience. You need to know why you're building the dashboard and who will use it. This clarity ensures that your dashboard delivers the right insights to the right people.
First, pinpoint the key objectives of your analytics dashboard. Ask yourself what you want to achieve with it. Do you aim to track sales performance, monitor website traffic, or analyze customer behavior? Each objective requires different data and visualizations. By clearly identifying these goals, you can tailor your dashboard to meet specific needs.
Consider this: A dashboard designed to track sales performance might focus on metrics like revenue, conversion rates, and customer acquisition costs. On the other hand, a dashboard for monitoring website traffic would highlight page views, bounce rates, and user demographics. Knowing your objectives helps you choose the right data and visual elements.
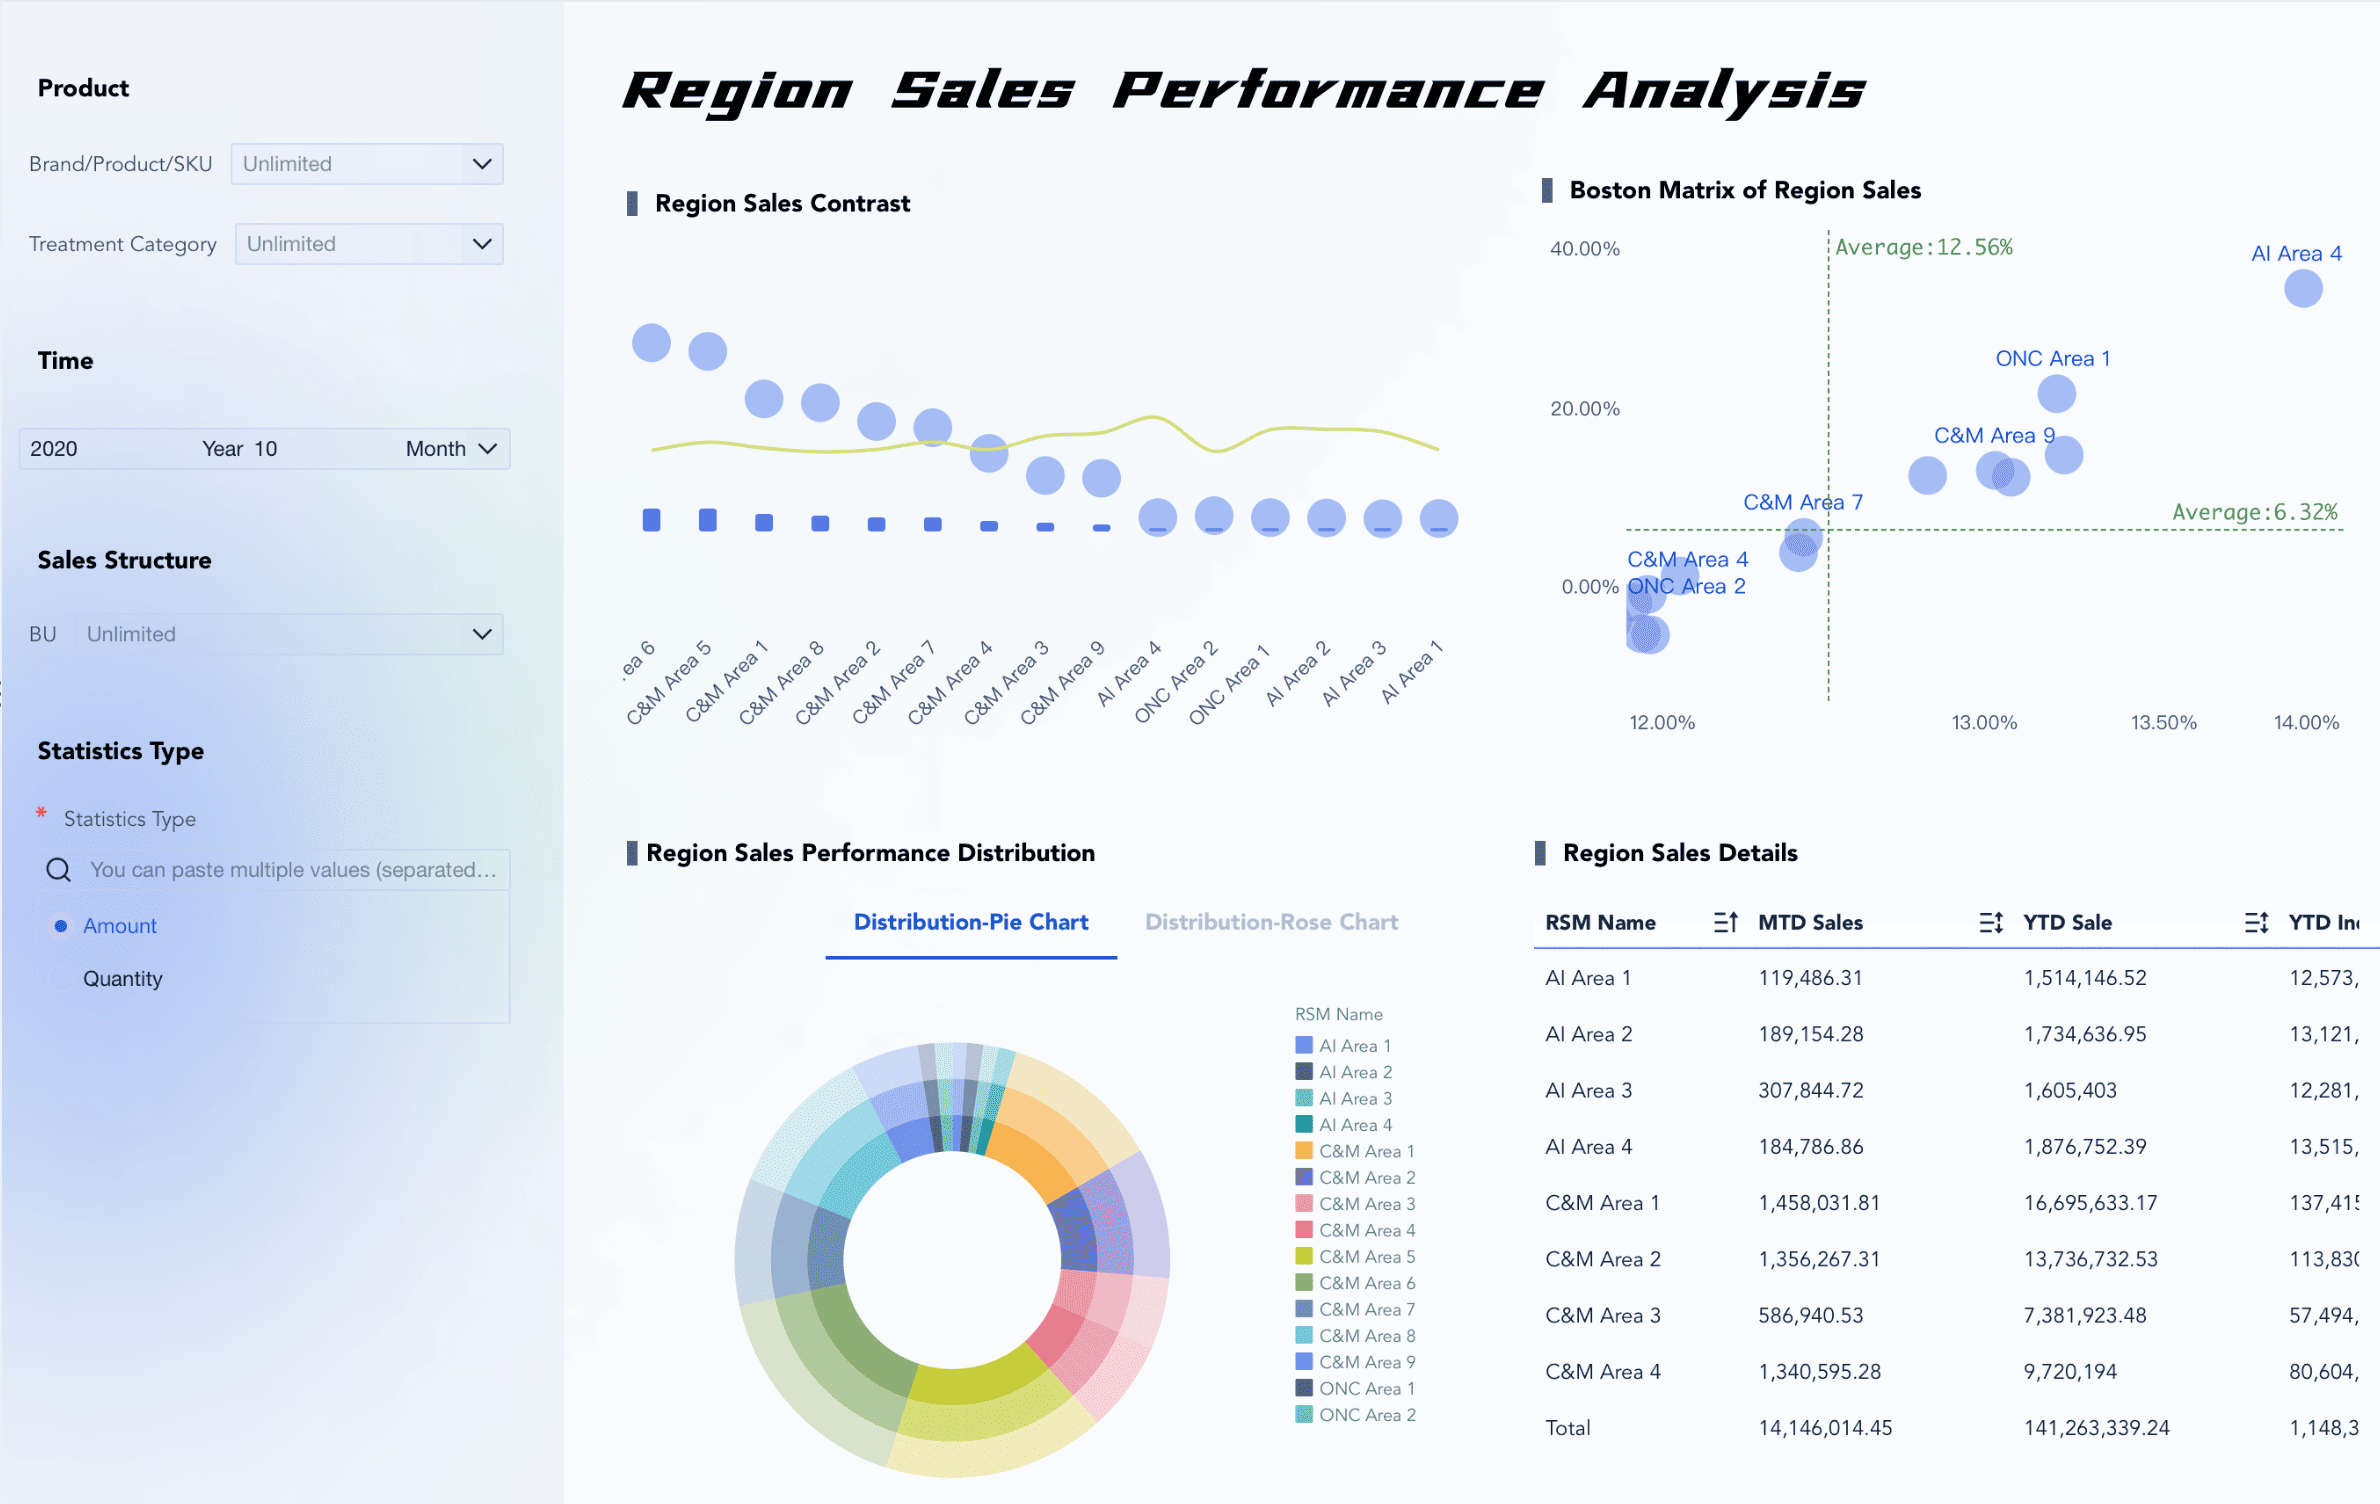
Next, understand who will use the dashboard. Different users have different needs and levels of expertise. A dashboard for executives might present high-level summaries and key performance indicators (KPIs). In contrast, a dashboard for data analysts could offer detailed data and advanced filtering options.
Just as a great data visualization combines valuable information with a user experience that encourages consumption, an effective dashboard brings together data and subject matter experts who have collaborated to realize a solution that works for both – and most importantly, for the end-user." - Data Leadership Collaborative
This quote emphasizes the importance of considering the end-user when designing your dashboard. Collaborate with subject matter experts to ensure that the dashboard meets the needs of its intended audience. By doing so, you create a tool that not only provides valuable insights but also encourages user engagement.
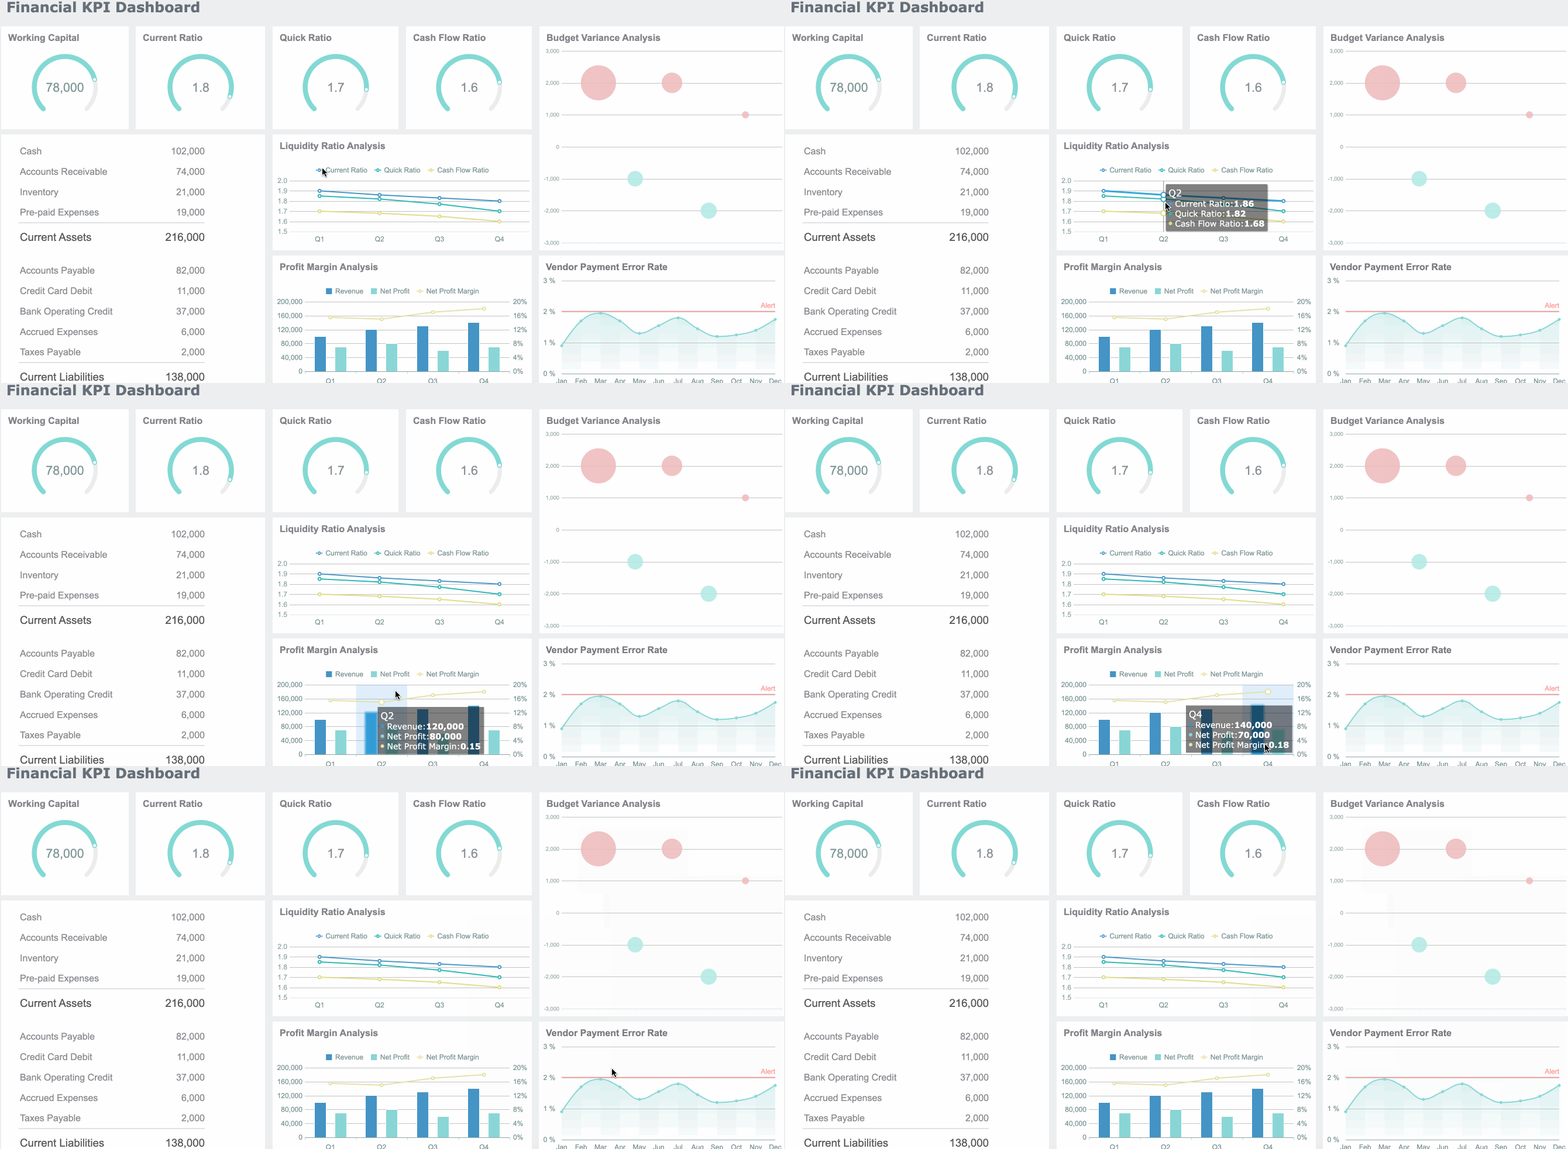
Choosing the right data is crucial for crafting an effective analytics dashboard. You need to ensure that the data you select aligns with your objectives and meets the needs of your audience. Let's dive into how you can determine the best data sources and maintain data quality.
First, identify the data sources that will feed into your dashboard. You want to include data that is both relevant and important to your objectives. Consider using a tool like FineBI, which easily integrates with various data sources. This integration ensures that you capture all necessary information without missing key insights.
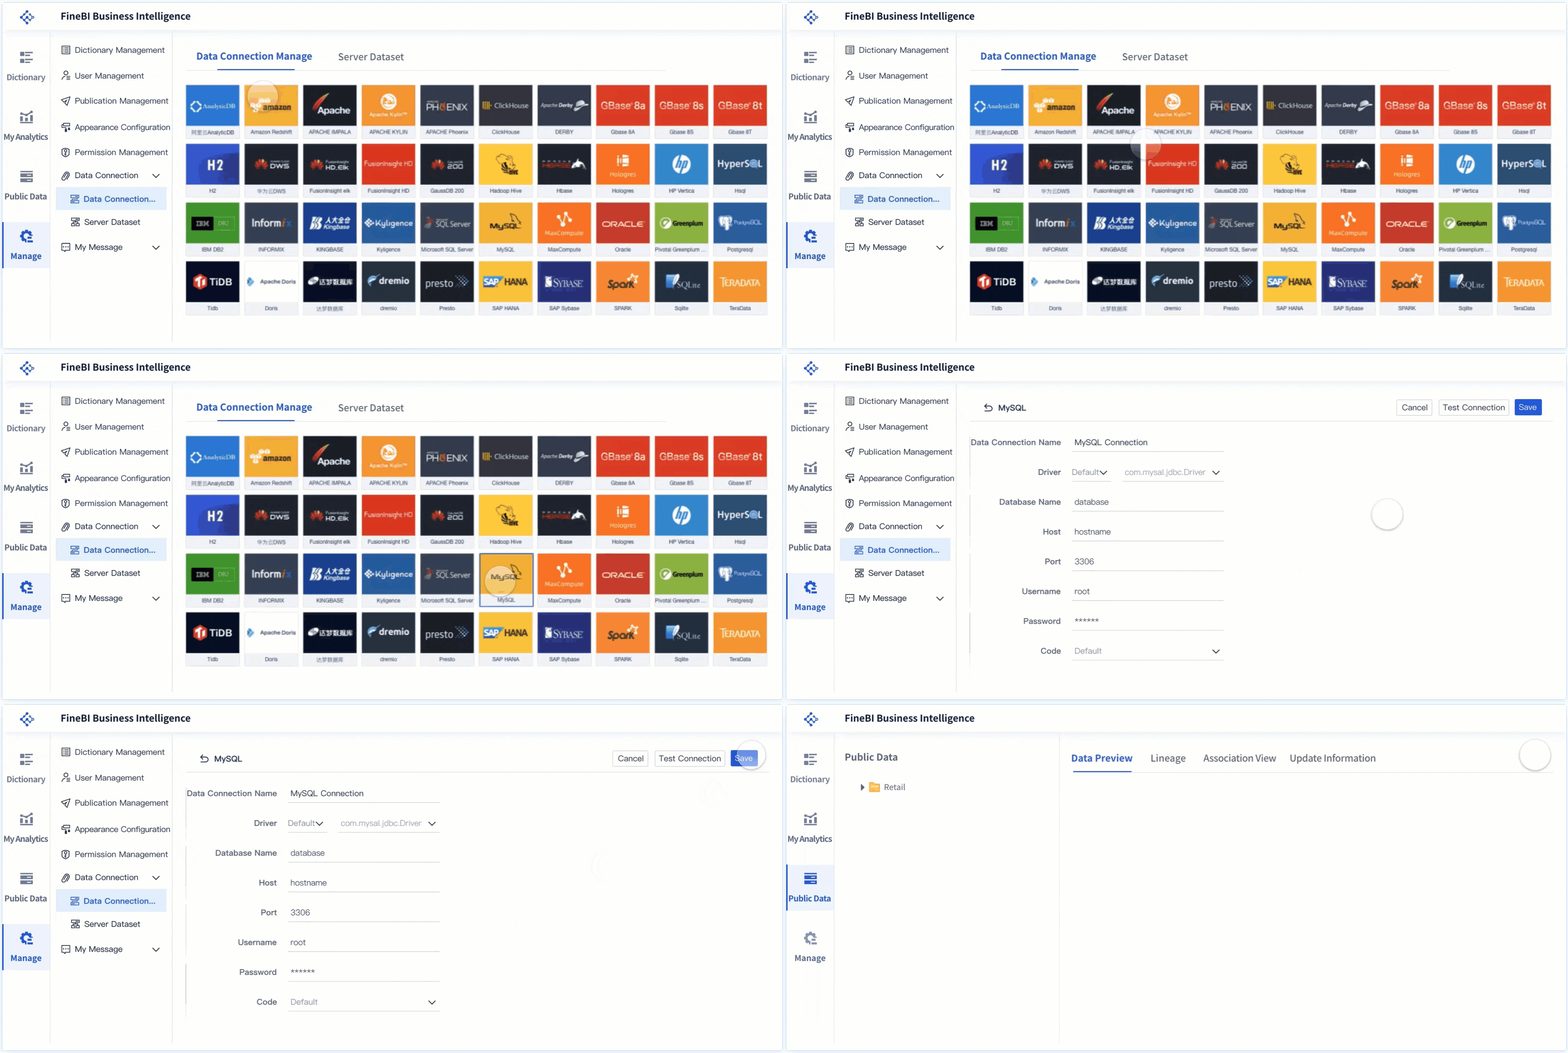
Amplitude emphasizes the importance of integrating data sources into the dashboard to ensure important and relevant data is included.
This quote highlights the necessity of integrating data sources effectively. By doing so, you ensure that your dashboard remains comprehensive and insightful.
Once you've determined your data sources, focus on maintaining data quality and consistency. High-quality data leads to accurate insights, while poor data can mislead users and result in poor decision-making.
“Infomineo highlights the importance of data accuracy and reliability in analytics dashboards.“
This insight underscores the critical role of data quality. By prioritizing accuracy and consistency, you create a dashboard that users can trust and rely on for decision-making.
By carefully selecting and preparing your data, you lay the foundation for a powerful analytics dashboard. This preparation ensures that your dashboard delivers actionable insights and supports informed decision-making.
Designing an analytics dashboard involves more than just placing data on a screen. You need to create a visual story that guides users through the information. This section will help you choose the right visual elements and focus on user-friendliness, ensuring your dashboard is both effective and engaging.
Selecting the right visual elements is crucial for making your dashboard informative and appealing. You want to transform complex datasets into clear, interactive visualizations. FineVis excels in this area by offering over 60 chart types and dynamic 3D visualizations. These tools help you present data in a way that is easy to understand and visually engaging.
“Interactive dashboards empower researchers with real-time exploration, enhanced communication, and data-driven decision-making.” - Falcon Editing Blog
This insight emphasizes the power of interactive elements in transforming raw data into actionable insights. By using FineVis, you can create dashboards that not only inform but also engage users.
A user-friendly dashboard ensures that users can easily navigate and interpret the data. You want your dashboard to be intuitive, allowing users to find the information they need without frustration.
Simplify Navigation: Organize your dashboard logically. Group related data together and use clear labels. FineVis's customizable dashboards make it easy to create a layout that suits your audience.
Ensure Accessibility: Make sure your dashboard is accessible on various devices. FineVis offers adaptive design, ensuring seamless access across smartphones, tablets, and PCs.
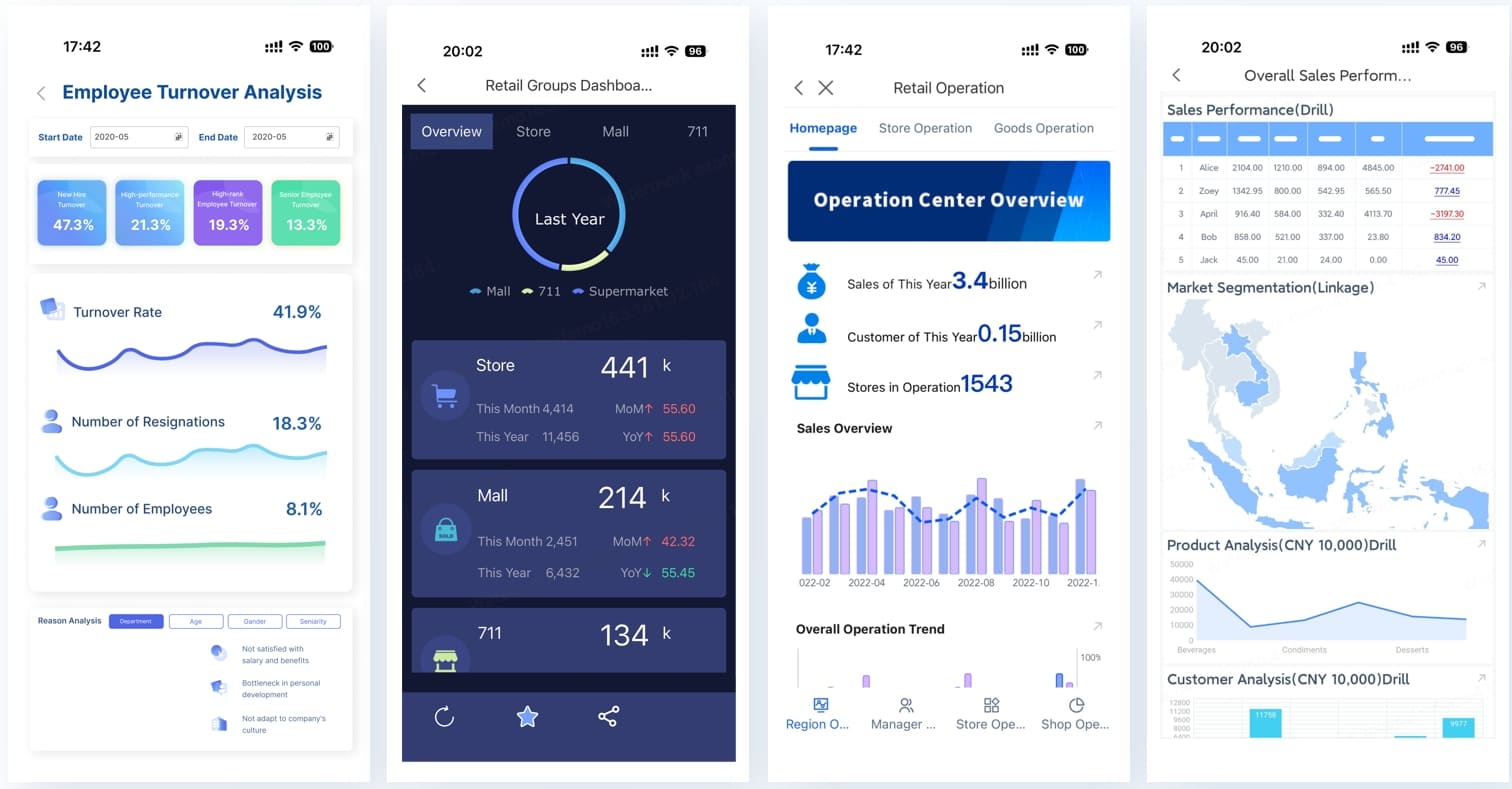
Provide Customization Options: Allow users to customize their view. This personalization enhances user experience and engagement. FineVis's drag-and-drop interface enables users to tailor the dashboard to their preferences.
"Analytics dashboards simplify complex datasets, enhance data-driven decision-making, uncover market trends, and track performance metrics." - Infomineo
This quote highlights the importance of user-centric design in making data accessible and actionable. By focusing on user-friendliness, you create a dashboard that supports informed decision-making and encourages user interaction.
By carefully designing and visualizing your analytics dashboard, you create a tool that not only presents data but also tells a compelling story. FineVis provides the features and flexibility needed to craft a dashboard that is both informative and engaging, ensuring that your data insights are impactful and valuable.
Creating an effective analytics dashboard involves selecting the right tools and utilizing templates and frameworks. With FanRuan's suite of products, including FineBI, you can streamline this process and ensure your dashboard meets your business needs.
Choosing the right tools is crucial for building a successful analytics dashboard. You want software that is user-friendly, flexible, and capable of handling your data requirements. FineBI stands out as an excellent choice for several reasons:
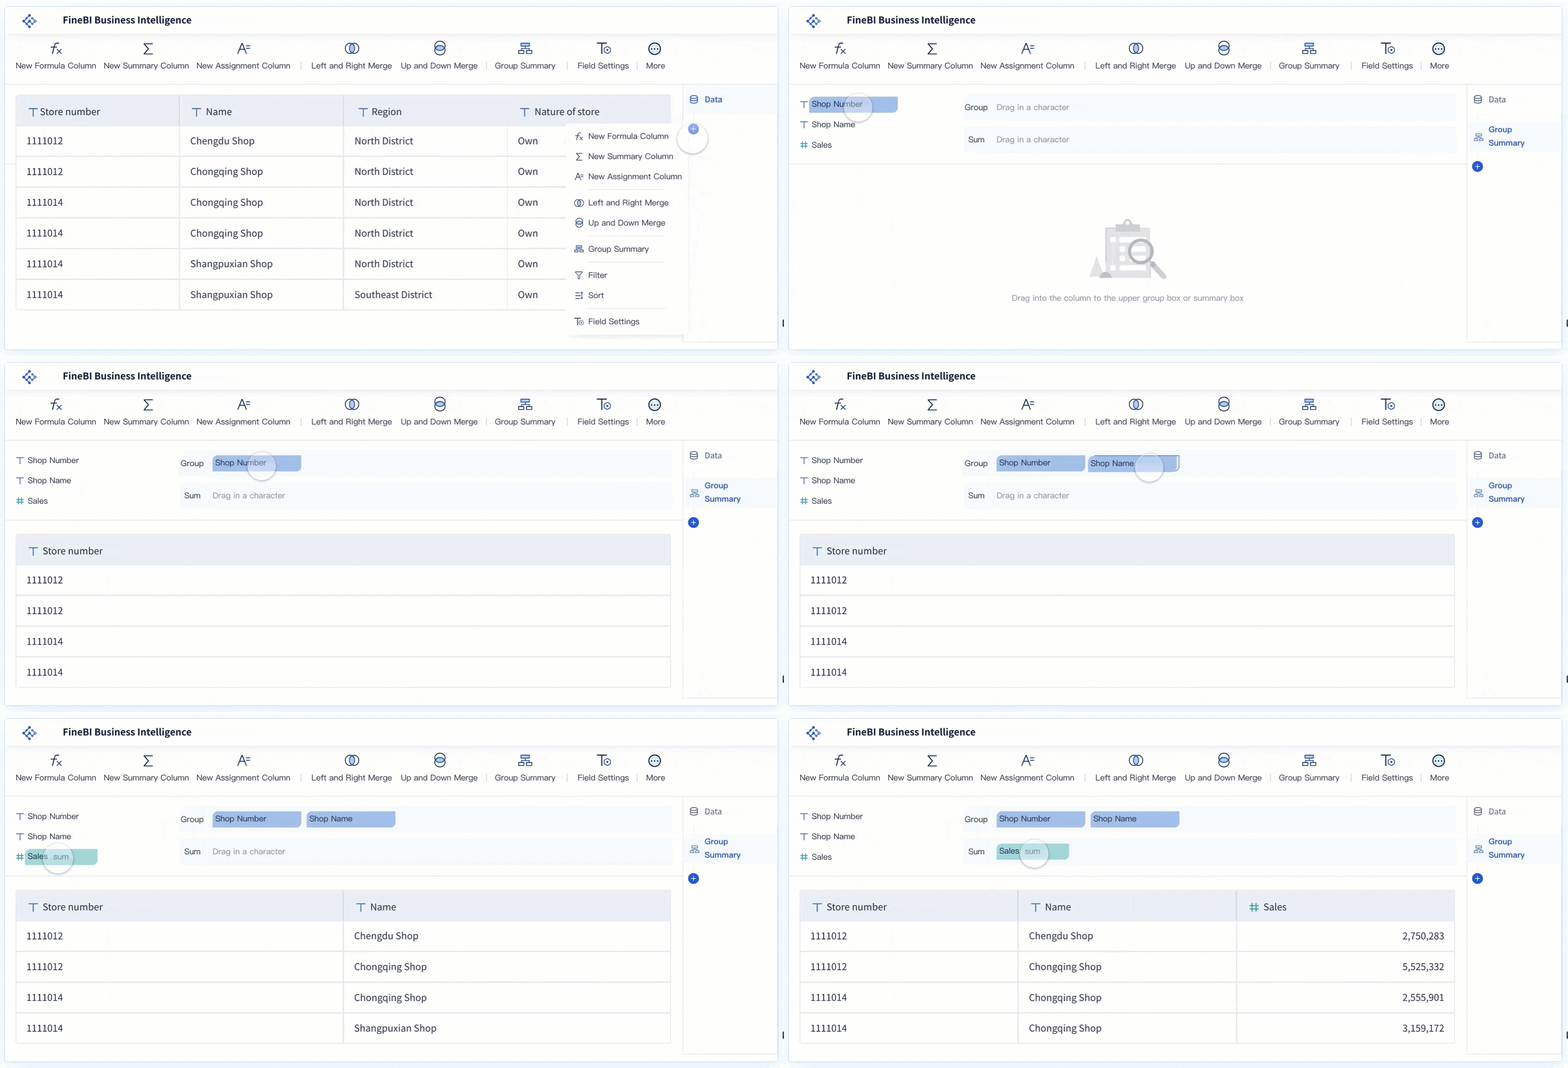

"Modern business intelligence software is flexible enough to allow customization and accommodate best practices."This quote highlights the importance of choosing software like FineBI that adapts to your unique business requirements. By selecting the right tools, you lay a strong foundation for your analytics dashboard.
Once you've chosen your tools, the next step is to utilize templates and frameworks. These resources can significantly speed up the dashboard creation process and ensure consistency in design and functionality.
"Interactive dashboards are transforming the research landscape by offering real-time exploration, customization, multi-dimensional insights, user-centric design, and effective communication."
This insight underscores the value of using templates and frameworks to create dashboards that are both functional and engaging. By leveraging these resources, you can enhance the effectiveness of your analytics efforts.
Creating an analytics dashboard is just the beginning. To ensure it meets user needs, you must test it and gather feedback. This process helps you refine the dashboard and make it more effective.
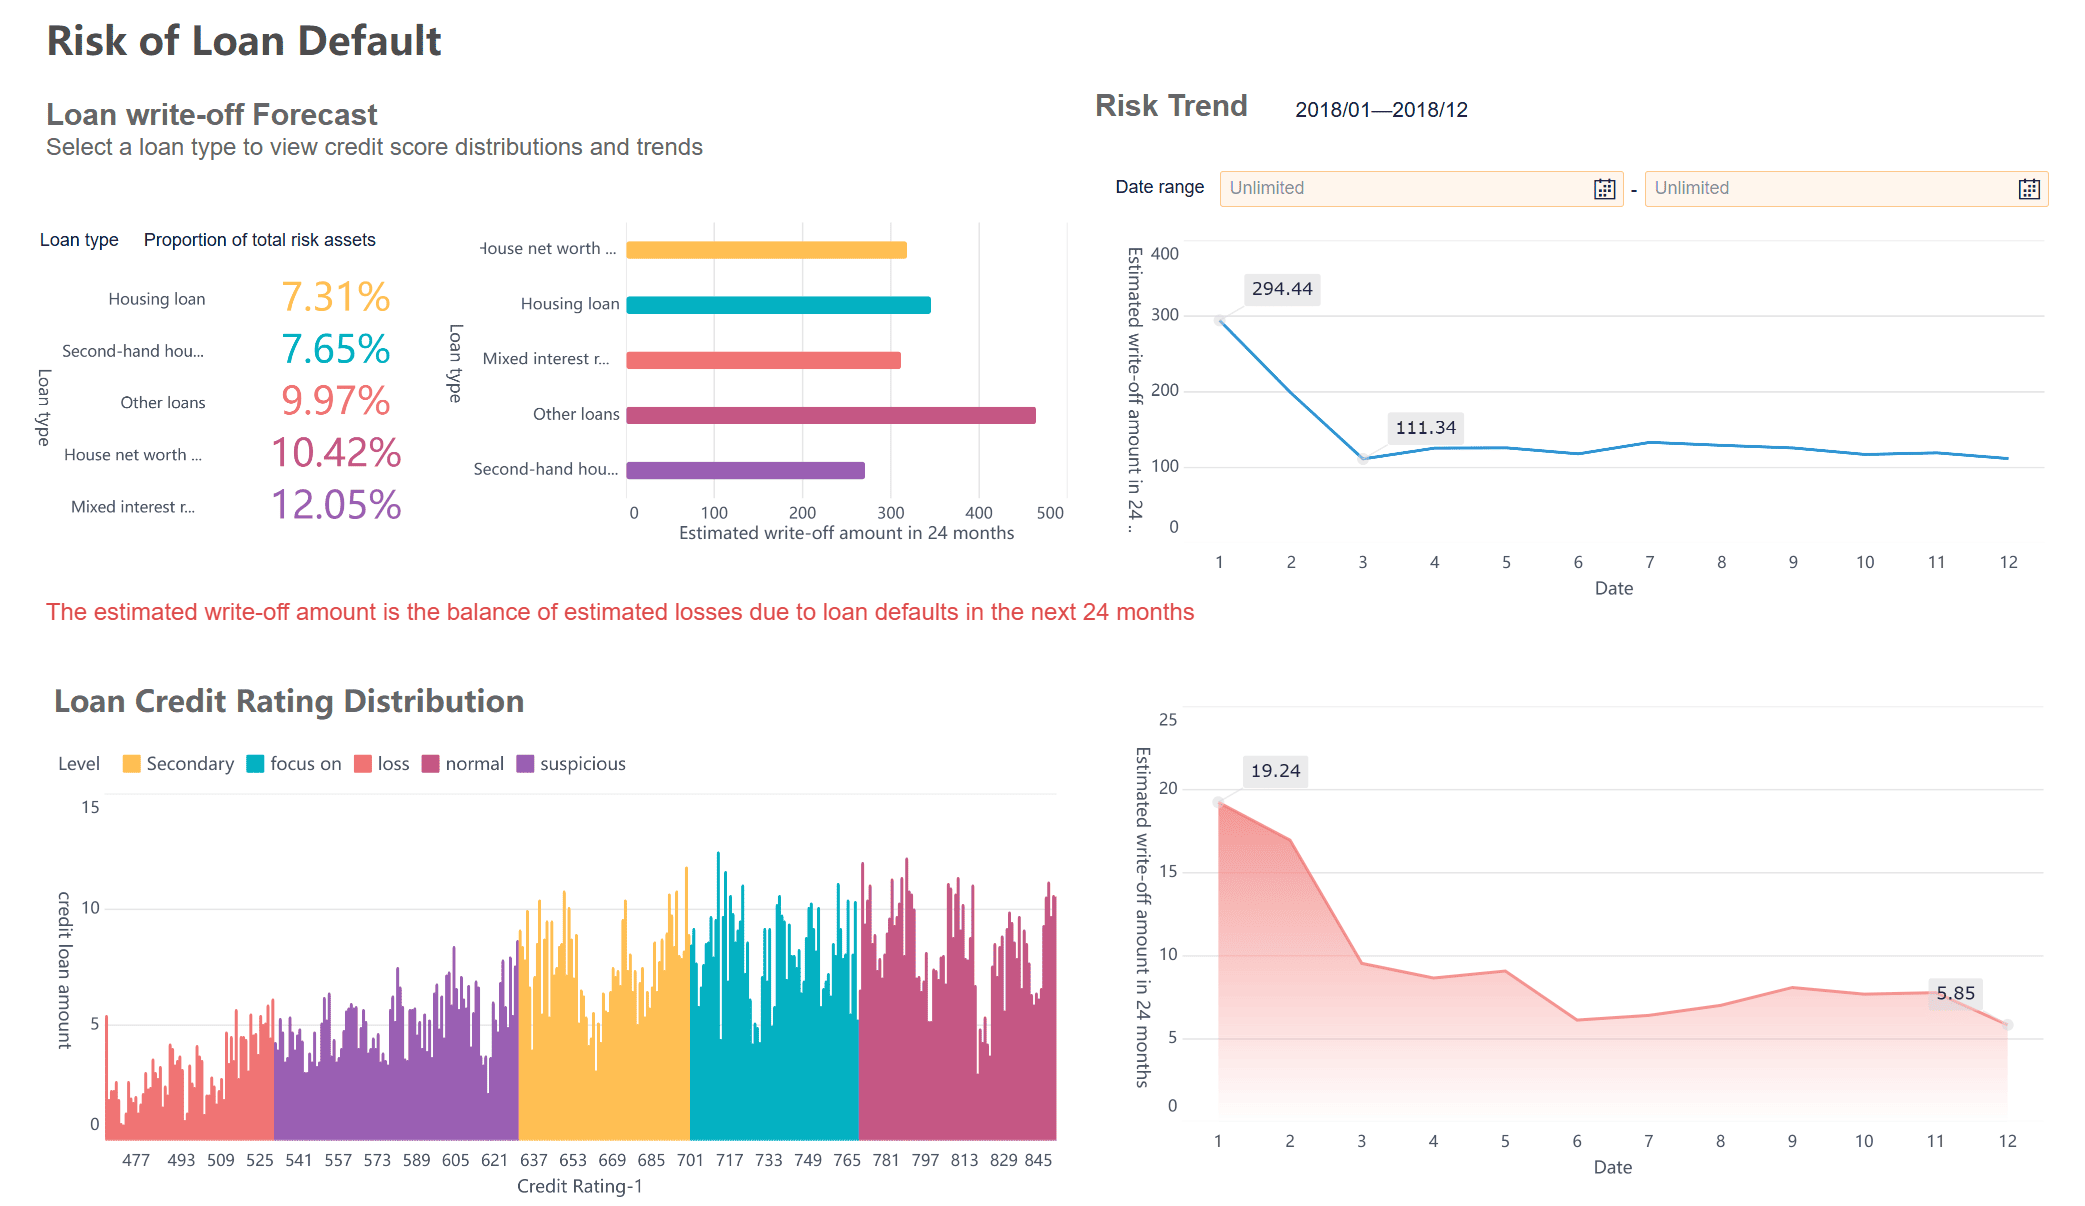
User testing is a crucial step in the dashboard development process. It allows you to see how real users interact with your dashboard and identify any issues they encounter. Here's how you can conduct effective user testing:
"User interviews can help gather qualitative insights that may not be obtained through surveys."
This quote highlights the value of direct interaction with users. By conducting interviews, you gain deeper insights into their experiences and preferences.
Once you've conducted user testing, it's time to gather and implement feedback. This step ensures that your dashboard evolves to meet user needs effectively.
By conducting thorough user testing and gathering feedback, you create a dashboard that truly meets user needs. This process not only enhances the dashboard's effectiveness but also fosters a sense of ownership and satisfaction among users.
Launching your analytics dashboard marks an exciting milestone. However, the journey doesn't end there. You need to ensure a smooth deployment and continuously monitor its performance and usage. Let's dive into these crucial steps.
Deploying your dashboard requires careful planning. You want everything to go off without a hitch. Here's how you can make that happen:
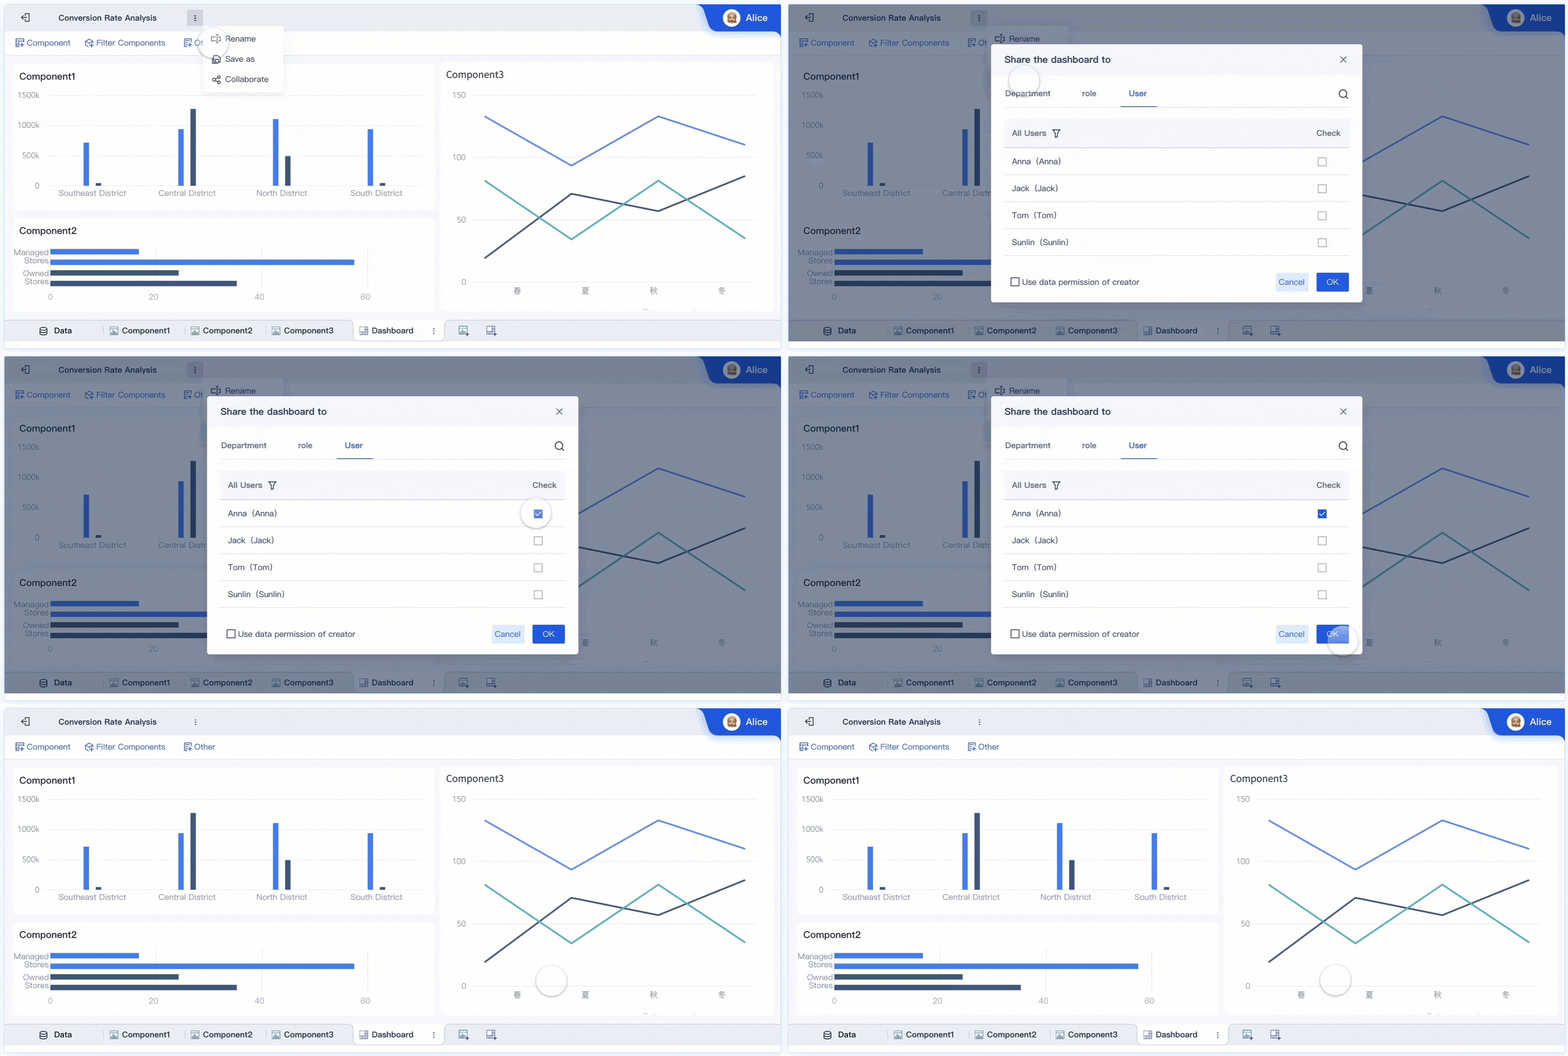
"A successful deployment involves thorough preparation, testing, and user support." - Tech Insights Magazine
This quote emphasizes the importance of preparation and support in ensuring a smooth deployment. By following these steps, you set the stage for a successful launch.
Once your dashboard is live, monitoring its performance and usage becomes essential. You want to ensure it continues to meet user needs and deliver valuable insights.

"Continuous monitoring and adaptation are key to maintaining an effective analytics dashboard." - Data Management Weekly
This insight highlights the ongoing nature of dashboard management. By actively monitoring and adapting, you ensure your dashboard remains a valuable tool for your organization.
By ensuring a smooth deployment and actively monitoring performance, you maximize the impact of your analytics dashboard. These steps help you maintain a tool that not only meets current needs but also evolves with your business.
Creating an analytics dashboard is just the beginning. To keep it effective, you need to maintain and iterate it regularly. This ensures that your dashboard continues to provide valuable insights and adapts to any changes in your business environment.
You should schedule regular updates for your dashboard. This keeps it fresh and relevant. Start by reviewing the data sources. Make sure they still align with your business goals. If you notice any outdated information, update it promptly. This practice ensures that your dashboard reflects the most current data.
Next, focus on improving the user experience. Gather feedback from users. Ask them what features they find useful and what areas need improvement. Use this feedback to make necessary changes. You might add new visualizations or simplify navigation. These improvements enhance the overall effectiveness of your dashboard.
Consider using FineBI for these updates. FineBI offers tools that make it easy to modify and enhance your dashboard. Its user-friendly interface allows you to implement changes quickly. This flexibility ensures that your dashboard remains a powerful tool for decision-making.
Your business needs will evolve over time. Your dashboard should adapt to these changes. Start by identifying new business objectives. Determine how these objectives impact the data you need to track. Adjust your dashboard to include these new metrics.
FineBI can help you adapt to these changes. It provides robust data integration capabilities. This allows you to connect to new data sources as your needs change. FineBI's flexibility ensures that your dashboard remains aligned with your business goals.
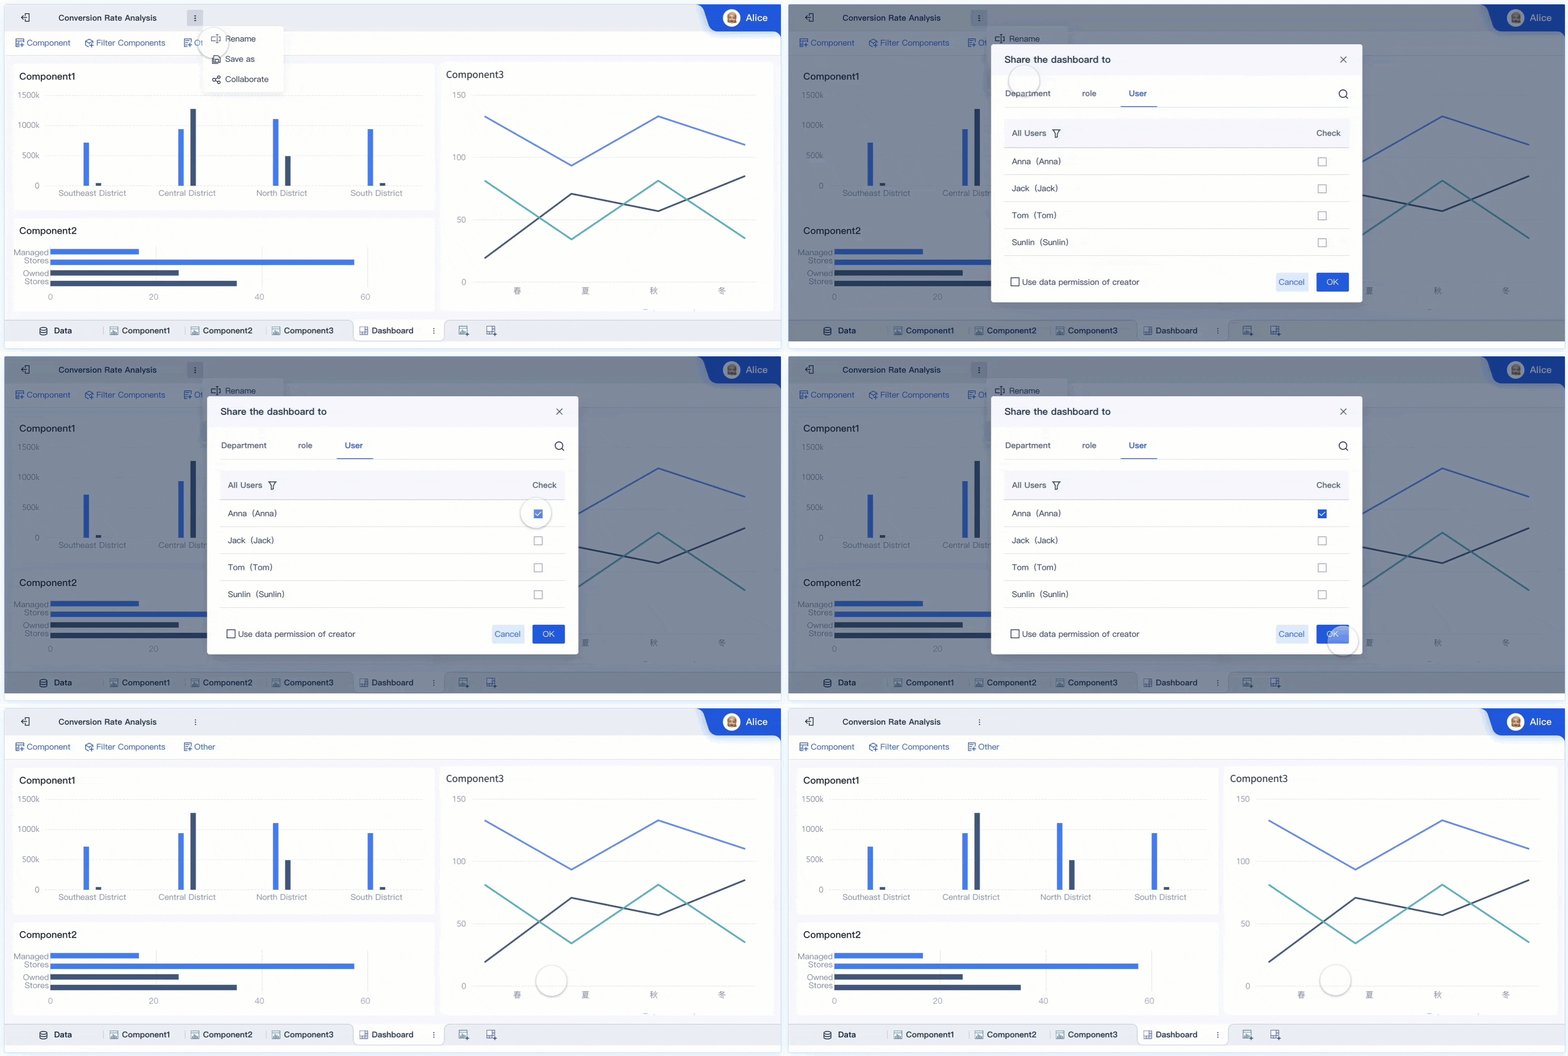
Keep an eye on industry trends. These trends might introduce new data points that are important for your business. Incorporate these data points into your dashboard. This proactive approach keeps your dashboard relevant and valuable.
Finally, test your dashboard regularly. Ensure that all features work as intended. FineBI's testing tools can assist you in this process. Regular testing helps you identify and fix any issues before they affect users.
By maintaining and iterating your analytics dashboard, you ensure it remains a vital asset for your business. Regular updates and adaptations keep it aligned with your evolving needs. With tools like FineBI, you can easily manage these changes and continue to drive informed decision-making.
Crafting an effective analytics dashboard requires a structured approach. By defining clear objectives and understanding your audience, you ensure that your dashboard delivers valuable insights. Regular maintenance and iteration keep your dashboard relevant and effective. This ongoing process allows you to adapt to changing business needs and data sources. An effective dashboard enhances decision-making and boosts business success. It provides a visual overview of key data, enabling quick and informed decisions. Embrace the power of dashboards to transform raw data into actionable insights and drive your organization forward.
Click the banner below to experience FineBI for free and empower your enterprise to convert data into productivity!
How to Quickly Build a Core App Dashboard
Store Performance Dashboard: Your Retail Command Center
Dynamic Dashboard: A Game Changer for Data Analysis
Master the Square Dashboard in Easy Steps
How to Design a Client Dashboard That Delivers Results
Draft Dashboard Review - Is It the Ultimate DFS Tool?
Mastering the Twitch Dashboard for Streamer Success
Using the Blooket Dashboard to Boost Student Engagement
Mastering the Unity Cloud Dashboard for Effective Use
How to Access the Clover Dashboard Easily
How to Access the Chrysler Employee Portal Easily
Covers Dashboard: Find Your Perfect Match

The Author
Lewis
Senior Data Analyst at FanRuan
Related Articles

What Is a Lead Generation Dashboard and How Does It Work
A lead generation dashboard tracks, analyzes, and visualizes lead data, helping teams optimize marketing and sales efforts for better conversion rates.
Lewis
Feb 05, 2026

15 Top Modern Dashboard Design Templates for 2026
See 15 top modern dashboard design templates for 2026 with clean UI, advanced features, and flexible layouts to streamline your business data insights.
Lewis
Feb 05, 2026

Top 10 Client Dashboard Software for Agencies in 2026
Compare the top client dashboard software for agencies in 2026 to find the best tools for reporting, integration, customization, and client management.
Lewis
Feb 05, 2026