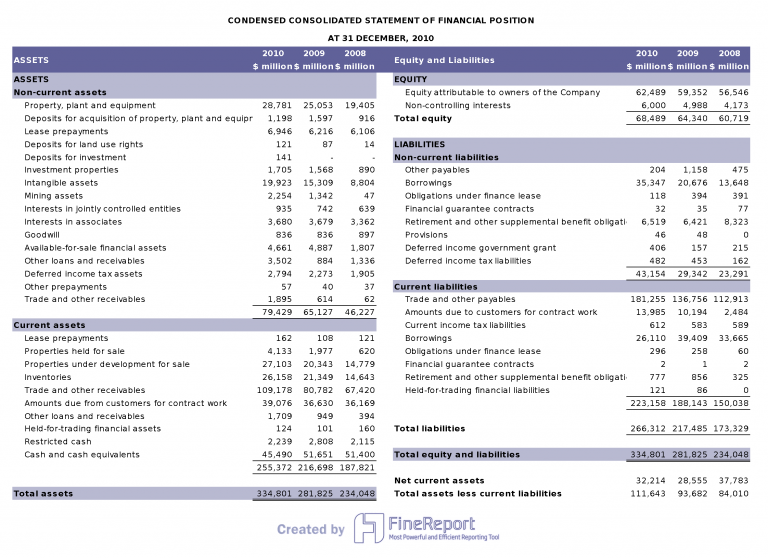
A balance sheet gives you a clear snapshot of your company’s financial health at a specific moment. It shows what your business owns, what it owes, and the value left for owners. You will see three main components:
Understanding these sections helps you assess financial stability and make informed decisions. Many business owners, accountants, and investors depend on the balance sheet to track progress and evaluate financial status. Balance Sheet Analysis uses this information to guide smarter choices and improve business outcomes.
A balance sheet gives you a structured view of your company’s financial position at a specific point in time. You see what your business owns, what it owes, and the value that remains for owners. This document is essential for business owners, investors, and stakeholders who want to understand financial health.
The balance sheet has evolved over centuries. Early forms of accounting appeared in ancient Mesopotamia, where people used writing and cartography to track resources. In the 15th century, Luca Pacioli introduced the double-entry accounting system, which became the foundation for the modern balance sheet. His work made it possible to separate debits and credits, creating a clear structure for financial reporting. By the 19th century, the rise of industrial society and public companies led to more advanced accounting tools.
Note: The double-entry system introduced by Pacioli established the balance sheet structure you use today, with separate sections for assets, liabilities, and equity.
You will find two main formats for a balance sheet: vertical and horizontal. The vertical format lists assets, liabilities, and equity in a single column. The horizontal format places assets on the left and liabilities and equity on the right. Different industries may use either format, but both provide the same essential information.
| Component | Vertical Format Description | Horizontal Format Description |
|---|---|---|
| Current Assets | Cash and other assets expected to be converted to cash within a year. | Assets presented on the left side. |
| Non-current Assets | Long-term investments, plant, property, and equipment. | |
| Current Liabilities | Obligations due within a year. | Liabilities and equity presented on the right side. |
| Long-term Liabilities | Obligations payable over a longer period. | |
| Equity | Includes common stock, preferred stock, retained earnings, and treasury stock. |
The balance sheet serves several important purposes in business financial management:
| Purpose | Description |
|---|---|
| Assessing financial health | Shows a company’s assets, liabilities, and equity, providing valuable information to stakeholders about its financial health. |
| Evaluating liquidity | Provides insight into a company’s ability to meet short-term obligations. |
| Tracking changes over time | Allows stakeholders to compare balance sheets from different periods to track financial position changes. |
| Making informed decisions | Offers financial information that aids investors and business owners in making strategic choices. |
| Compliance with regulations | Many companies are legally required to include a balance sheet in their financial reporting. |
The accounting equation forms the backbone of every balance sheet. You use it to ensure that your company’s financial records stay balanced. The equation is:
Assets = Liabilities + Equity
This equation shows that everything your business owns (assets) comes from either borrowing money (liabilities) or from investments by owners (equity). The accounting equation keeps your balance sheet accurate and reliable.
Any change in assets, liabilities, or equity must keep the equation in balance. For example, if you take out a loan, your liabilities and assets both increase. If you invest more money into your business, your assets and equity both rise. This interconnectedness ensures your balance sheet always reflects the true financial position of your company.
Luca Pacioli’s double-entry system made this possible by requiring every transaction to affect at least two accounts. This method ensures that your balance sheet remains balanced after every business activity.
Assets form the foundation of your company’s balance sheet. You use assets to measure your business’s ability to generate future value and maintain a strong financial position. On the balance sheet, assets are divided into categories based on how quickly you can convert them to cash.
| Category | Description |
|---|---|
| Current Assets | Assets you expect to convert to cash within a year, such as cash, accounts receivable, and inventory. |
| Non-Current Assets | Long-term assets, including property and equipment, that provide value over several years. |
| Tangible Assets | Physical items like machinery and buildings. |
| Intangible Assets | Non-physical assets, such as patents and trademarks. |
| Operating Assets | Assets used in daily business operations. |
| Non-Operating Assets | Investments and other assets not used in operations. |
You typically value current assets at their market value or net realizable value. Fixed assets, such as buildings, appear on the balance sheet at historical cost, adjusted for depreciation. This approach helps you track the aging and improvements of these resources. Assets play a key role in determining your financial position and influence decisions about growth and investment.
Liabilities show what your company owes to others. You list these obligations on the balance sheet to reveal how much of your assets are financed by debt. Liabilities affect your financial position and help you assess risk and solvency.
| Type of Liability | Description |
|---|---|
| Accounts Payable | Short-term debts to suppliers for goods or services. |
| Loans and Borrowings | Bank loans, mortgages, and credit lines, classified as short or long-term. |
| Bonds Payable | Long-term debt issued to investors, with fixed interest and maturity dates. |
| Deferred Revenue | Money received for goods or services not yet delivered. |
| Accrued Expenses | Costs incurred but not yet paid, such as salaries and utilities. |
| Payroll Liabilities | Amounts owed to employees and agencies, including wages and taxes. |
| Contingent Liabilities | Potential obligations that depend on future events. |
| Deferred Tax Liabilities | Future tax payments due to timing differences in income recognition. |
| Operating Lease Obligations | Future payments for leased assets. |
You classify liabilities as current or non-current, depending on when payment is due. Current liabilities are due within a year, while non-current liabilities extend beyond that period. Understanding liabilities on your balance sheet helps you manage cash flow and maintain a healthy financial position.
Equity represents the value left for owners after you subtract liabilities from assets. On the balance sheet, shareholders’ equity reflects the ownership stake and shows how much of the company’s financial position belongs to shareholders.
| Component | Description |
|---|---|
| Contributed Capital | Money invested by shareholders, including common and preferred stock. |
| Retained Earnings | Profits kept in the business for reinvestment or debt repayment. |
| Reserves | Funds set aside for specific purposes, such as legal or revaluation reserves. |
| Treasury Stock | Shares repurchased by the company, which reduce total equity. |
| Other Comprehensive Income | Unrealized gains or losses, such as currency translation adjustments. |
You see shareholders’ equity change as profits increase or decrease. Net profit from the income statement adds to retained earnings, while losses reduce equity. Uncollected revenues from credit sales appear as accounts receivable, affecting both assets and shareholders’ equity. By analyzing shareholders’ equity, you gain insight into your company’s financial position and long-term stability.
Tip: The balance sheet links assets, liabilities, and shareholders’ equity. You use this connection to evaluate your company’s financial position and make informed decisions.
You need to understand the difference between current and non-current assets when performing balance sheet analysis. Current assets are resources you expect to convert into cash or use up within one year. Non-current assets are resources that provide value over a longer period.
| Type of Asset | Examples |
|---|---|
| Current Assets | Cash, marketable securities, accounts receivable, inventory |
| Non-Current Assets | Long-term investments, land, intellectual property, property, plant, and equipment (PP&E) |
Current assets include:
Non-current assets include:
When you analyze current assets, you focus on liquidity. Liquidity measures how quickly you can convert assets into cash to meet short-term obligations. You use several ratios to assess liquidity:
| Liquidity Ratio | Description |
|---|---|
| Current Ratio | Measures near-term liquidity by comparing current assets to current liabilities. |
| Quick Ratio | Compares cash and highly-liquid current assets to current liabilities. |
| Cash Ratio | Compares cash and cash equivalents to current liabilities. |
| Net Working Capital Turnover (NWC) | Measures efficiency in utilizing operating working capital to support revenue. |
Tip: You should calculate the current ratio by dividing current assets by current liabilities. A ratio above 1 means you have enough assets to cover your short-term debts.
Balance sheet analysis also involves reviewing asset composition. You look at the percentage of tangible assets, such as equipment, compared to intangible assets, like patents. This helps you understand your company's ability to generate value and manage risk.
You must distinguish between current and long-term liabilities on the balance sheet. Current liabilities are obligations you need to pay within one year. Long-term liabilities are debts that extend beyond one year.
| Type of Liability | Definition |
|---|---|
| Current Liabilities | Obligations due within one year of the balance sheet’s date, requiring cash payment or renewal. |
| Long-term Liabilities | Obligations not due within one year of the balance sheet date, not requiring immediate cash payment. |
Current liabilities include:
Long-term liabilities include:
When you conduct balance sheet analysis, you evaluate solvency by examining how much debt your company carries. High long-term liabilities can increase financial risk and reduce investor confidence. These liabilities affect key financial ratios, such as the debt-to-equity ratio. Investors use these ratios to assess your company's creditworthiness and ability to meet future obligations.
You should use solvency ratios to analyze liabilities:
Note: A high debt-to-equity ratio may signal financial instability, but it can also indicate growth opportunities if managed well.
Equity represents the ownership interest in your company. You find several types of equity on the balance sheet:
Retained earnings and contributed capital are the main components of total equity.
| Component | Description |
|---|---|
| Retained Earnings | Accumulated net income not distributed to shareholders, reflecting profit generation and reinvestment. |
| Contributed Capital | Funds invested by owners for ownership interest, serving as an external source of equity. |
| Total Equity | Composed primarily of retained earnings and contributed capital, indicating financial health. |
You analyze equity to understand how profits and investments contribute to your company's financial strength. Retained earnings show how much profit you reinvest in the business. Contributed capital reflects the funds owners invest for ownership. You use balance sheet analysis to track changes in equity and assess long-term stability.
You should use several methods to analyze balance sheet components and assess financial health:
| Method | Description |
|---|---|
| Debt to Equity Analysis | Evaluates how much debt the company has relative to its equity. |
| Liquidity Evaluation | Assesses how liquid the business is in the short term (less than one year). |
| Asset Composition | Analyzes what percentage of assets are tangible versus those derived from financial transactions. |
| Payment and Inventory Cycles | Examines how long it takes to receive payments from customers and repay suppliers, as well as inventory turnover. |
You should calculate key ratios:
Liquidity ratios help you determine if your company can meet short-term obligations. Solvency ratios show your ability to manage long-term debt and maintain financial stability.
You can streamline balance sheet analysis using FineReport. This enterprise-level reporting tool automates financial reporting and simplifies data management. FineReport offers a visual report designer with a drag-and-drop interface, so you can create complex reports without coding. You integrate data from SQL databases, Excel files, and cloud services for a comprehensive view of your balance sheet.
FineReport provides interactive dashboards that let you filter data and view real-time updates. You schedule automated report generation and distribution, ensuring stakeholders receive timely financial insights. The platform supports real-time data processing, so your balance sheet analysis always uses the latest information.

| Key Feature | Description |
|---|---|
| Visual Report Designer | Drag-and-drop interface for creating complex reports without coding. |
| Data Integration | Seamless integration with SQL databases, Excel files, and cloud services. |
| Interactive Dashboards | Dynamic dashboards for data interaction through filters and real-time updates. |
| Scheduled Reporting | Automates report generation and distribution at specified intervals. |
| Real-Time Data Processing | Handles real-time data streams for up-to-date reporting and analysis. |
| Advanced Charting Options | Wide range of chart types for detailed data visualization. |
| Customizable Templates | Pre-designed templates that can be customized for specific business needs. |
| Collaboration Tools | Features for sharing and commenting on reports to promote teamwork. |
| Data Security Measures | Implements encryption and security protocols to protect sensitive information. |
For example, you can use FineReport to build a dashboard that displays liquidity ratios, debt-to-equity analysis, and asset composition side by side. You can set up scheduled reports that automatically update with the latest financial data. This automation reduces manual work and improves accuracy.
FineReport helps you visualize complex financial data, making it easier to spot trends and identify risks. You can share reports with your team and collaborate on financial decisions. The platform's security features protect sensitive information, so you can trust your balance sheet analysis.
Tip: Automating balance sheet analysis with FineReport saves time, reduces errors, and provides deeper insights for better decision-making.

Ratio analysis gives you a powerful way to interpret financial statements and understand your company’s financial health. You use ratios to compare different aspects of your business, such as liquidity, solvency, efficiency, and profitability. These ratios help you evaluate how well your company manages resources and meets obligations.
| Ratio Type | Description |
|---|---|
| Liquidity Ratios | Assess your ability to meet short-term obligations and maintain sufficient liquidity. |
| Solvency Ratios | Evaluate long-term stability and your capacity to service debt. |
| Efficiency Ratios | Provide insights into operational effectiveness and highlight areas for optimization. |
| Profitability Ratios | Measure your ability to generate earnings relative to revenue, assets, and equity. |
You calculate ratios such as the current ratio, quick ratio, and debt-to-equity ratio to gain insights into your company’s position. Analysts use these ratios to compare your financial statements with industry benchmarks and historical data. This process helps you identify strengths and weaknesses in your operations.
Ratio analysis transforms raw data from financial statements into actionable insights. You use these insights to make informed decisions and improve your company’s performance.
FineReport streamlines the analysis of financial statements by offering advanced features for real-time data entry, automated reporting, and dashboard visualization. You can update your financial statement data instantly using drag-and-drop tools. The platform automates report generation, helping you summarize business performance and design custom reports.
| Feature | Description |
|---|---|
| Real-time data entry | Update financial statements instantly with intuitive tools. |
| Automated financial reporting | Generate and distribute reports automatically for timely insights. |
| KPI tracking | Monitor key performance indicators from multiple sources. |
| Data export | Export reports in formats like Word, Excel, PDF, or PNG. |
| Data visualization | Use dynamic effects, custom maps, and 3D charts for deeper analysis. |
| Mobile application | Access and interact with financial statements on-the-go. |
FineReport also enhances dashboard visualization for financial statement analysis. You can create customizable dashboards with over 60 chart types and dynamic visual effects. The platform integrates data from various business systems, giving you a comprehensive view of your financial statements. Reports and dashboards adapt to mobile devices and large screens, making it easy to monitor financial performance anywhere.
Tip: FineReport helps you transform complex financial statements into clear, actionable insights. You gain the ability to track KPIs, visualize trends, and share results with your team, all in real time.
Understanding balance sheet components gives you a clear view of your company’s financial position and supports better decision-making. Review the table below for key takeaways:
| Component | Description |
|---|---|
| Assets | Resources owned by your company, divided into current and non-current. |
| Liabilities | Financial obligations owed to others, split into current and non-current. |
| Shareholders’ Equity | Net assets after liabilities, showing ownership interest. |
| Accounting Equation | Assets = Liabilities + Shareholders’ Equity. |
You gain insights into liquidity, investment potential, and risk. Modern tools like FineReport automate balance sheet analysis, streamline reporting, and help you leverage trends such as automation and real-time reporting for more efficient financial management.
What Is a Quarterly Report and Why Investors Should Care
How to Use Inventory Report for Better Business Decisions
How to Build a Service Report Template for Your Business
What Is a Research Report and Why Does It Matter
What Is an Interview Report and Why Does It Matter
How to create a monthly sales report that drives results


The Author
Lewis
Senior Data Analyst at FanRuan
Related Articles

10 Custom Reporting Dashboard Tools Compared: Features, Limits, and Best-Fit Use Cases
Compare 10 custom reporting dashboard tools on features, limits, and best-fit use cases.
Lewis Chou
May 03, 2026

10 Best Dashboard Reporting Tools for 2026 Compared: Power BI, Tableau, Looker Studio, and More
Dashboard reporting tools are software platforms that turn business data into interactive dashboards, scheduled reports, and decision ready insights.
Lewis Chou
Apr 27, 2026
How to create an HTML report from scratch in 2026
Build an html report from scratch in 2026 with easy steps, tools, and tips for customization, sharing, and making your data clear and interactive.
Lewis Chou
Mar 23, 2026


