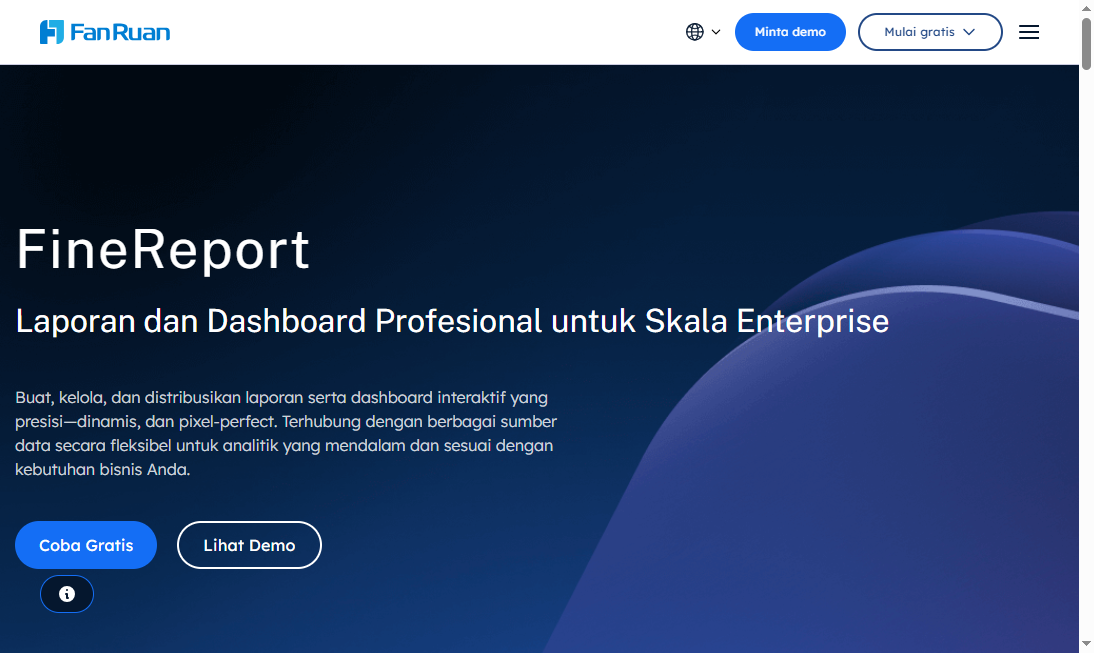
FineReport is a BI and reporting platform designed for pixel-perfect reports, dashboards, and enterprise-grade reporting workflows.
Quick Comparison of the 10 Best BI Reporting Tools
If you are comparing bi reporting tools in 2026, the fastest way to narrow your shortlist is to look at fit: self-service ease, enterprise governance, data connectivity, deployment flexibility, and total cost over time.
Below is a practical snapshot of the top options for different reporting needs.
| Tool | Best Strength | Main Limitation | Best For | Deployment | Learning Curve | Likely Budget Range |
|---|---|---|---|---|---|---|
| Microsoft Power BI | Strong Microsoft integration and value | Can become complex at scale | Microsoft-centric teams | Cloud, desktop, embedded, hybrid options | Moderate | Low to mid |
| Tableau | Excellent visual exploration | Pricing can rise quickly | Analysts and dashboard-heavy teams | Cloud, server | Moderate to high | Mid to high |
| Looker | Governed metrics and semantic modeling | Requires more data maturity | Scalable cross-team reporting | Cloud | High | High |
| Qlik Sense | Associative exploration and flexible analysis | Less intuitive for some casual users | Teams needing deeper data discovery | Cloud, client-managed | Moderate to high | Mid to high |
| SAP Analytics Cloud | Strong SAP ecosystem alignment | Best value mainly in SAP environments | SAP enterprises | Cloud | Moderate to high | High |
| Oracle Analytics Cloud | Enterprise reporting and data management depth | Can feel heavyweight for smaller teams | Large enterprises | Cloud | High | High |
| Domo | Fast cloud deployment and executive visibility | Cost can be hard to predict | Cloud-first business teams | Cloud | Low to moderate | Mid to high |
| Sisense | Embedded analytics and product reporting | Setup can require technical resources | SaaS and product teams | Cloud, hybrid | Moderate to high | Mid to high |
| Metabase | Simple, approachable analytics | Less advanced enterprise functionality | Small teams and startups | Cloud, self-hosted | Low | Free to low/mid |
| Apache Superset | Flexible open source BI | Technical setup and maintenance required | Engineering-led teams | Self-hosted, cloud-managed by third parties | High | Free software, higher internal cost |
Shortlist guidance by company stage
- Small teams: Metabase, Power BI, Domo
- Growing companies: Power BI, Tableau, Qlik Sense, Metabase
- Enterprise environments: Looker, SAP Analytics Cloud, Oracle Analytics Cloud, Power BI, Sisense
- Open source-focused teams: Metabase, Apache Superset
- Embedded analytics use cases: Sisense, Power BI, Metabase
What to Look for in BI Reporting Tools in 2026
Before comparing vendors, it helps to separate self-service reporting from enterprise reporting.
Self-service reporting vs enterprise reporting
Self-service reporting is built for business users who want to answer questions quickly without heavy IT involvement. The priorities are:
- Easy report creation
- Simple filters and drill-downs
- Fast dashboard sharing
- Minimal training
- Low friction access to common data sources
Enterprise reporting is more structured and controlled. It usually supports regulated, recurring, or organization-wide reporting where consistency matters more than speed alone. The priorities are:
- Central governance
- Security and permissions
- Certified metrics and semantic layers
- Scheduled and burst reporting
- Scalability across departments and regions
- Auditability and administration
Many organizations need both. That is why the best business intelligence reporting tools and dashboards now try to balance user freedom with governance.
Key evaluation criteria for BI reporting tools
When reviewing bi reporting tools, focus on these five areas.
1. Ease of use
A tool may look powerful in a demo but fail in adoption if non-technical users cannot build or adjust reports confidently.
Look for:
- Drag-and-drop report design
- Natural language or guided query options
- Reusable templates
- Simple dashboard navigation
- Low dependence on SQL for basic use cases
2. Dashboard flexibility
Reporting needs differ across finance, operations, sales, and executives. Some teams need ad hoc dashboards; others need highly formatted operational reports.
Evaluate whether the platform supports:
- Interactive dashboards
- Pixel-perfect or paginated reports
- Mobile-friendly layouts
- Embedded analytics
- Drill-through and cross-filtering
- Custom branding and layout control
This is one reason FineReport deserves attention alongside mainstream BI platforms. It is especially strong when companies need both dashboarding and highly formatted enterprise reports, rather than dashboards alone.
3. Governance and security
As usage grows, governance becomes critical. Self-service without control often leads to conflicting metrics and duplicated dashboards.
Important governance capabilities include:
- Role-based access control
- Row-level or column-level security
- Certified datasets and metrics
- Data lineage
- Version control
- Audit logs
- Approval workflows for published content
4. Data connectivity
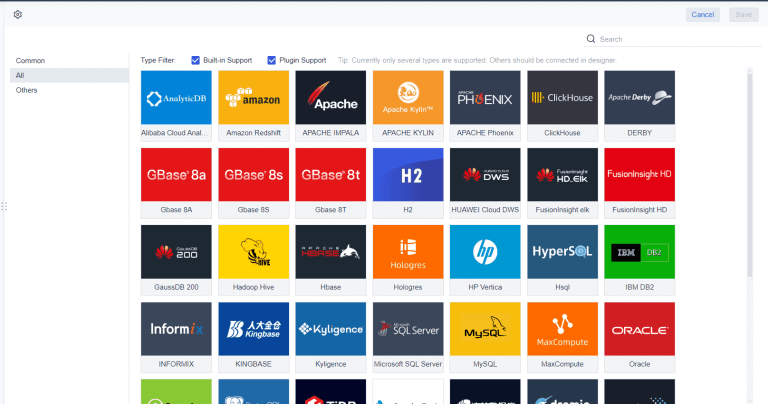
Modern teams rarely use a single source. A useful tool should connect well to cloud warehouses, relational databases, spreadsheets, business apps, and APIs.
Check support for:
- SQL databases
- Cloud warehouses
- ERP and CRM systems
- Flat files and Excel
- API-based connectors
- Real-time or near-real-time refresh
- Blending or semantic modeling
5. Pricing and total cost of ownership
Sticker price matters, but so do admin overhead, infrastructure, training, and developer dependency.
Consider:
- Per-user vs capacity pricing
- Viewer vs creator license separation
- Embedded analytics pricing
- Infrastructure costs for self-hosting
- Cost of enterprise add-ons
- Support and implementation effort
The 10 Best BI Reporting Tools for Self-Service and Enterprise Reporting
FineReport
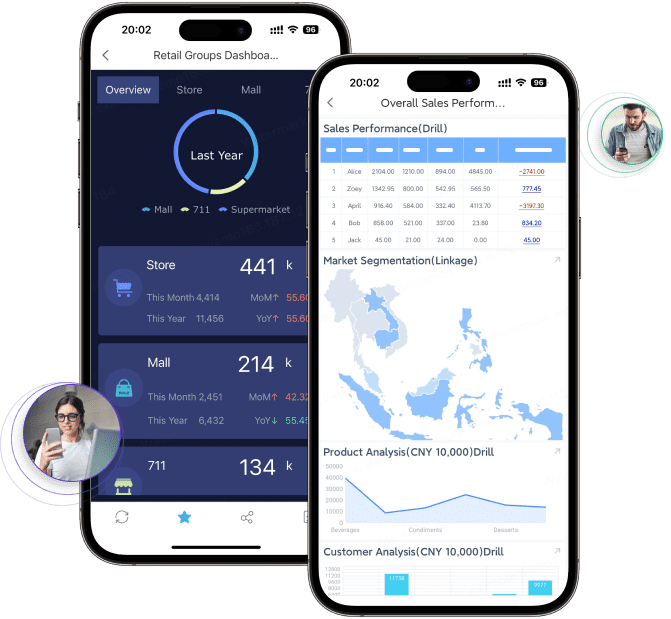
- One-sentence overview: FineReport is an enterprise reporting and dashboard platform that is particularly strong for pixel-perfect reporting, complex forms, and operational reporting scenarios.
- Key Features:
- Pixel-perfect report design
- Dashboard creation for management and operational use cases
- Strong support for complex tabular reports and print-ready layouts
- Data entry and write-back workflows
- Broad database connectivity
- Enterprise deployment and permission control
- Pros & Cons:
- Pros:
- Strong for structured enterprise reporting
- Well suited to financial, operational, and multi-page formatted reports
- Useful when dashboards alone are not enough
- Can support both reporting and data collection workflows
- Cons:
- Less often discussed in mainstream Western BI comparisons
- Buyers should validate ecosystem fit and local implementation support
- May not be the first choice for purely exploratory visual analytics
- Pros:
- Best For (Target user/scenario): Enterprises that need highly formatted reports, operational statements, dashboarding, and reporting workflows in one platform.
FineReport deserves attention in this market because many organizations do not just need dashboards. They also need print-ready reports, fixed-layout forms, periodic report books, and operational reporting processes. In those scenarios, FineReport can be a better fit than tools focused primarily on visual exploration.
Microsoft Power BI
- One-sentence overview: Microsoft Power BI is a widely adopted BI platform that combines self-service dashboarding, data modeling, and enterprise distribution at a relatively accessible starting price.
- Key Features:
- Strong integration with Excel, Teams, Azure, and Microsoft Fabric
- Interactive dashboards and data visualizations
- DAX-based modeling and calculations
- Semantic models and reusable datasets
- Embedded analytics and broad sharing options
- Row-level security and governance features
- Pros & Cons:
- Pros:
- Strong value for organizations already using Microsoft products
- Broad connector ecosystem
- Good balance between self-service and enterprise reporting
- Large talent pool and community support
- Cons:
- DAX and modeling can become complex
- Governance requires deliberate setup
- Capacity and premium scenarios can raise costs
- Pros:
- Best For (Target user/scenario): Organizations invested in Microsoft products and teams that need strong visualization with a path from departmental dashboards to enterprise reporting.
Power BI remains one of the safest choices in the bi reporting tools market because it covers a wide range of use cases. It works well for analysts, finance teams, and operations managers who want interactive dashboards, and it scales into governed enterprise usage when paired with the broader Microsoft data stack.
Pricing is attractive at the entry level, but large-scale distribution, premium performance, and advanced governance can change the cost profile. It fits best where Microsoft 365, Azure, or Fabric already shape the analytics environment.
Tableau
- One-sentence overview: Tableau is a leading analytics platform focused on rich visual analysis, interactive dashboards, and strong exploratory reporting.
- Key Features:
- Advanced charting and dashboard interactivity
- Strong visual analytics workflow
- Broad data source connectivity
- Dashboard actions, drill-downs, and storytelling
- Tableau Cloud and Tableau Server deployment options
- Strong support for analyst-driven exploration
- Pros & Cons:
- Pros:
- Best-in-class visual exploration for many use cases
- Flexible dashboard design
- Strong analyst adoption
- Mature ecosystem and training availability
- Cons:
- Higher pricing than some alternatives
- Can require more expertise for clean data modeling
- Enterprise standardization may need extra governance discipline
- Pros:
- Best For (Target user/scenario): Teams that prioritize advanced visual analysis and interactive dashboards for business users and analysts.
Tableau continues to be one of the most recognized business intelligence reporting tools for exploratory analytics. It shines when users need to interact with data, compare dimensions quickly, and communicate patterns visually.
Its best fit is organizations with active analyst teams and a strong dashboard culture. If your reporting needs lean heavily toward highly formatted operational statements, other platforms may be more suitable.
Looker
- One-sentence overview: Looker is a modern BI platform centered on governed metrics, semantic consistency, and scalable reporting across business teams.
- Key Features:
- Semantic modeling layer
- Governed metrics definitions
- Browser-based report development
- Embedded analytics support
- Cloud-native architecture
- Strong integration with modern data warehouse environments
- Pros & Cons:
- Pros:
- Excellent for consistent metric governance
- Well suited to centralized data teams
- Strong for scaling reporting logic across departments
- Good embedded and API-oriented capabilities
- Cons:
- Requires data maturity and modeling discipline
- Less friendly for teams seeking instant self-service simplicity
- Enterprise pricing can be significant
- Pros:
- Best For (Target user/scenario): Organizations that need governed metrics and scalable reporting across many teams using centralized data models.
Looker is often chosen when consistency matters more than dashboard design flair. If your main problem is conflicting KPI definitions across sales, finance, and operations, Looker’s modeling-first approach can be a major advantage.
It is better suited to companies with established data teams and warehouse-centric architectures than to teams seeking a quick plug-and-play tool.
Qlik Sense

- One-sentence overview: Qlik Sense is a BI platform known for associative analysis, flexible exploration, and strong support for uncovering non-obvious data relationships.
- Key Features:
- Associative data engine
- Interactive dashboards and self-service analysis
- Broad connectivity options
- Augmented analytics features
- Cloud and client-managed deployment choices
- Strong filtering and discovery workflows
- Pros & Cons:
- Pros:
- Powerful exploratory analysis model
- Flexible for users who ask layered questions
- Good enterprise capabilities
- Useful balance of guided and free-form exploration
- Cons:
- May feel less intuitive to some new users
- Licensing and architecture can take time to understand
- Formatting-heavy reporting is not its primary strength
- Pros:
- Best For (Target user/scenario): Teams that need flexible data exploration and want to analyze relationships across multiple data dimensions.
Qlik Sense is often appreciated by teams that do not want rigid drill paths. Its associative model can reveal related insights more fluidly than traditional filter-based tools.
For organizations with active analysts and curious business users, it can be a strong choice. For highly formal enterprise report packs, however, another platform may fit better.
SAP Analytics Cloud
- One-sentence overview: SAP Analytics Cloud combines BI, planning, and analytics in a single cloud platform with deep alignment to SAP ecosystems.
- Key Features:
- Integrated analytics and planning
- SAP data source connectivity
- Enterprise dashboards and reports
- Predictive and augmented analytics features
- Governance and enterprise security controls
- Cloud-based deployment
- Pros & Cons:
- Pros:
- Strong fit for SAP-centric enterprises
- Useful for aligning analytics with planning processes
- Enterprise-grade governance
- Consolidated analytics environment
- Cons:
- Best value often depends on existing SAP investment
- Can be excessive for smaller teams
- Learning and implementation effort can be substantial
- Pros:
- Best For (Target user/scenario): Enterprises that need planning, analytics, and broad SAP integration.
SAP Analytics Cloud is not the most universal recommendation, but for SAP-heavy organizations it can simplify architecture and support broader performance management processes. It is especially relevant where planning and reporting need to live close together.
Oracle Analytics Cloud
- One-sentence overview: Oracle Analytics Cloud is an enterprise analytics platform built for large organizations that need strong reporting, data management alignment, and administrative control.
- Key Features:
- Enterprise reporting and dashboarding
- Data preparation and modeling capabilities
- Oracle ecosystem integration
- Machine learning-assisted analytics features
- Security, governance, and centralized administration
- Scalable cloud deployment
- Pros & Cons:
- Pros:
- Strong enterprise-grade management capabilities
- Good fit for complex reporting environments
- Suitable for large-scale deployments
- Helpful for Oracle-centric infrastructure
- Cons:
- Can feel heavyweight for mid-market teams
- Setup and administration may require experienced resources
- Cost and complexity can be high
- Pros:
- Best For (Target user/scenario): Large organizations focused on enterprise reporting, compliance, and data management.
Oracle Analytics Cloud suits enterprises that prioritize control, scale, and integration with broader Oracle systems. It is less appealing for teams seeking lightweight self-service, but stronger in centralized reporting environments.
Domo
- One-sentence overview: Domo is a cloud-first BI platform designed for rapid deployment, accessible dashboards, and broad business visibility.
- Key Features:
- Cloud-native deployment
- Executive dashboards and KPI tracking
- Prebuilt connectors
- Data apps and workflow-friendly features
- Mobile access
- Collaboration and alerting
- Pros & Cons:
- Pros:
- Quick time to value
- Strong executive and departmental dashboarding
- Good usability for business teams
- Useful cloud-first operating model
- Cons:
- Pricing can become a concern as usage expands
- Less flexible than some tools for deep custom modeling
- Complex enterprise governance needs may require careful evaluation
- Pros:
- Best For (Target user/scenario): Cloud-first teams that want fast deployment and strong executive dashboard experiences.
Domo is appealing when speed matters. It is often shortlisted by companies that want business-facing dashboards up quickly without building a large analytics stack first. For broad enterprise reporting standardization, buyers should assess governance depth carefully.
Sisense
- One-sentence overview: Sisense is a BI platform with strong embedded analytics capabilities, making it particularly relevant for product-facing reporting.
- Key Features:
- Embedded analytics and white-label options
- Dashboard and report development
- API and developer-friendly customization
- Scalable data handling
- Cloud and hybrid deployment options
- Support for customer-facing analytics
- Pros & Cons:
- Pros:
- Strong for embedded and OEM analytics
- Flexible for product integration scenarios
- Suitable for external-facing reporting
- Good customization potential
- Cons:
- Often needs technical implementation support
- Not always the easiest for casual internal users
- Pricing may be better justified in embedded use cases
- Pros:
- Best For (Target user/scenario): SaaS companies and product teams that need embedded analytics or customer-facing reporting.
Sisense stands out less as a general internal dashboard tool and more as a strategic embedded analytics platform. If reporting is part of your product experience, it deserves serious consideration.
Metabase
- One-sentence overview: Metabase is an approachable analytics and reporting platform that offers fast setup, easy self-service querying, and open source flexibility.
- Key Features:
- Visual query builder
- SQL editor for advanced users
- Interactive dashboards
- Open source deployment option
- Basic embedding capabilities
- Fast setup and accessible user experience
- Pros & Cons:
- Pros:
- Very approachable for non-technical teams
- Fast time to value
- Open source option lowers entry cost
- Good balance between simple UI and analyst flexibility
- Cons:
- Less comprehensive enterprise governance than some larger platforms
- Advanced reporting and formatting capabilities are more limited
- Complex large-scale deployments may need more evaluation
- Pros:
- Best For (Target user/scenario): Teams that want approachable open source analytics with fast setup.
Metabase is one of the most practical budget-friendly entries among bi reporting tools. It is often enough for startups, internal operations teams, and companies that want self-service dashboards without committing to a large enterprise platform.
Apache Superset
- One-sentence overview: Apache Superset is a flexible open source BI platform aimed at technically capable teams that want broad customization and control.
- Key Features:
- Open source dashboarding and visualization
- SQL-based exploration
- Wide database compatibility
- Customizable architecture
- Large-scale deployment potential
- Strong fit with engineering-led data stacks
- Pros & Cons:
- Pros:
- No software license cost
- Flexible and extensible
- Good fit for modern data platforms
- Appeals to engineering and analytics teams comfortable with open source
- Cons:
- Requires technical setup and maintenance
- Less polished for non-technical business users
- Support depends on internal capability or third-party help
- Pros:
- Best For (Target user/scenario): Technically capable teams seeking flexible open source BI options.
Superset can be powerful, but it is rarely the easiest option. It works best where engineering ownership is acceptable and internal teams can support deployment, permissions, upgrades, and performance tuning.
Which BI Tool Fits Your Reporting Needs Best?
Best for self-service reporting
For self-service reporting, the priority is usability. Business users should be able to build or customize dashboards without relying on technical teams for every change.
Top choices:
- Power BI: Strong balance of usability, scale, and price
- Metabase: Excellent for quick setup and approachable analytics
- Domo: Good for rapid cloud deployment and business visibility
- Tableau: Strong for users who want richer visual analysis
If low setup friction matters most, Metabase and Domo are especially attractive. If you need broader long-term scalability, Power BI often becomes the more practical choice.
Best for enterprise reporting
Enterprise reporting needs more than dashboard creation. It requires control, repeatability, security, and trusted definitions.
Top choices:
- Looker: Excellent for governed metrics and semantic consistency
- Power BI: Strong enterprise path, especially in Microsoft environments
- SAP Analytics Cloud: Best for SAP-heavy organizations
- Oracle Analytics Cloud: Suitable for large, controlled enterprise deployments
- FineReport: Strong choice for pixel-perfect enterprise reporting and structured report workflows
If your organization publishes recurring, compliance-sensitive, or multi-department reports, governance and report formatting matter as much as visualization. That is where FineReport, Looker, and enterprise-oriented suites become more compelling.
Best open source and budget-friendly picks
For lower-budget or open source-first environments, two tools stand out:
- Metabase: Best for teams that want simplicity and fast deployment
- Apache Superset: Best for teams that prioritize flexibility and have technical resources
The main tradeoff is straightforward:
- Metabase offers easier adoption and better accessibility for business users
- Superset offers more technical flexibility but higher maintenance burden
Power BI can also be budget-friendly at smaller scales, though it is not open source.
Most impressive options beyond the usual picks
Some tools are less frequently mentioned in generic lists but deserve more attention.
- FineReport: Strong for enterprises needing formatted reporting and operational workflows
- Sisense: Highly relevant for embedded analytics and customer-facing use cases
- Qlik Sense: Valuable for users who benefit from associative exploration rather than standard drill paths
- Domo: Attractive for fast business rollout and executive dashboarding
These are worth a closer look when your needs go beyond the standard “build dashboards from warehouse data” scenario.
How to Choose the Right Tool for Your Team
The right choice depends less on feature volume and more on fit.
Match the tool to your reporting reality
Ask these questions first:
- Do users mainly need self-service dashboards or governed enterprise reports?
- Are reports interactive, scheduled, printed, embedded, or all of the above?
- How many people create content versus only consume it?
- Is your data warehouse mature, or are you still pulling from mixed operational systems?
- Do you have in-house SQL, modeling, or admin expertise?
- How important are semantic consistency and certified metrics?
- Do stakeholders need pixel-perfect outputs or mostly interactive dashboards?
Use a practical pilot checklist
Before signing a long-term agreement, run a pilot with real data and real users.
Test the following:
- Adoption: Can business users create or modify reports without frustration?
- Performance: Do dashboards load quickly at realistic data volumes?
- Integration effort: How hard is it to connect core systems and maintain refreshes?
- Governance: Can you control permissions, certify metrics, and track usage?
- Maintenance: How much admin work is required each month?
- Sharing: Can users distribute reports in the formats stakeholders actually need?
- Scalability: Will the tool still work when departments and users multiply?
A simple framework for narrowing the shortlist
Use this practical approach:
Choose Power BI if:
- You already use Microsoft heavily
- You want a broad middle ground between self-service and enterprise BI
- You need strong value at the starting price point
Choose Tableau if:
- Visual exploration is your top priority
- Analysts drive reporting usage
- You are comfortable with higher software spend
Choose Looker if:
- Metric consistency is your biggest challenge
- You have a mature warehouse and data team
- Governance matters more than instant ease
Choose Qlik Sense if:
- Users need deeper exploratory analysis
- You value associative discovery
- Your team can handle a slightly steeper learning curve
Choose SAP Analytics Cloud or Oracle Analytics Cloud if:
- You are a large enterprise
- You need strong administrative control
- Ecosystem alignment with SAP or Oracle is important
Choose Domo if:
- You want rapid cloud deployment
- Executives need quick KPI visibility
- Ease and speed matter more than deep customization
Choose Sisense if:
- Reporting is part of your product
- Embedded analytics is a strategic requirement
- You need API and white-label flexibility
Choose Metabase if:
- You want fast, approachable analytics
- Budget matters
- Your primary need is self-service internal reporting
Choose Apache Superset if:
- Your team is technical
- Open source flexibility is a priority
- You can support ongoing maintenance internally
Choose FineReport if:
- Your organization needs structured, pixel-perfect enterprise reports
- Dashboards must coexist with print-ready statements, forms, or scheduled report packs
- Reporting workflows are as important as visualization
In the end, the best bi reporting tools are the ones your team will actually adopt, trust, and maintain. For many organizations, that means balancing self-service speed with enterprise control. If your needs lean heavily toward governed dashboards, Power BI and Looker are strong contenders. If your reporting requires more structured layouts and enterprise-ready formatted outputs, FineReport is well worth adding to the shortlist.
FAQs
Focus on ease of use, dashboard and report flexibility, governance, data connectivity, and total cost of ownership. The best choice depends on whether you prioritize self-service speed, enterprise control, or a balance of both.
Self-service reporting helps business users create and explore reports quickly with minimal technical support. Enterprise reporting emphasizes standardized metrics, security, scheduling, and governance for organization-wide use.
Smaller teams often start with tools like Metabase, Power BI, or Domo because they are faster to adopt and generally easier to manage. The right option depends on your budget, technical skills, and reporting complexity.
FineReport is a strong fit when you need highly formatted, pixel-perfect reports alongside dashboards and enterprise workflows. It is especially useful for organizations with operational reporting, scheduled reporting, or strict layout requirements.
Costs can rise beyond the base subscription through creator and viewer licensing, infrastructure, training, and admin effort. It is important to compare long-term operating costs, not just entry-level pricing.


The Author
Yida Yin
FanRuan Industry Solutions Expert
Related Articles

Emerging Business Intelligence in 2026: 9 Trends, Core Technologies, and Real Business Impact
$1 in 2026 is no longer about producing better reports. It is about helping leaders, analysts, and operations teams make faster, more confident decisions from live, trusted, and increasingly AI assisted data. For enterpr
Lewis Chou
Jun 04, 2026

Portfolio Performance Reporting Framework: 12 Metrics Enterprise Teams Should Measure and Why
Portfolio performance reporting is the operating system for capital allocation decisions. If executives, finance teams, portfolio leaders, and operators are all looking at different numbers, decisions slow down, accounta
Yida Yin
Jun 08, 2026

Corporate Sustainability Reporting Software vs BI Platforms: When FineReport Is the Better Choice
$1 is an $1 and dashboard platform that helps organizations turn complex operational data into highly customized, audit ready reports and analytics. Corporate sustainability reporting software vs BI platforms: what decis
Yida Yin
Jun 08, 2026