FineReport is an enterprise-grade online reporting software platform designed for building pixel-perfect reports, dashboards, and data entry applications at scale.
Best online reporting software tools compared at a glance
FineReport
One-sentence overview: FineReport is best for enterprises that need highly formatted reports, complex operational reporting, and controlled distribution across large teams.
-
Key Features
- Pixel-perfect report design for invoices, statements, production sheets, and management packs
- Strong support for complex tabular reports, print layouts, and multi-page exports
- Broad data connectivity across databases, ERP, CRM, and business systems
- Dashboard creation for real-time monitoring and executive reporting
- Scheduling, permissions, parameterized reports, and mobile access
- Embedded reporting and application-style deployment options
-
Pros & Cons
- Pros: Excellent for formatted enterprise reports; strong for operational reporting; flexible layout control; suitable for large-scale deployment
- Cons: More specialized than lightweight self-service tools; can require planning for full enterprise rollout
-
Best For
- Large enterprises
- Operations-heavy teams
- Finance, manufacturing, logistics, and regulated industries
- Organizations that need both dashboards and print-ready reporting
Power BI
One-sentence overview: Power BI is a strong choice for Microsoft-centric organizations that want scalable BI, dashboards, and online reporting software in one ecosystem.
-
Key Features
- Deep integration with Excel, Teams, Azure, Fabric, and Microsoft 365
- Large connector ecosystem and strong semantic modeling
- Interactive dashboards, ad hoc analysis, and AI-assisted capabilities
- Embedded analytics through Power BI Embedded
- Enterprise governance, security, and sharing controls
-
Pros & Cons
- Pros: Strong value; excellent Microsoft integration; broad community support; scalable across departments
- Cons: Licensing can become complex; advanced modeling and DAX have a learning curve; print-perfect reporting is not its strongest area
-
Best For
- Microsoft-first businesses
- Mid-market and enterprise analytics teams
- Companies standardizing on Azure, Fabric, or Microsoft 365
Tableau
One-sentence overview: Tableau is best for interactive visual analytics and advanced data exploration by analysts and business users.
-
Key Features
- Rich visual exploration and drag-and-drop analysis
- Strong support for data storytelling and interactive dashboards
- Broad data source connectivity
- Good drill-down and exploratory workflows
- Enterprise deployment and governed content sharing
-
Pros & Cons
- Pros: Best-in-class interactive visuals; strong analyst experience; effective for executive dashboards
- Cons: Can be expensive at scale; formatted operational reporting is less central; governance may require deliberate setup
-
Best For
- Data analysts
- Business intelligence teams
- Organizations prioritizing visual discovery over print-style reporting
Zoho Analytics and other notable options
Zoho Analytics
One-sentence overview: Zoho Analytics is a practical option for budget-conscious teams that need broad business reporting and self-service dashboarding.
-
Key Features
- Cloud-based report builder with many business connectors
- Self-service dashboards and charting
- AI-assisted query and insight features
- Collaboration, embedding, and scheduled sharing
- Accessible pricing for smaller teams
-
Pros & Cons
- Pros: Affordable; easy to adopt; good breadth for general reporting
- Cons: Less suited to very complex enterprise reporting workflows; advanced governance may be lighter than heavyweight platforms
-
Best For
- SMBs
- Departmental analytics teams
- Businesses seeking lower upfront cost
Looker
One-sentence overview: Looker is best for organizations that want governed metrics, semantic modeling, and centralized business logic.
-
Key Features
- Semantic layer for metric consistency
- Strong governed analytics workflows
- Embedded analytics support
- Cloud-native architecture
- Integration with modern data stacks
-
Pros & Cons
- Pros: Excellent for standardized KPIs; strong governance; good for mature data teams
- Cons: Setup can be technical; less ideal for teams wanting instant no-code reporting
-
Best For
- Data-mature organizations
- Centralized analytics teams
- Businesses prioritizing metric governance
Qlik Sense

One-sentence overview: Qlik Sense is well suited for associative analysis, guided discovery, and interactive business reporting.
-
Key Features
- Associative data engine for flexible exploration
- Dashboarding and self-service analytics
- Alerting and AI-assisted insights
- Enterprise deployment options
- Embedded and governed analytics support
-
Pros & Cons
- Pros: Distinctive exploration model; strong guided analytics; scalable enterprise use
- Cons: Can require user training; report formatting is not its main strength
-
Best For
- Enterprises with exploratory analytics needs
- Teams comparing multiple dimensions and relationships in data
SAP Crystal Reports
One-sentence overview: SAP Crystal Reports remains relevant for highly formatted legacy reporting requirements and document-style outputs.
-
Key Features
- Highly formatted report templates
- Print-focused layouts
- Parameterized reporting
- Broad historical adoption in enterprise environments
- Structured report distribution workflows
-
Pros & Cons
- Pros: Very strong document formatting; familiar in legacy estates
- Cons: Less modern for cloud-native self-service analytics; not ideal as a primary modern BI platform
-
Best For
- Legacy enterprise reporting environments
- Teams with established formatted report dependencies
What to look for in online reporting software in 2026
Choosing online reporting software in 2026 is no longer just about charts and exports. Most teams now need a blend of self-service analytics, operational reporting, governance, and secure data access across cloud and on-premise systems. The right platform depends on how your organization balances usability with control.
Key evaluation criteria
When comparing reporting tools, focus on these factors:
- Ease of use: Can business users build or modify reports without depending on IT for every change?
- Dashboard flexibility: Does the platform support both interactive dashboards and formal reports?
- Data connectivity: Can it connect to cloud apps, data warehouses, spreadsheets, APIs, and legacy databases?
- Governance: Are role-based permissions, auditability, version control, and data security built in?
- Scalability: Will it perform well as users, reports, and data volumes grow?
- Total cost of ownership: Consider licenses, implementation time, training, infrastructure, and support.
A tool that looks inexpensive at first can become costly if it requires constant technical intervention. Likewise, a powerful enterprise platform can deliver better long-term ROI if reporting is mission-critical.
Which teams benefit most
Online reporting software creates value across multiple functions:
- Executives need dashboards and summary reports for fast decision-making.
- Analysts need ad hoc exploration, drill-downs, and flexible visualizations.
- Operations teams need scheduled reports, exception alerts, and daily process monitoring.
- Finance teams need accurate, formatted, auditable reports with controlled access.
- Product and SaaS teams need embedded reporting for customers and partners.
This is where platform fit matters. FineReport, for example, is especially strong when reporting needs extend beyond dashboards into operational forms, pixel-perfect reports, and high-volume business distribution.
Common trade-offs to expect
Most reporting software falls somewhere between three priorities:
-
- Faster for business users
- Strong for exploratory analysis
- May create governance issues if not managed well
-
Enterprise control
- Better for compliance, standardized metrics, and security
- Often requires stronger admin oversight
- Can slow down initial deployment
-
Implementation speed
- Lightweight tools can launch quickly
- Enterprise platforms may take longer but support broader use cases over time
The key is to align the tool with your reporting reality. If you need controlled board reports, scheduled finance packs, and operational documents, enterprise reporting depth matters more than casual dashboard simplicity.

In-depth comparison of 12 reporting tools for better insights in 2026
Metabase, Domo, and Sisense
Metabase
One-sentence overview: Metabase is a strong open-source and low-cost reporting option for internal teams that want fast setup and straightforward analytics.
-
Key Features
- Open-source deployment option
- No-code query builder and SQL editor
- Dashboards, filters, alerts, and subscriptions
- Embedded analytics options
- Growing semantic and AI-assisted capabilities
-
Pros & Cons
- Pros: Fast to deploy; affordable; good for internal analytics; friendly for smaller teams
- Cons: Enterprise governance depth varies by plan and setup; less ideal for highly formatted reporting
-
Best For
- Startups
- Internal data teams
- Companies wanting a no-cost or low-cost entry point
Domo
One-sentence overview: Domo is a cloud-native reporting and dashboard platform with broad app integrations and strong executive visibility.
-
Key Features
- Large integration library
- Real-time dashboards and mobile-friendly reporting
- Collaboration and alerting features
- Cloud-based deployment
- App and workflow extensions
-
Pros & Cons
- Pros: Strong cloud usability; executive-friendly dashboards; broad integration support
- Cons: Cost can rise quickly; may be more dashboard-centric than report-format-centric
-
Best For
- Fast-moving business teams
- Companies prioritizing cloud dashboards and KPI visibility
Sisense
One-sentence overview: Sisense is well suited for embedded analytics and customizable reporting experiences inside products and portals.
-
Key Features
- Embedded analytics APIs and SDKs
- Flexible deployment and white-labeling
- Customizable dashboards and reporting experiences
- Data modeling capabilities
- Scalable analytics for software products
-
Pros & Cons
- Pros: Strong embedding capabilities; flexible for product teams; customizable user experiences
- Cons: Can require technical resources; not always the simplest option for non-technical teams
-
Best For
- SaaS vendors
- Product teams
- Organizations delivering customer-facing analytics
IBM Cognos Analytics, Yellowfin, and Jaspersoft
IBM Cognos Analytics
One-sentence overview: IBM Cognos Analytics is a governed enterprise reporting platform suited to large organizations with structured planning and compliance needs.
-
Key Features
- Enterprise reporting and dashboarding
- Governance-heavy deployment model
- Scheduling, bursting, and controlled distribution
- AI-assisted insight features
- Strong fit for formal reporting environments
-
Pros & Cons
- Pros: Robust governance; mature enterprise features; strong for controlled reporting
- Cons: Heavier implementation; steeper learning curve than lighter modern tools
-
Best For
- Large regulated enterprises
- Planning-heavy organizations
- Teams needing formal report governance
Yellowfin
One-sentence overview: Yellowfin is designed for collaborative decision-making with a mix of dashboards, storytelling, and alert-driven reporting.
-
Key Features
- Dashboards and interactive reports
- Data storytelling and presentation-oriented workflows
- Signals and alerts for monitoring changes
- Embedded analytics support
- Collaboration features
-
Pros & Cons
- Pros: Good collaborative experience; useful narrative features; suitable for business users
- Cons: Less dominant ecosystem than larger BI vendors; may require evaluation for very large deployments
-
Best For
- Mid-market teams
- Embedded reporting use cases
- Organizations emphasizing communication around insights
Jaspersoft
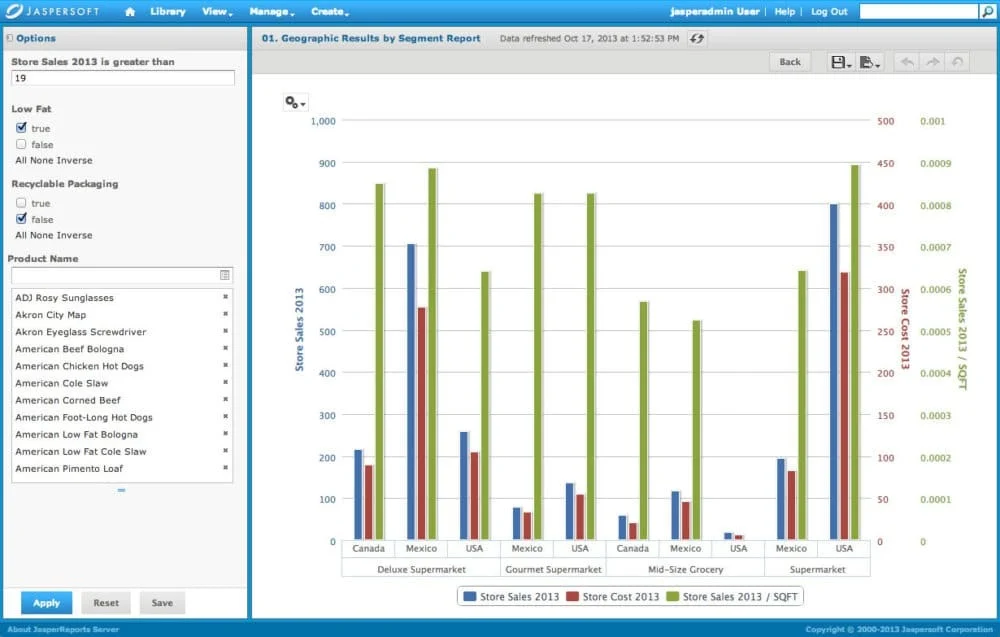
One-sentence overview: Jaspersoft is a developer-friendly reporting platform with flexible deployment and strong embedded reporting capabilities.
-
Key Features
- Embedded reporting and API support
- Pixel-oriented report creation
- Flexible deployment options
- Strong developer control over reporting workflows
- Scheduled distribution and exports
-
Pros & Cons
- Pros: Good for developers; strong embedding; flexible deployment
- Cons: Less polished for pure business-user self-service; may require technical ownership
-
Best For
- ISVs
- Engineering-led teams
- Organizations needing embedded reporting with customization
How the 12 tools differ
Here is the practical difference between the leading online reporting software options in 2026:
-
Pricing model
- Power BI and Zoho Analytics are often attractive on entry price
- Tableau and Domo can get expensive as adoption scales
- FineReport, Cognos, and Sisense are often evaluated based on enterprise scope and use-case depth
- Metabase is one of the strongest low-cost or open-source options
-
Learning curve
- Zoho Analytics and Metabase are easier for beginners
- Power BI becomes more complex with DAX and modeling
- Tableau is intuitive visually but can deepen in complexity
- Cognos, Looker, and some embedded tools need more specialist knowledge
-
Deployment style
- Domo and Zoho Analytics are cloud-first
- FineReport, Jaspersoft, and some enterprise tools offer flexible deployment
- Power BI works strongly in cloud ecosystems but also fits hybrid enterprise environments
-
AI features
- Power BI, Zoho Analytics, Metabase, and several enterprise platforms now include AI-assisted querying or summarization
- AI can speed analysis, but governance and metric consistency still matter more than novelty
-
Reporting depth
- FineReport and SAP Crystal Reports stand out for highly formatted reporting
- Tableau excels in visual exploration
- Power BI offers a balanced BI-and-reporting mix
- Sisense, Metabase, and Jaspersoft are strong in embedded or internal analytics scenarios
Quick guidance by company size
- SMBs: Zoho Analytics, Metabase, Power BI
- Mid-market teams: Power BI, Tableau, Yellowfin, Qlik Sense
- Large enterprises: FineReport, Power BI, Tableau, IBM Cognos Analytics, Looker

FineReport vs Power BI vs Tableau vs Zoho Analytics
Feature-by-feature comparison
When businesses compare online reporting software, these four tools often make the shortlist. Each is strong, but for different reasons.
Data connectors
- FineReport: Strong enterprise data connectivity, especially for operational systems, databases, and mixed environments
- Power BI: Excellent connector breadth, especially in Microsoft and Azure ecosystems
- Tableau: Strong connectivity for analytics and exploration
- Zoho Analytics: Broad business app and cloud connector coverage for general reporting
Visualization depth
- FineReport: Good dashboards, but the real strength is combining dashboards with formatted reporting
- Power BI: Wide chart selection and strong interactive dashboards
- Tableau: Best for deep visual exploration and analytical interaction
- Zoho Analytics: Good range for standard business reporting, though less advanced than Tableau in visual analytics
Scheduling and exports
- FineReport: Strong scheduled reporting, distribution, and export options for enterprise workflows
- Power BI: Good cloud sharing and scheduled refresh, though document-style reporting is less specialized
- Tableau: Strong sharing and subscriptions; more dashboard-led than document-led
- Zoho Analytics: Solid scheduling and sharing for SMB and departmental use
Permissions and governance
- FineReport: Strong role-based controls and enterprise reporting management
- Power BI: Strong governance, especially with Microsoft ecosystem integrations
- Tableau: Good governance, though standardization often depends on implementation discipline
- Zoho Analytics: Adequate for many business teams, but less enterprise-heavy than some larger platforms
Mobile access
All four provide mobile-friendly access, but usability depends on report design. FineReport and Power BI are commonly chosen where business users need both dashboard consumption and distributed reporting across devices.
Embedded reporting
- FineReport: Strong fit for enterprise portals and integrated reporting experiences
- Power BI: Strong via embedded offerings, especially for Microsoft-based environments
- Tableau: Suitable for embedding, especially dashboard experiences
- Zoho Analytics: Useful for lighter embedded and shared analytics use cases
Pros and cons by business scenario
Best choice for highly formatted reports
FineReport is the strongest option if your business relies on complex layouts, multi-band reports, forms, print-ready outputs, or operational documents. This is where many dashboard-first tools fall short.
Best choice for self-service dashboards
Power BI is often the best fit for organizations that want broad self-service analytics at scale, particularly if users are already comfortable with Microsoft tools.
Best choice for executive visibility and visual exploration
Tableau remains one of the top choices for interactive visual storytelling, executive presentation, and deep exploratory analysis.
Best choice for budget-conscious business reporting
Zoho Analytics is often the most practical choice for smaller teams that need capable cloud reporting without enterprise-grade complexity or cost.
Which tool is the best reporting software for your team?
The best reporting software depends on business context:
- Choose FineReport if you need enterprise reporting, formal layouts, operational reports, and strong control over report design and distribution.
- Choose Power BI if you want scalable BI and reporting inside a Microsoft-first ecosystem.
- Choose Tableau if your priority is advanced visual analytics and exploratory dashboards.
- Choose Zoho Analytics if you need affordable online reporting software for general business use.
For many enterprises, FineReport stands out because it covers a gap that dashboard-led tools often leave open: complex, production-grade reporting that still needs modern web delivery, permissions, and scalable management.
How to choose the right online reporting tool
Questions to ask before you buy
Before selecting online reporting software, ask these questions:
What data sources need to be connected?
List every required source:
- ERP and CRM systems
- Cloud databases and warehouses
- Excel and CSV files
- On-premise databases
- APIs and internal applications
If your reporting depends on fragmented operational systems, connectivity flexibility should be a top priority.
How important are governance, auditability, and role-based access?
For finance, healthcare, manufacturing, and enterprise operations, governance is not optional. You may need:
- Row-level permissions
- Audit trails
- Centralized metric control
- Version management
- Secure scheduled distribution
If those requirements are high, tools like FineReport, Power BI, Looker, and Cognos deserve extra attention.
Do you need ad hoc analysis, scheduled reports, or customer-facing embedded analytics?
Different tools shine in different modes:
- Ad hoc analysis: Tableau, Power BI, Metabase
- Scheduled formal reporting: FineReport, Cognos, Crystal Reports, Jaspersoft
- Embedded analytics: Sisense, Jaspersoft, FineReport, Power BI
- General business dashboards: Zoho Analytics, Domo, Qlik Sense
Are there any strong no-cost or low-cost options?
Yes, but they come with trade-offs.
When free plans or open-source tools make sense
Free or low-cost options are ideal when:
- Your team is small
- Reporting is mostly internal
- Governance requirements are limited
- You can tolerate some setup work
- You prioritize speed over enterprise structure
What to expect from Metabase, Power BI Free, and limited-tier products
- Metabase: One of the best low-cost and open-source choices for internal analytics and lightweight reporting
- Power BI Free: Useful for individual analysis, but collaboration and enterprise sharing usually require paid plans
- Zoho Analytics lower tiers: Good for budget-conscious departments, though advanced scale and governance may require higher plans
Low-cost tools can be excellent starting points, but growing organizations often outgrow them when reporting volume, compliance needs, or formatting complexity increases.
Final recommendation shortlist
If you want a quick shortlist of the best online reporting software in 2026, here is the practical summary:
- Best overall for enterprise reporting: FineReport
- Best for Microsoft ecosystems: Power BI
- Best for visual exploration: Tableau
- Best for budget-conscious teams: Zoho Analytics
- Best open-source option: Metabase
If your organization needs more than basic dashboards, FineReport deserves serious consideration. It is especially well suited for enterprises that need online reporting software capable of handling pixel-perfect layouts, operational workflows, secure distribution, and scalable reporting governance in one platform.
FAQs
For enterprise reporting, the best choice usually depends on whether you need pixel-perfect documents, interactive dashboards, or governed analytics. FineReport stands out for highly formatted operational reports, while Power BI and Tableau are stronger for broader BI and visual analysis.
Choose FineReport if you need print-ready, highly structured reports at scale. Choose Power BI if your business is deeply invested in Microsoft, and choose Tableau if interactive data exploration and visual storytelling are your top priorities.
Zoho Analytics is a strong fit for smaller teams that want affordable cloud reporting and self-service dashboards. Other budget-friendly options may work too, but Zoho is often easier to adopt for general business reporting.
The most important features usually include data connectors, dashboarding, scheduled delivery, permissions, and export options. If you need operational or regulated reporting, formatting control and print layout support become especially important.
Yes, many online reporting platforms support embedded analytics for customer portals, internal systems, or SaaS products. FineReport, Power BI, Looker, and several others offer embedding options, though the setup and flexibility vary by platform.


The Author
Yida Yin
FanRuan Industry Solutions Expert
Related Articles

10 Investment Performance Reporting Software Tools for RIAs and Family Offices: Features, Trade-Offs & Best-Fit Use Cases
$1 is a flexible $1 and dashboard platform that helps firms build highly customized, branded performance reports and analytics workflows from complex $1. 10 tools RIAs and family offices should compare 1. Addepar One sen
Yida Yin
Jun 18, 2026

10 Best Expense Reporting Software Tools in 2026: Features, Pros, Cons & Best Use Cases
$1 is an enterprise $1 platform that helps finance teams turn expense data from multiple systems into fast, customizable, decision ready reports. 10 best expense management software tools in 2026 1. Expensify One sentenc
Yida Yin
Jun 18, 2026

Expense Reporting Explained: Process, Policy, and Approval Workflow for Finance Teams
Expense reporting is the operational process finance teams use to collect, review, approve, and reimburse employee business expenses with accuracy and control. When this process is unclear or manual, finance leaders face
Yida Yin
Jun 18, 2026