You want to find the best data observability tools for 2025 because data-driven organizations move fast. Staying ahead means you need data observability solutions that tackle reliability and quality issues before they affect your business intelligence. In 2024, 76% of organizations said OpenTelemetry tools are important, but 84% still struggle with tool overload and complexity. Take a look at this:
| Evidence | Explanation |
|---|---|
| 92% of data leaders say data observability will be a core part of their data strategy over the next 1–3 years. | Data observability is crucial for improving reliability and quality. |
| Automated monitoring and alerting help teams fix data issues fast. | You get more accurate insights for your business. |
Data observability tools provide real-time, end-to-end monitoring of data quality, integrity, and pipeline health so you can quickly detect, diagnose, and fix issues before they impact your analytics.Here are 12 best data observability tools you can try:
Choosing a platform that fits your needs matters. Look for integration, scalability, and real-time features. Platforms like FanRuan’s FineDataLink support seamless data integration and governance, making your data stack stronger.
You probably hear a lot about data observability tools, but what do they actually do? These tools help you monitor, track, and analyze data as it moves through your pipelines. You get real-time insights into data quality, performance, and integrity. This means you can spot problems before they turn into bigger issues.
Here’s what you can expect from data observability tools:
You also get end-to-end visibility. If something goes wrong, these tools use machine learning to surface anomalies and give you context, like recent pipeline runs or where the problem started. This helps you fix issues fast and keep your data reliable.
Modern business intelligence and analytics platforms depend on trustworthy data. If you want your reports and dashboards to tell the truth, you need to know your data is accurate and available. Data observability tools automate the process of finding and fixing data problems. You don’t have to spend hours hunting down errors.
Here’s why these tools matter for your data stack:
Gartner’s research shows that only 20% of analytic insights lead to real business outcomes. Poor data quality is a big reason why many projects fail. With data observability tools, you can keep your data reliable, secure, and accurate. This means you make better decisions and run your business with confidence.

If you want to build a reliable data stack, you need to know which platforms stand out. Here are the best data observability tools you should watch in 2025. Each one brings unique features to the table, helping you tackle data quality, reliability, and anomaly detection with confidence.
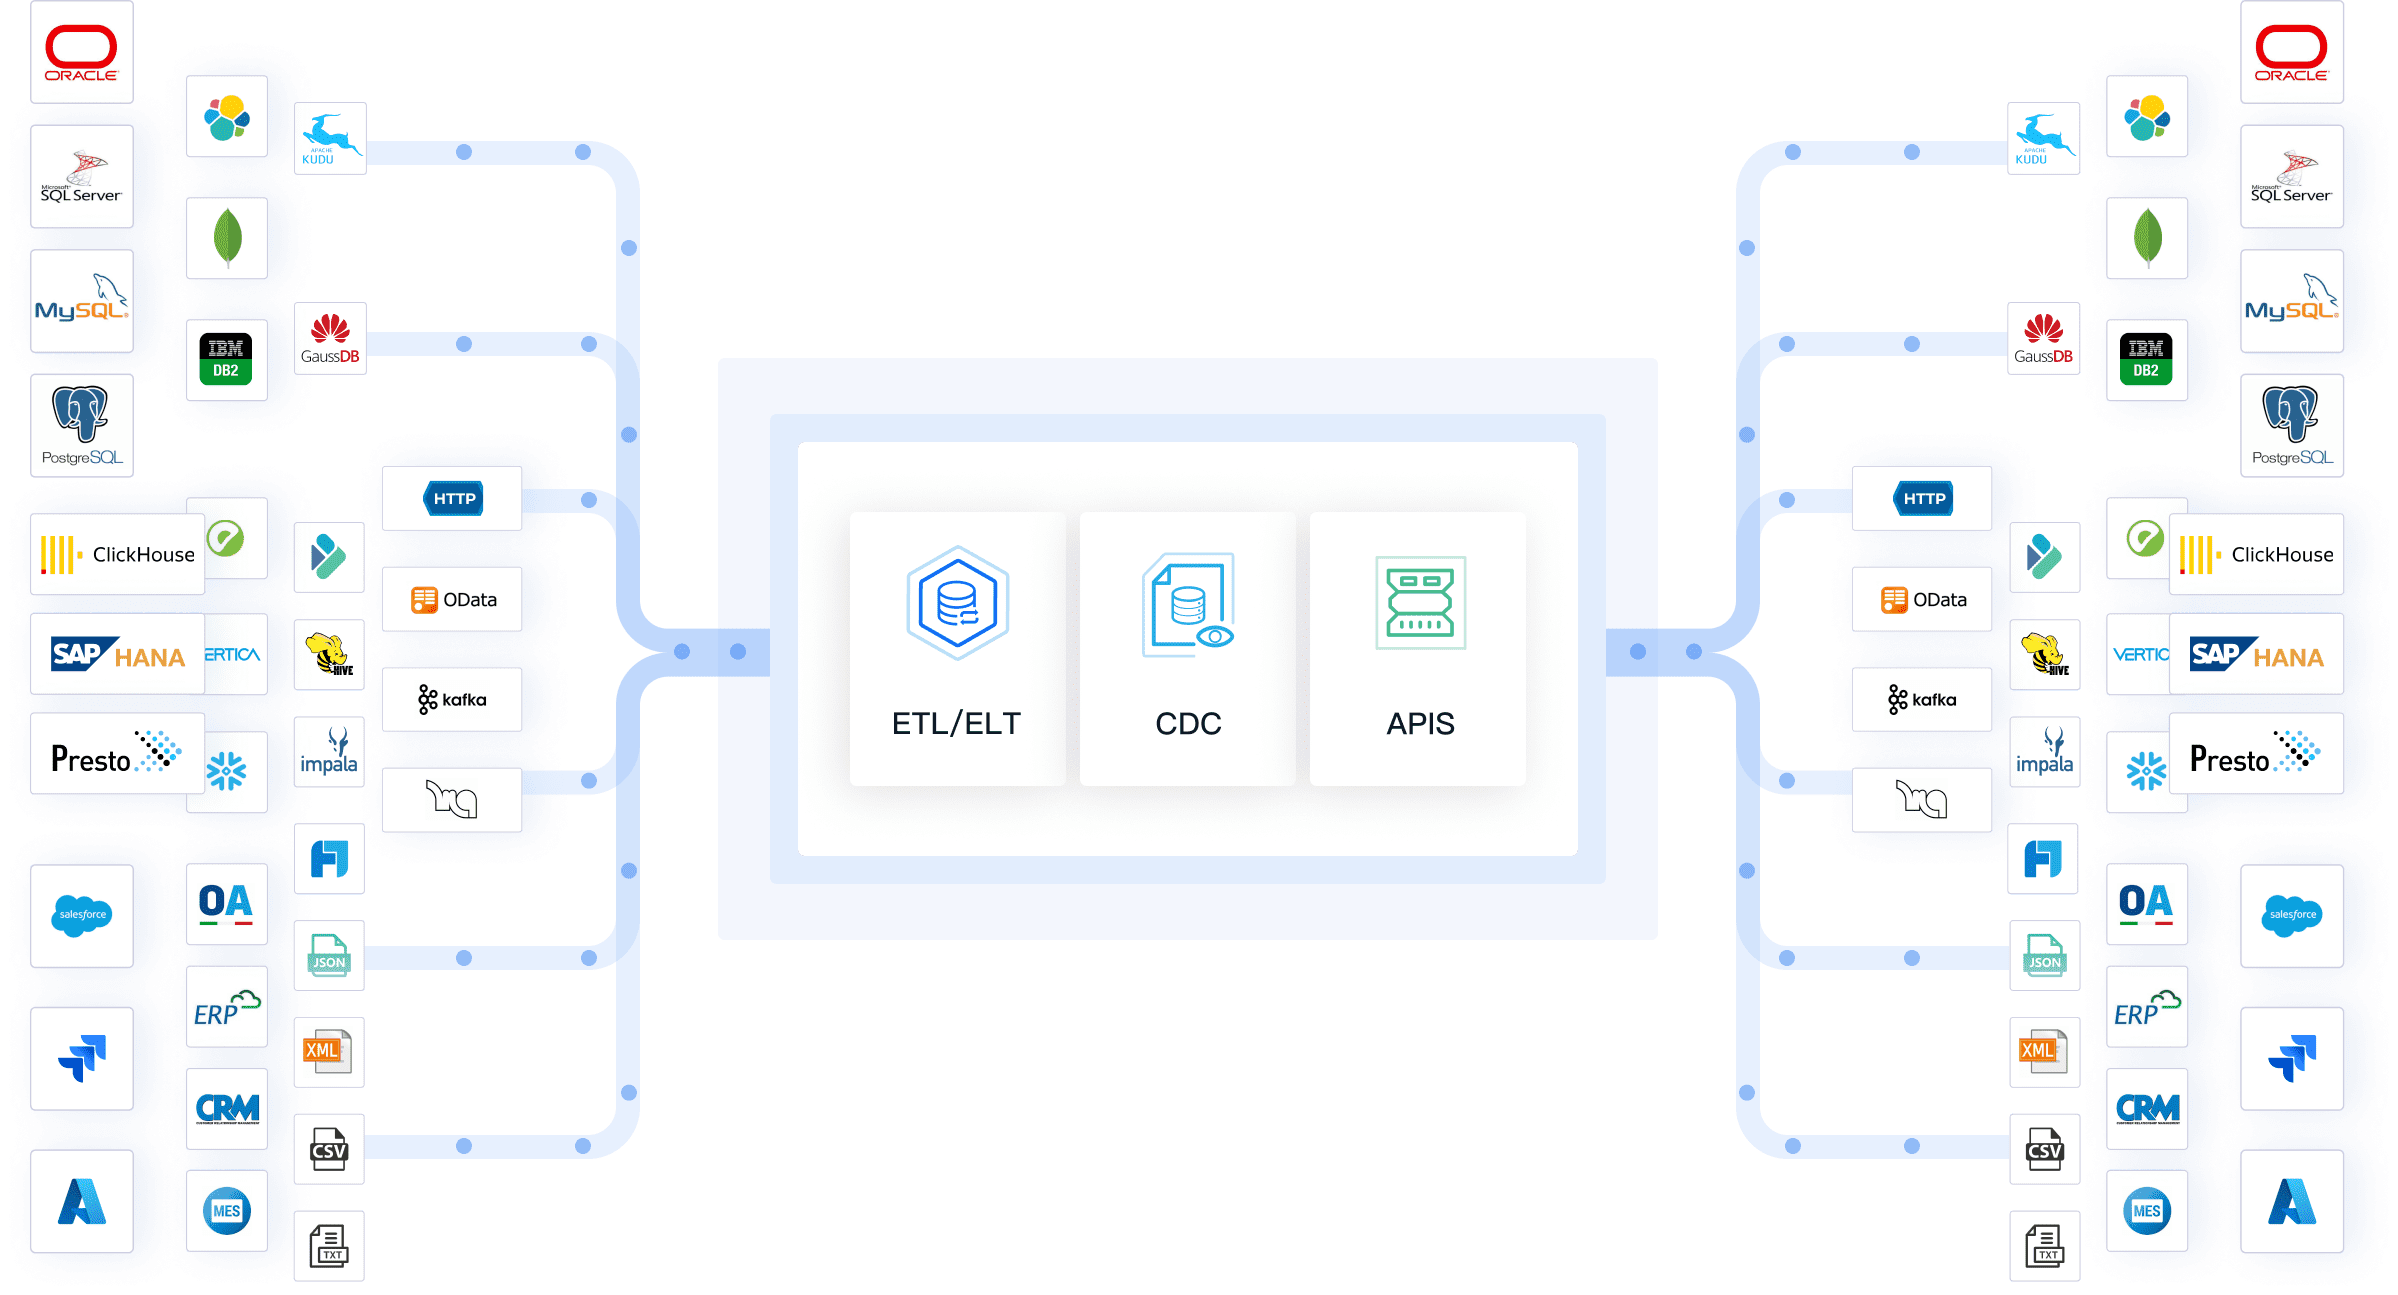
FanRuan FineDataLink stands out for its integration and governance capabilities. You can collect data from many sources, including relational and non-relational databases, interfaces, and files. The platform synchronizes data in real time, so you always have up-to-date information. You build enterprise-level data assets using APIs for easy sharing and interconnection. FineDataLink lets you schedule tasks flexibly and monitor everything in real time, reducing your workload.
Website: https://www.fanruan.com/en/blog/data-warehouse-solutions
| Feature | Description |
|---|---|
| Multi-source data collection | Supports relational, non-relational, interface, and file databases. |
| Non-intrusive real-time sync | Synchronizes data across tables or databases with time sensitivity. |
| Low-cost data service construction | Builds enterprise-level data assets with APIs for sharing. |
| Efficient operation and maintenance | Flexible scheduling and real-time monitoring reduce workload. |
| High extensibility | Built-in Spark SQL supports calling scripts like Shell. |
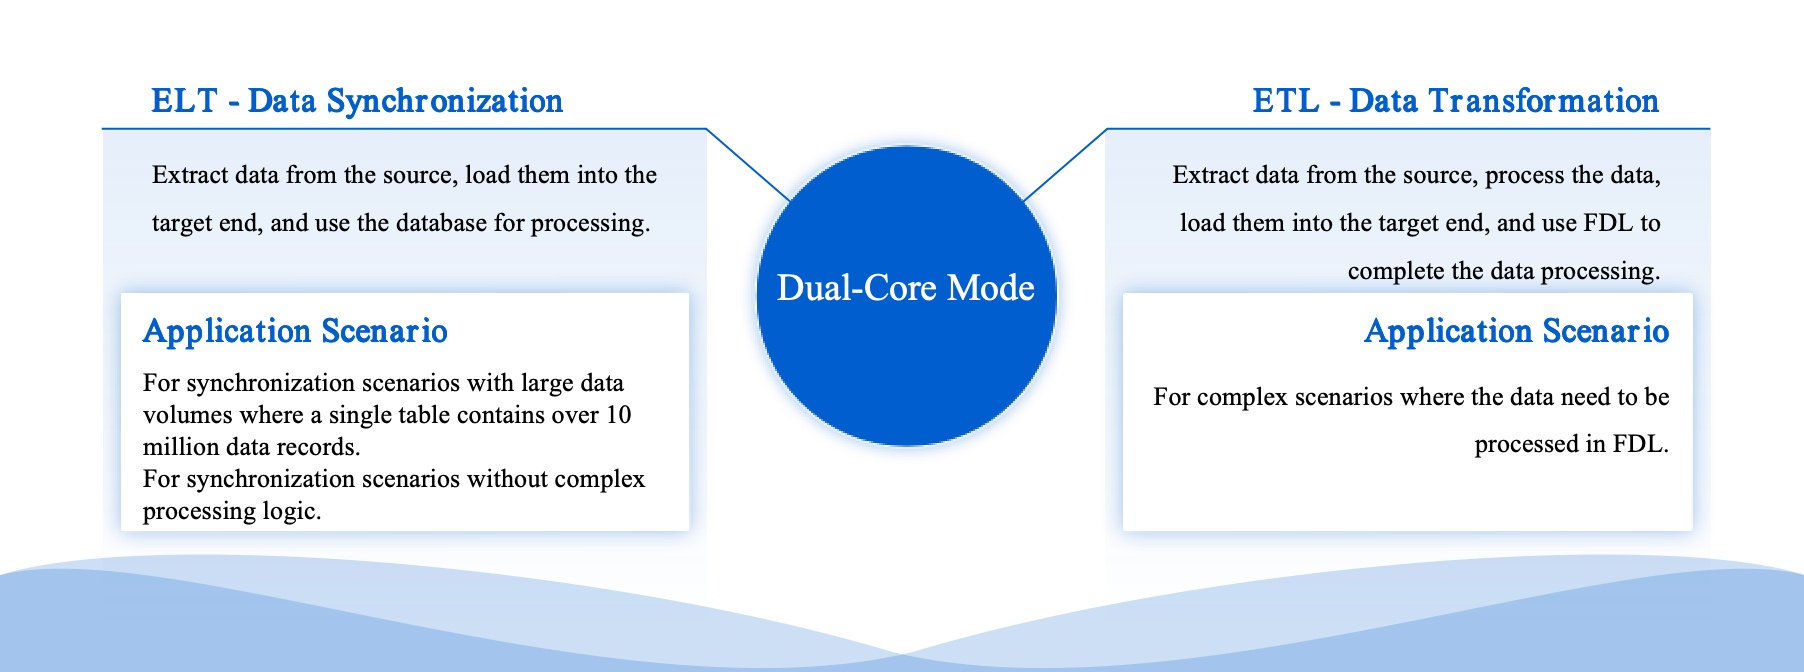
| Efficient data development | Dual-core engine for ELT and ETL processes. |
| Five data synchronization methods | Timestamp, trigger, full-table comparison, full-table increment, and log parsing. |
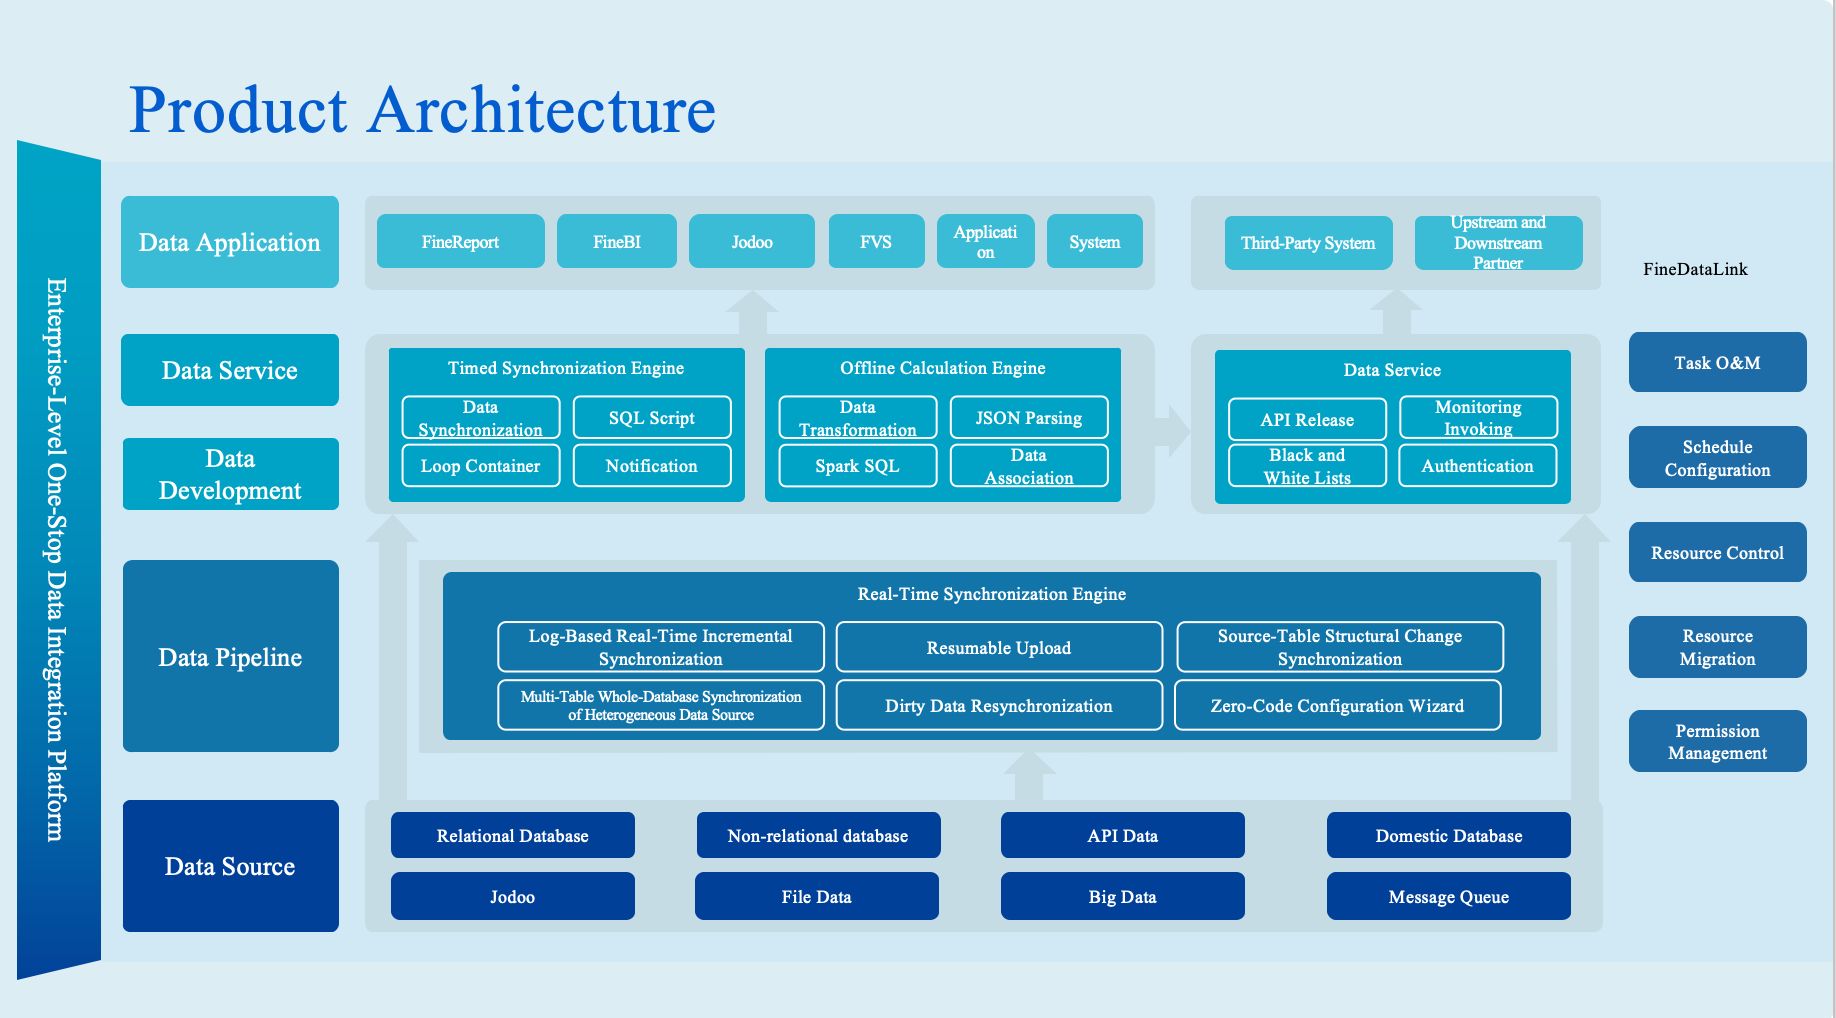
FineDataLink’s features make it easy to manage, integrate, and govern your data. If you want a user-friendly platform with strong real-time capabilities, this is one of the best data observability tools for 2025.
Monte Carlo is a favorite among data teams. You get immediate value because it integrates deeply with your systems and puts users first. The platform helps you reduce risk by maintaining compliance and spotting coverage gaps using automated checks and AI profiling. You can monitor data quality and lineage across your entire stack, so you always know where your data comes from and how it moves.
Website: https://www.montecarlodata.com/
Here’s a quick look at what makes Monte Carlo different:
| Unique Strengths and Differentiators | Description |
|---|---|
| Immediate Value | Delivers benefits from day one with deep integrations and user-first design. |
| Risk Reduction | Maintains compliance and identifies gaps using automated checks and AI profiling. |
| Comprehensive Monitoring | Extends automated data quality monitoring and lineage across the stack for scalable management. |
If you want a tool that covers everything from anomaly detection to compliance, Monte Carlo is a solid choice.
Acceldata gives you end-to-end monitoring and validation. You see real-time insights on a centralized dashboard, and the alerting system keeps you updated about any issues. The platform enforces data quality standards with advanced governance features. You also get granular access controls, encryption, and data masking, which help you keep your data secure.
Website: https://www.acceldata.io/
Acceldata’s features make it easy to spot problems and optimize your data pipelines. If you want strong governance and security, this tool stands out.
AppDynamics helps you see how your data and applications perform in real time. You track key indicators like transaction times and error rates, so you know when something goes wrong. The platform flags problems immediately and gives you context for fast troubleshooting. You can align application performance with business outcomes, which means you see how technical issues affect revenue.
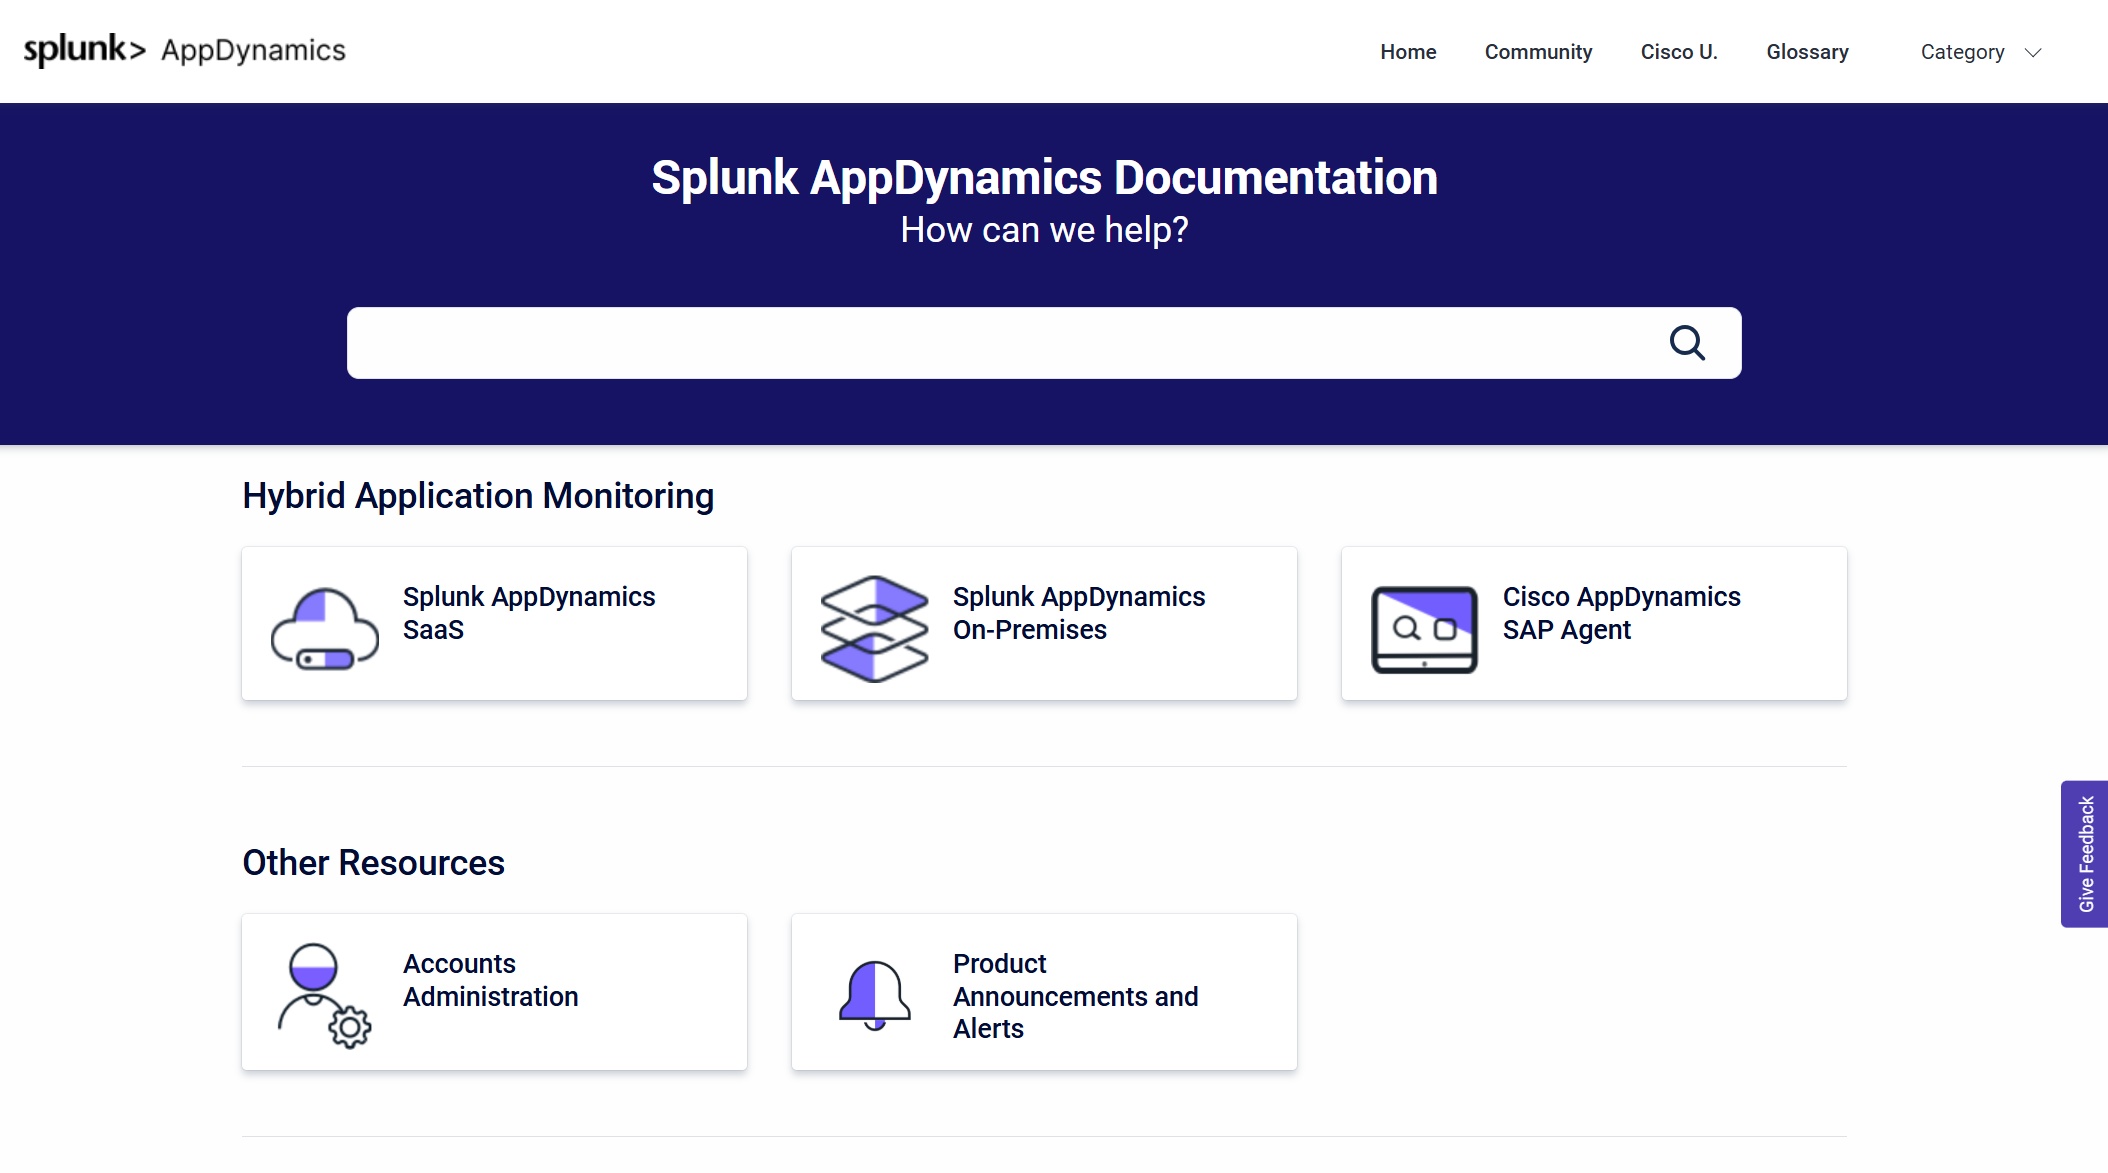
Website: https://docs.appdynamics.com/
| Feature | Description |
|---|---|
| Real-time Monitoring | Tracks performance indicators to ensure service quality. |
| Incident Response | Flags problems and provides context for rapid troubleshooting. |
| Business-Centric Monitoring | Connects application performance with business outcomes. |
| Scalability | Handles large data streams from complex environments. |
| End-User Experience Monitoring | Captures data on user interactions for a seamless experience. |
| Integration with DevOps Practices | Supports continuous delivery pipelines for agile practices. |
AppDynamics bridges IT and business, helping you understand how data issues impact users and revenue. Its features make it a top pick for enterprise environments.
Amazon CloudWatch is a go-to tool for AWS users. You collect and store metrics from different services, publish custom metrics, and manage logs with real-time analysis. The platform lets you set alarms and notifications, so you react quickly to changes. You can visualize metrics and logs on customizable dashboards and monitor events in near real time.
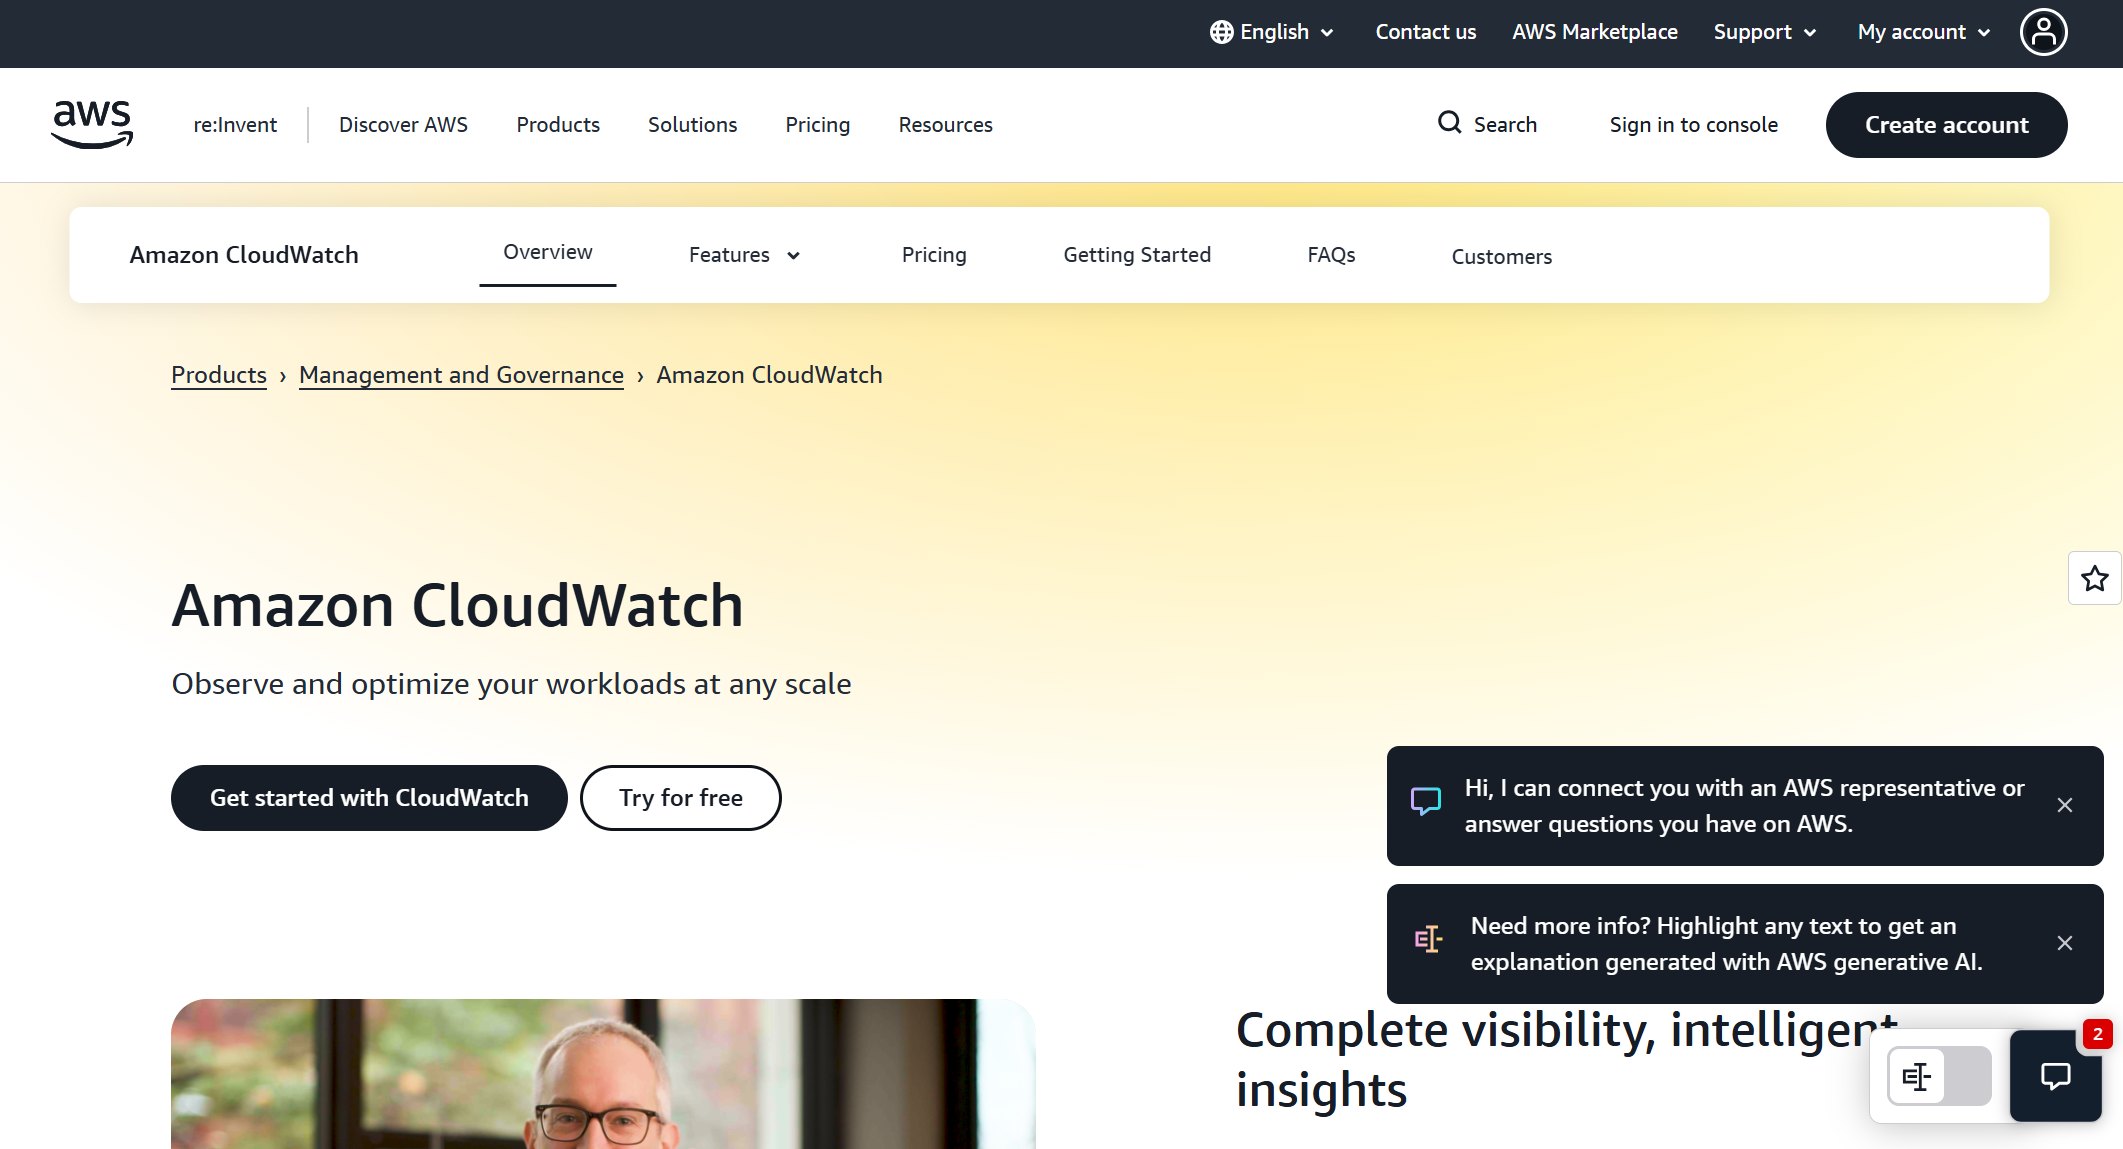
Website: https://aws.amazon.com/cloudwatch/
| Key Feature | Description |
|---|---|
| Metrics Collection | Collects and stores metrics from AWS services and custom sources. |
| Logs Management | Monitors and stores log files with real-time analysis. |
| Alarms and Notifications | Triggers alerts or automated actions based on thresholds. |
| Dashboards | Visualizes metrics and logs for real-time monitoring. |
| Events | Streams system events for automated actions. |
| Integration with AWS Services | Seamlessly connects with AWS services for full-stack monitoring. |
| Cross-Account and Cross-Region | Consolidates metrics and logs across accounts and regions. |
| Automatic Scaling | Scales resources automatically based on metrics and events. |
CloudWatch’s features help you keep your AWS environment healthy and responsive. If you want real-time monitoring and automation, this tool delivers.
Datadog leads the market with AI-driven anomaly detection. You get proactive alerts before issues affect users. The platform combines performance metrics with security events, giving you complete visibility across your IT infrastructure. Datadog’s features include real-time identification and resolution of data issues, so you stay ahead of problems.
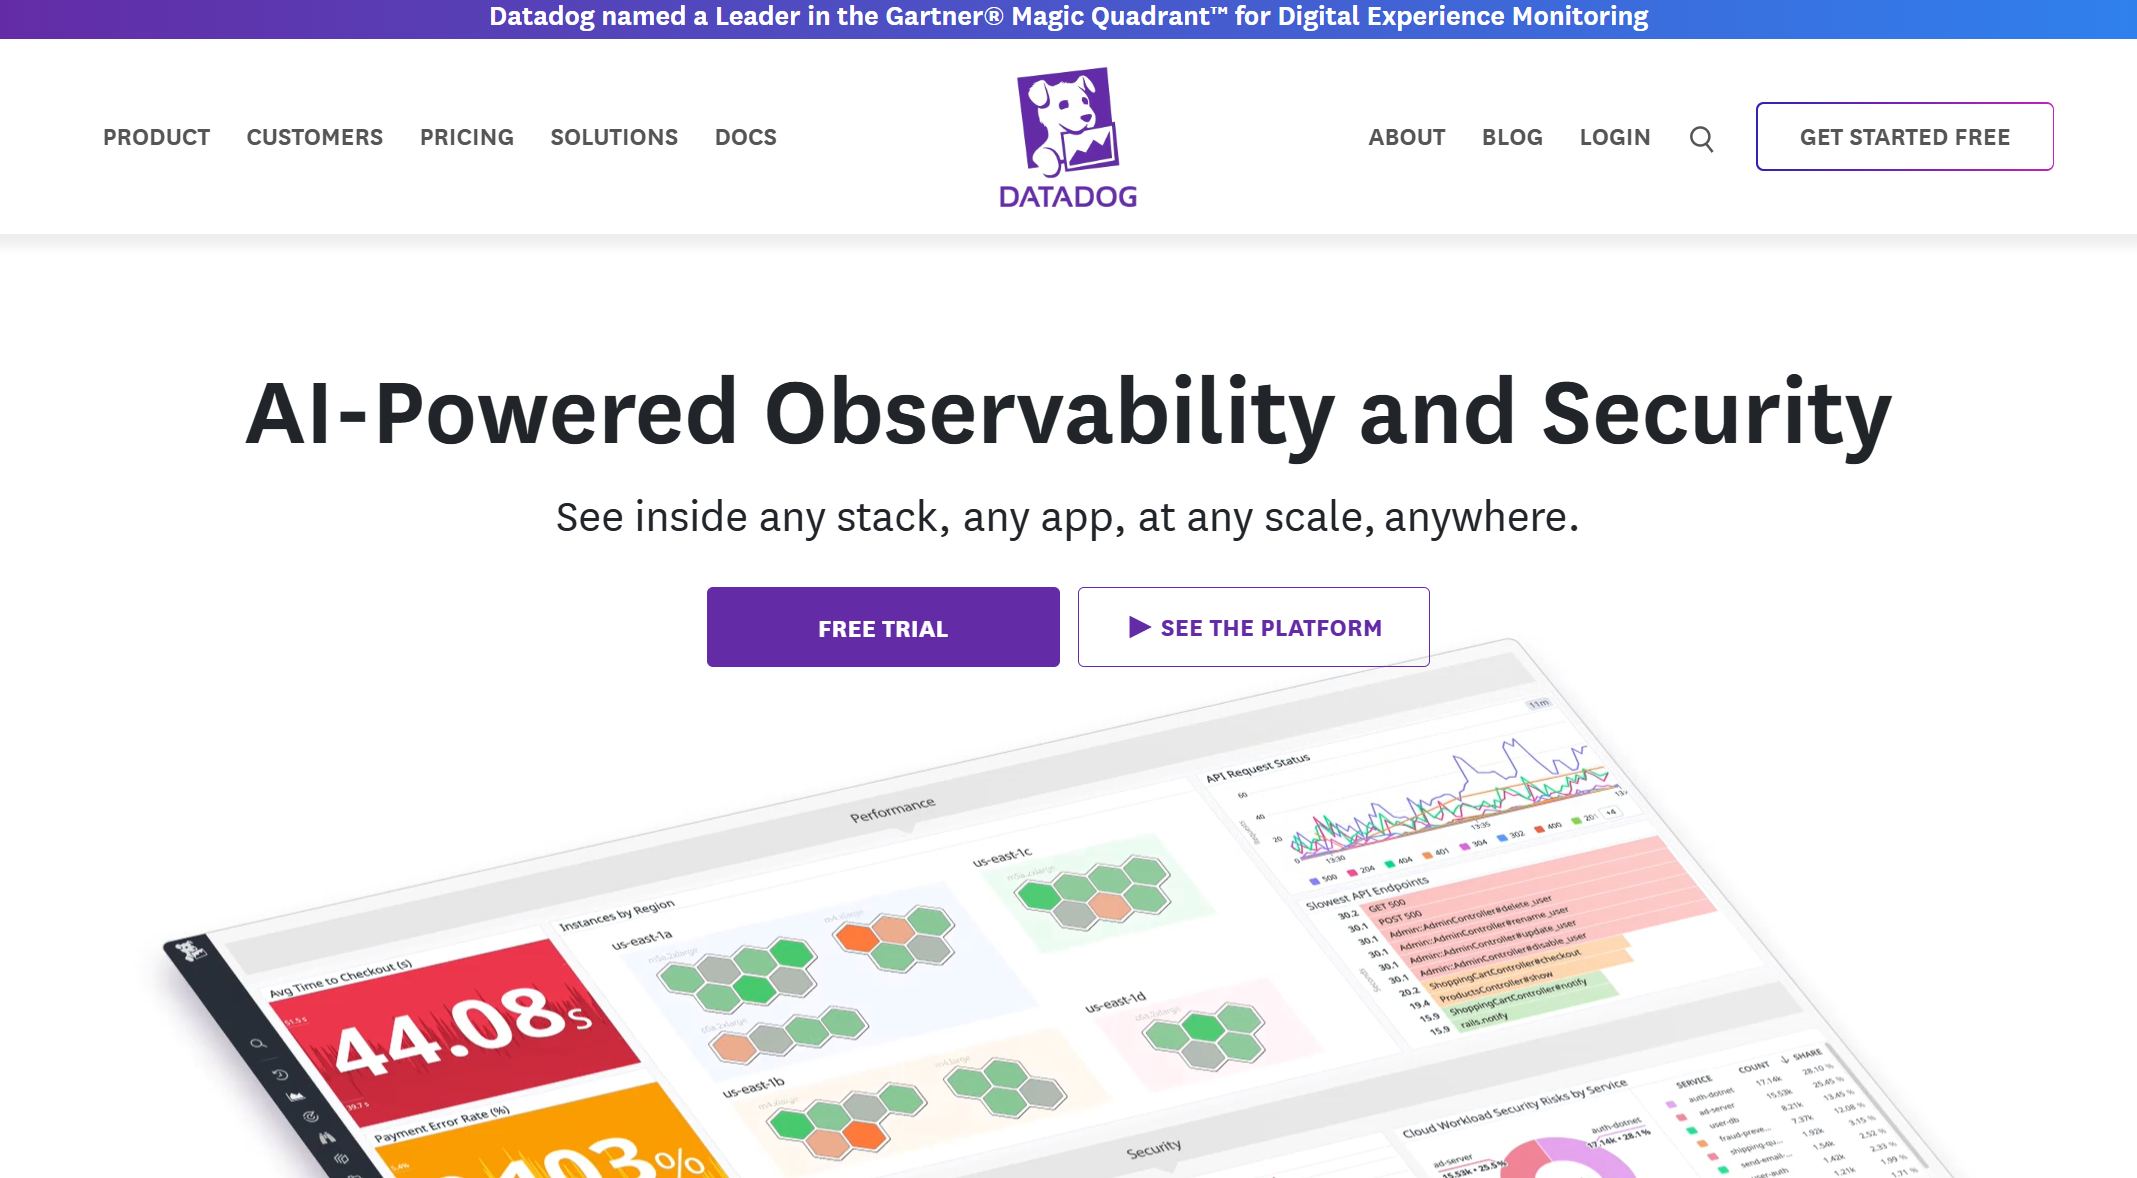
Website: https://www.datadoghq.com/
| Feature | Description |
|---|---|
| AI-driven anomaly detection | Identifies and resolves data issues in real time. |
| Security Monitoring and Application Security | Combines performance metrics with security events for full visibility. |
If you want a tool that excels at anomaly detection and security, Datadog is one of the best data observability tools available.
Dynatrace focuses on keeping your data fresh and reliable. You get alerts for issues like out-of-stock inventory and unexpected changes in data volume. The platform observes data distribution patterns and tracks schema changes, so you prevent broken reports and dashboards. You also see the lineage of your data, which helps you resolve root causes quickly.
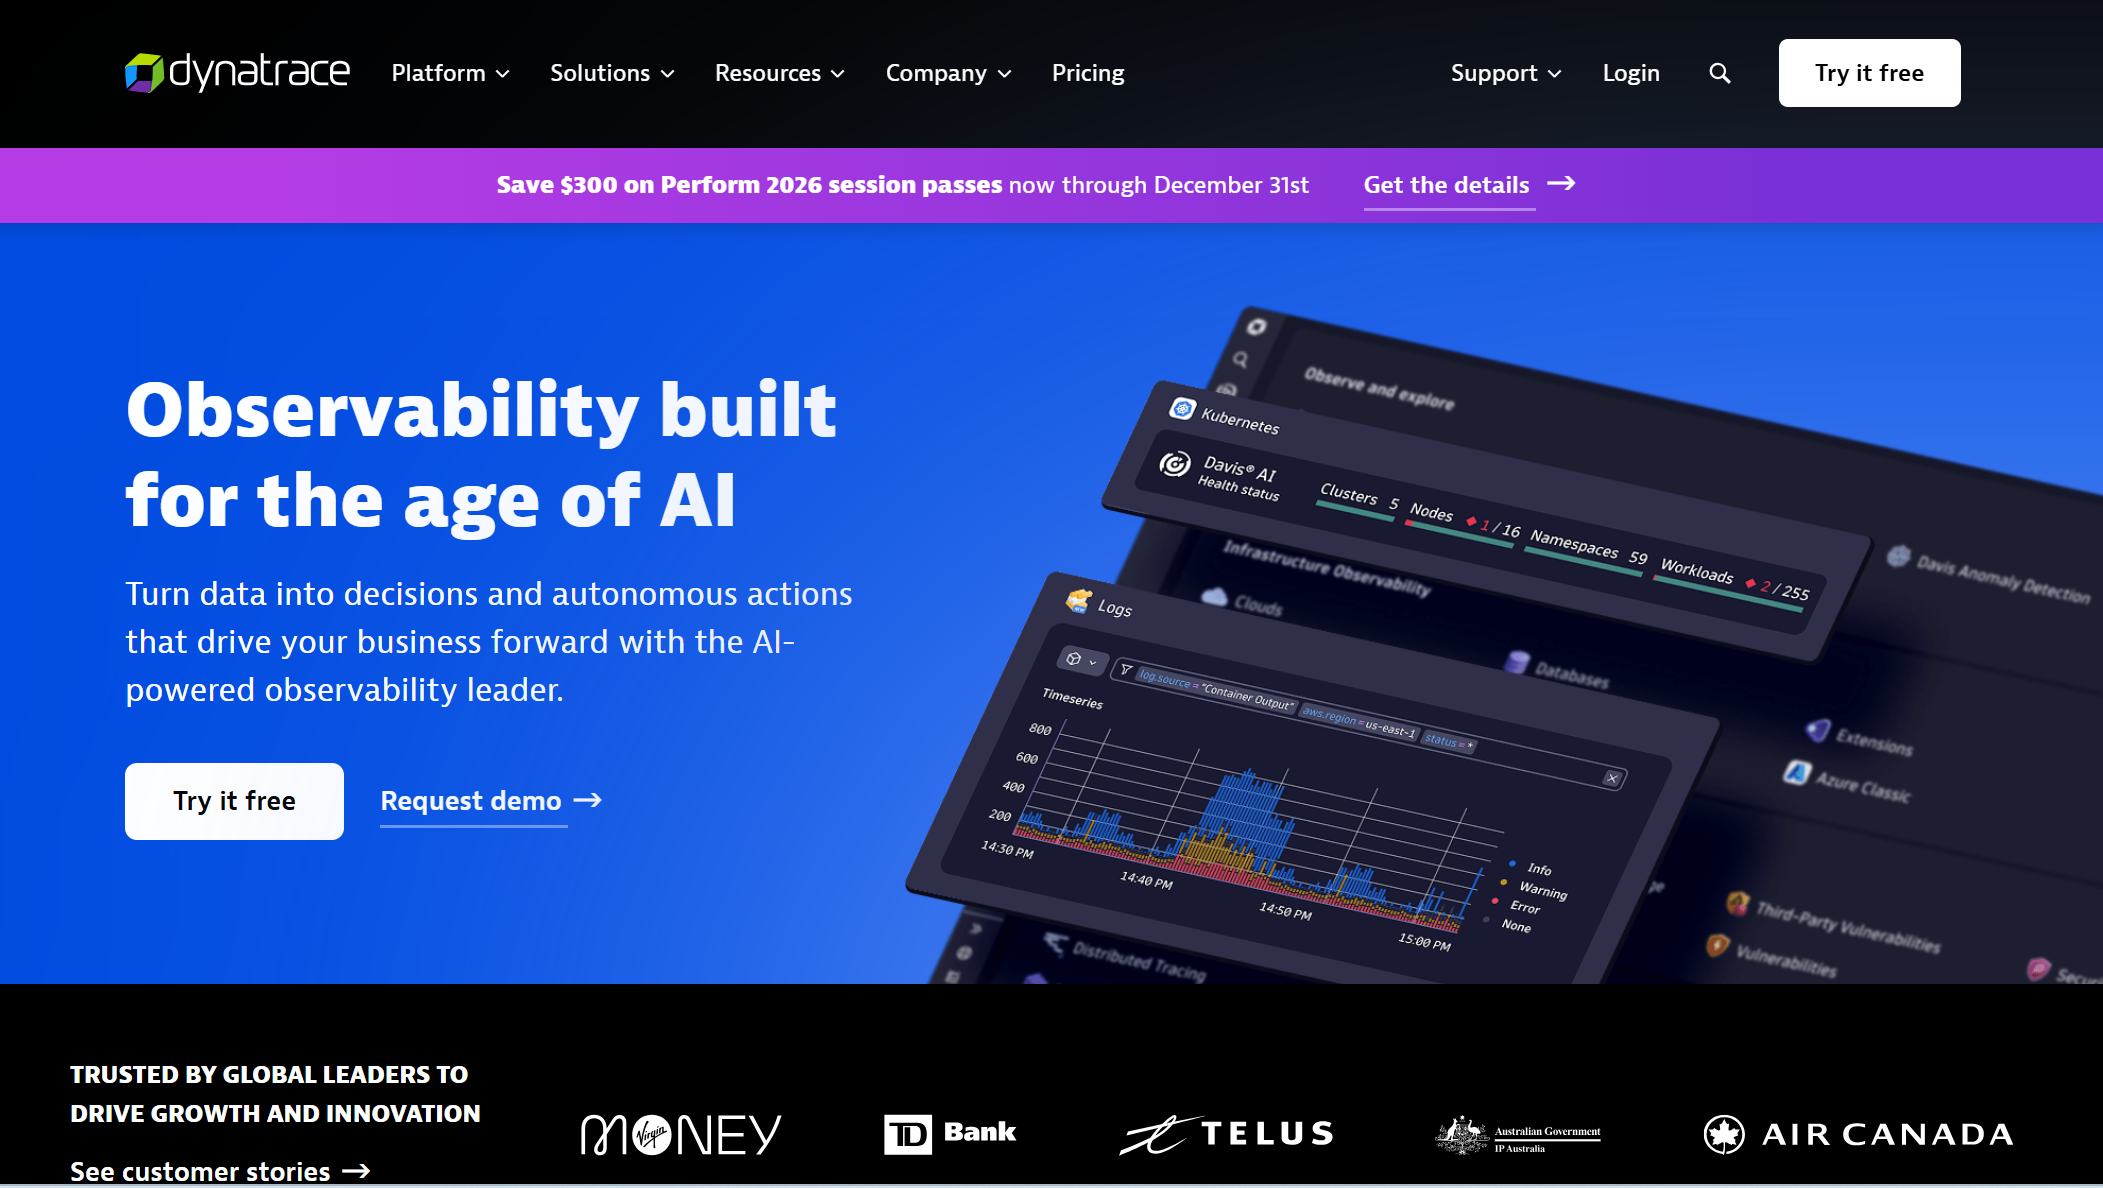
Website: https://www.dynatrace.com/
| Feature | Description |
|---|---|
| Freshness | Alerts you to issues with timely data for analytics. |
| Volume | Monitors changes in data volume to spot problems. |
| Distribution | Observes data spread for collection or processing issues. |
| Schema | Tracks structure changes to prevent broken reports. |
| Lineage | Shows data origins for proactive issue resolution. |
| Availability | Monitors infrastructure to alert on abnormalities affecting data flow. |
Dynatrace’s features make it easy to maintain data quality and spot anomalies before they impact your business.
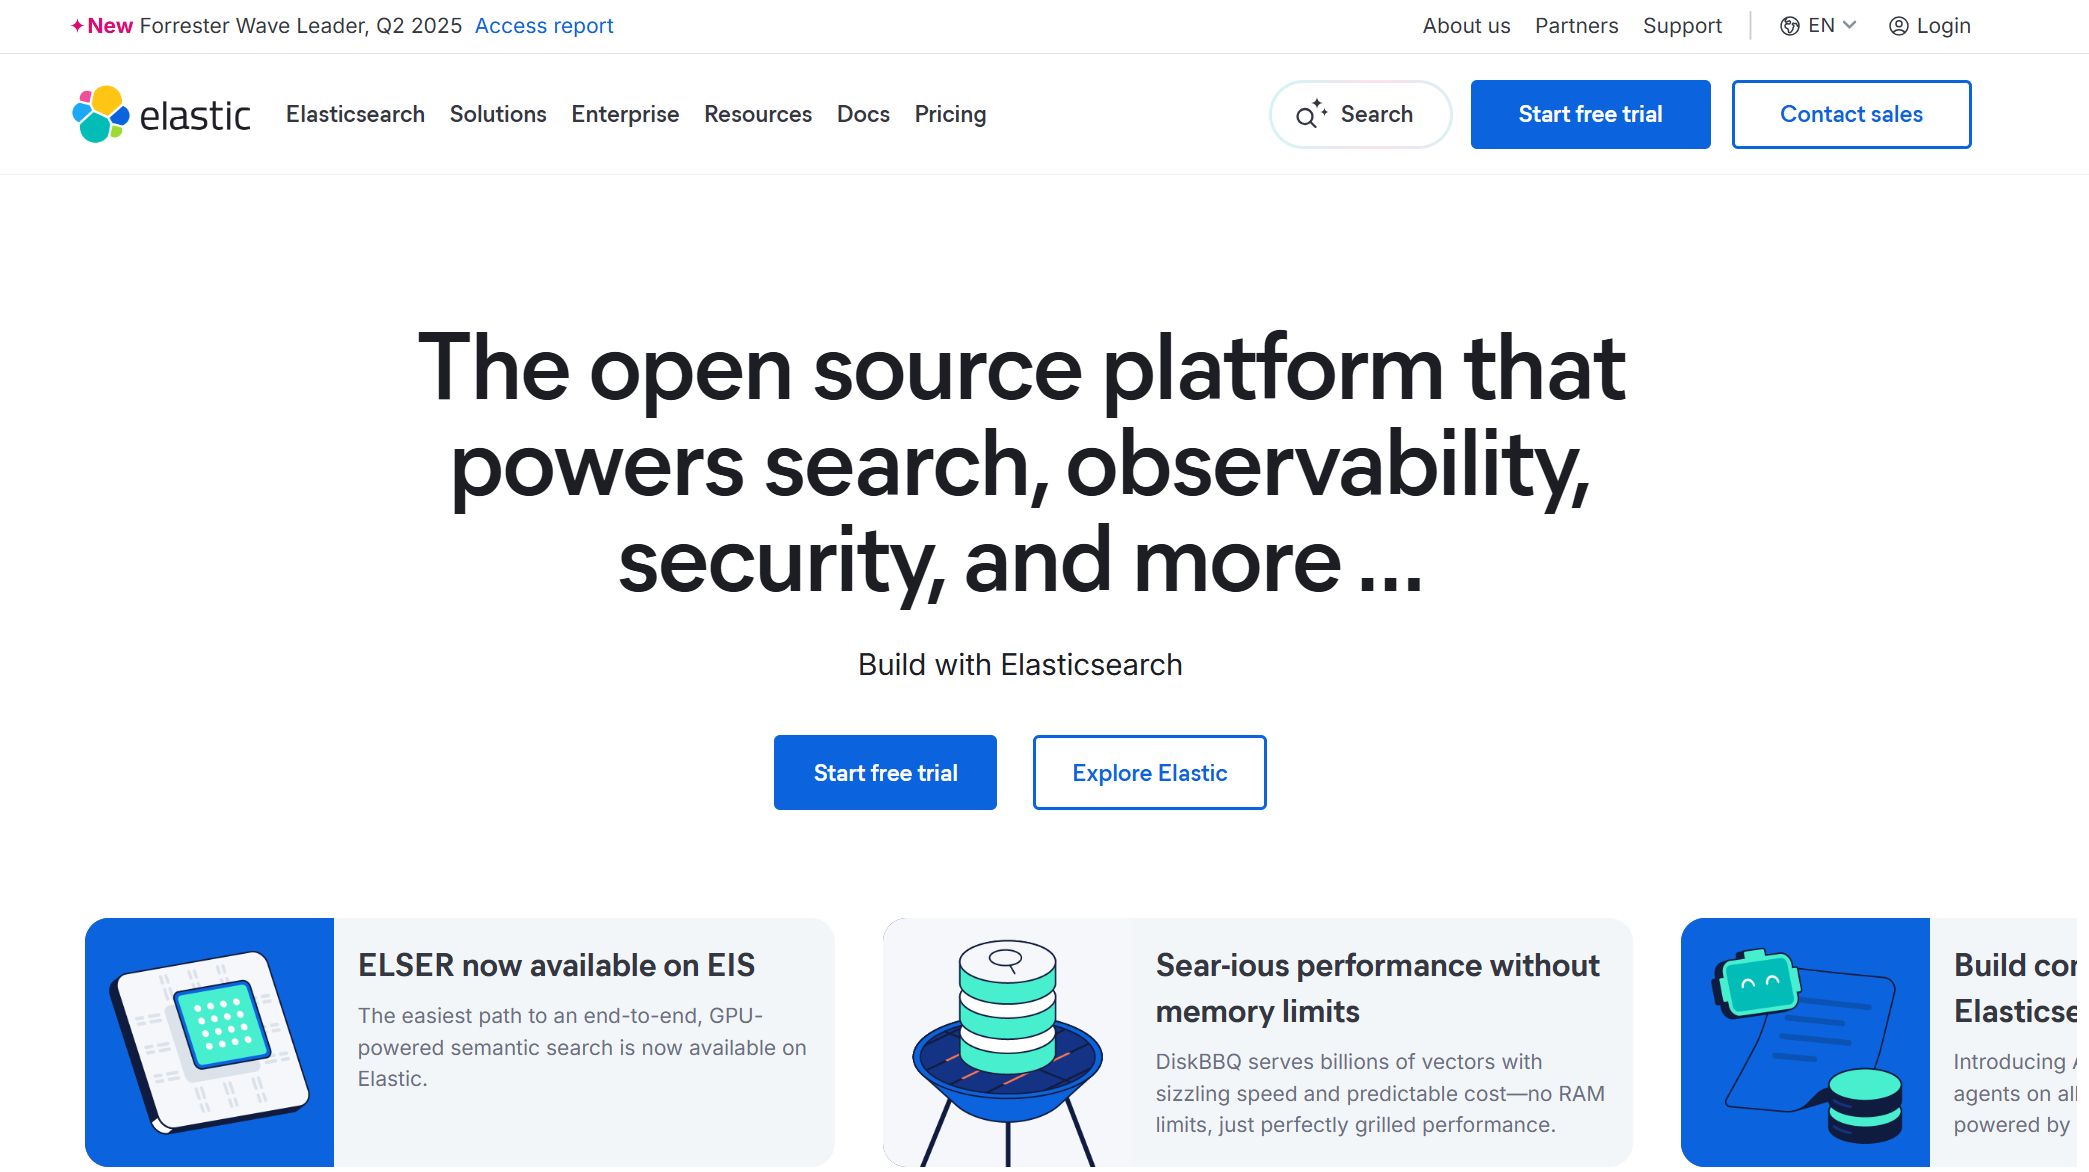
Elastic Observability helps you make faster decisions and release applications quickly. You get immediate access to operational data, which improves client service. The platform gives decision-makers comprehensive access to data, boosting confidence and speed. You also see improved application performance and fewer support tickets thanks to proactive monitoring and automated actions.
Website: https://www.elastic.co/
Elastic’s features help you control complex data pipelines and automate routine tasks. If you want visibility and efficiency, this tool is a strong contender among the best data observability tools.
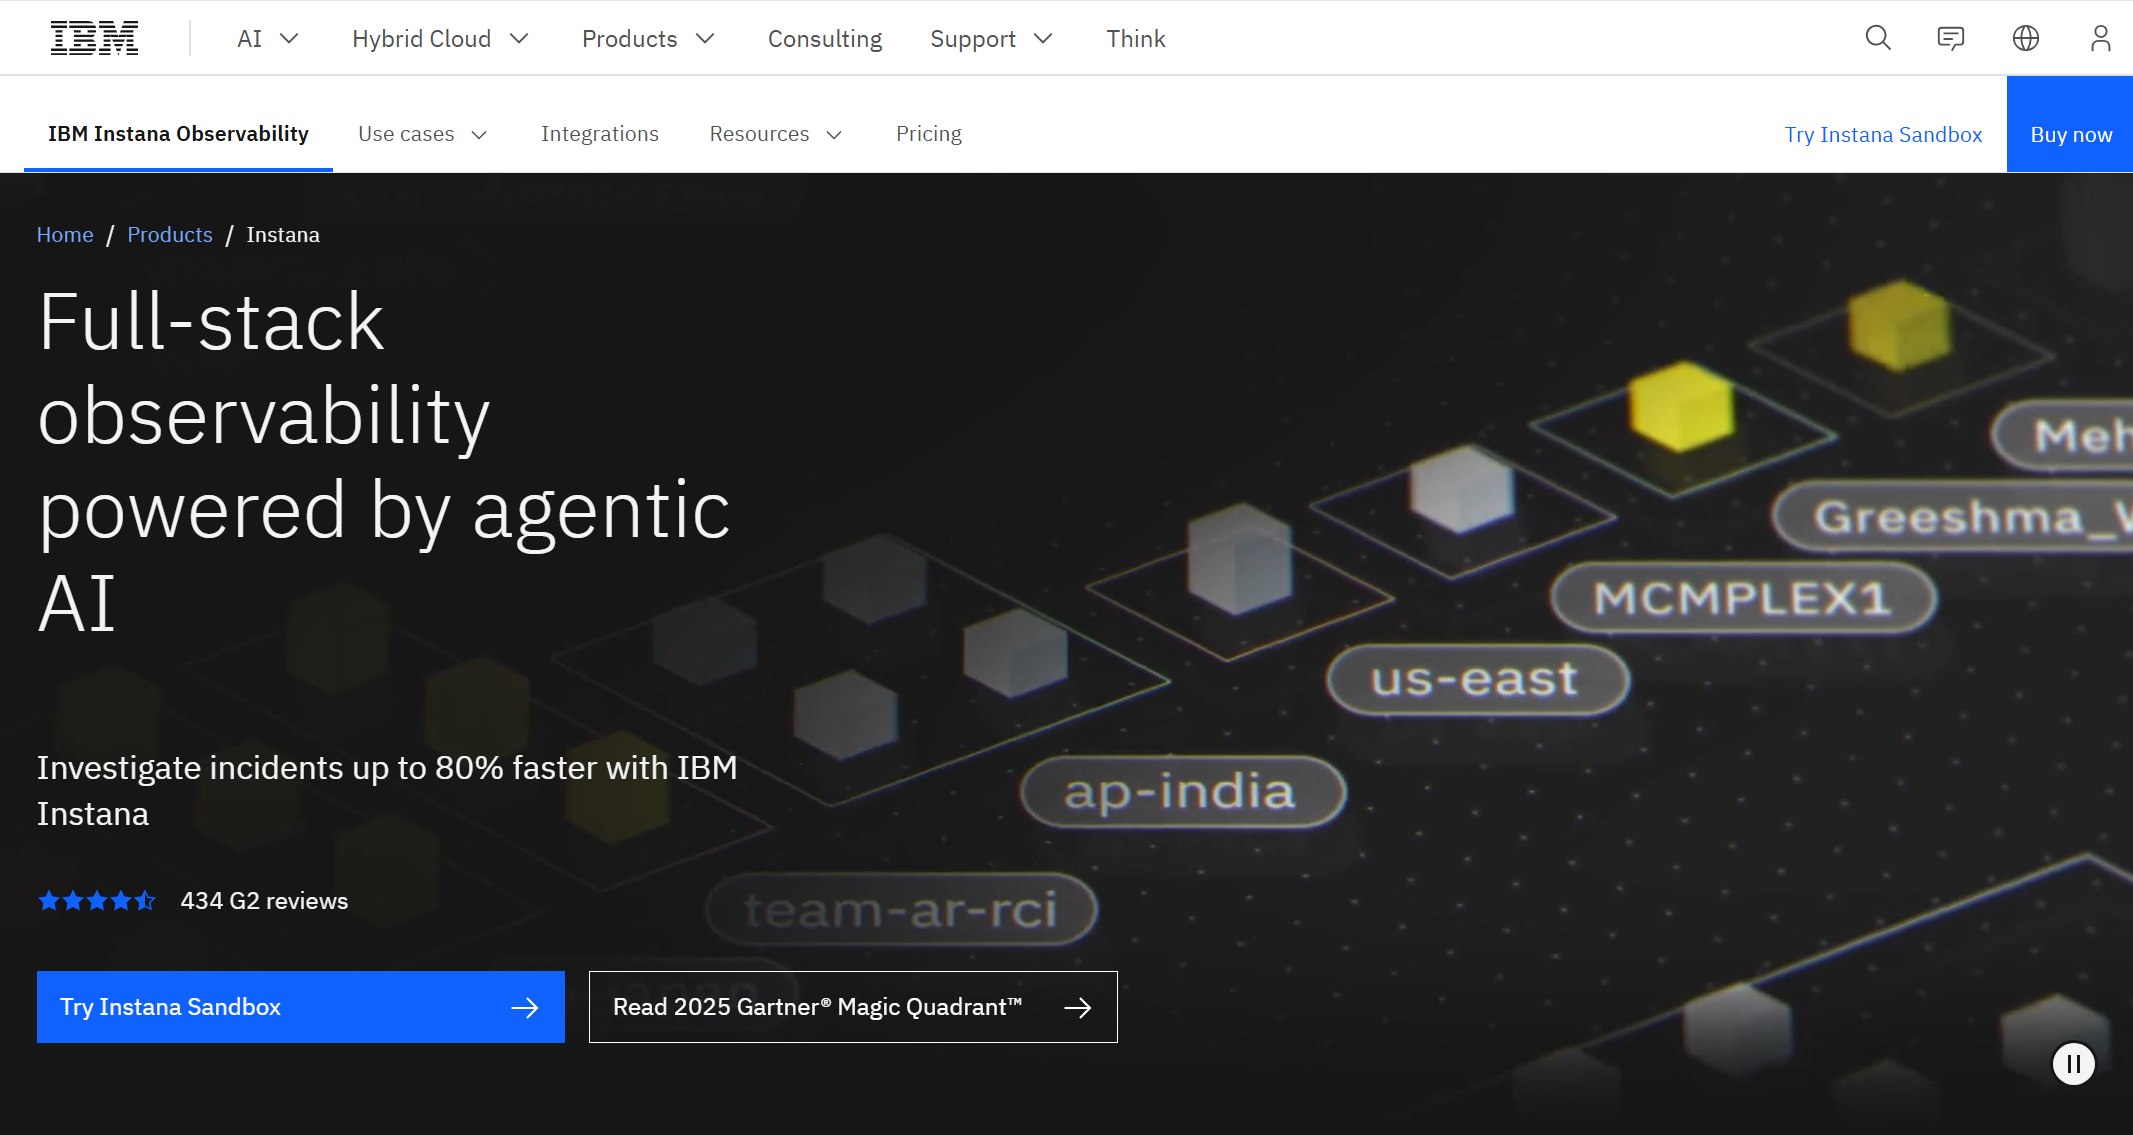
Instana gives you real-time insights into application and infrastructure performance. You get automated root cause analysis, so you resolve issues fast. The platform supports a wide range of technologies, offering comprehensive monitoring options. You can track application performance, user experience, APIs, and business processes.
Website: https://www.ibm.com/products/instana
| Feature | Description |
|---|---|
| Real-time insights | Immediate visibility into performance. |
| Automated root cause analysis | Quickly finds and resolves issues. |
| Support for various technologies | Monitors many technologies for full coverage. |
| Comprehensive monitoring capabilities | Tracks application performance and user experience. |
Instana’s features make it easy to monitor everything in real time and catch anomalies before they become problems.
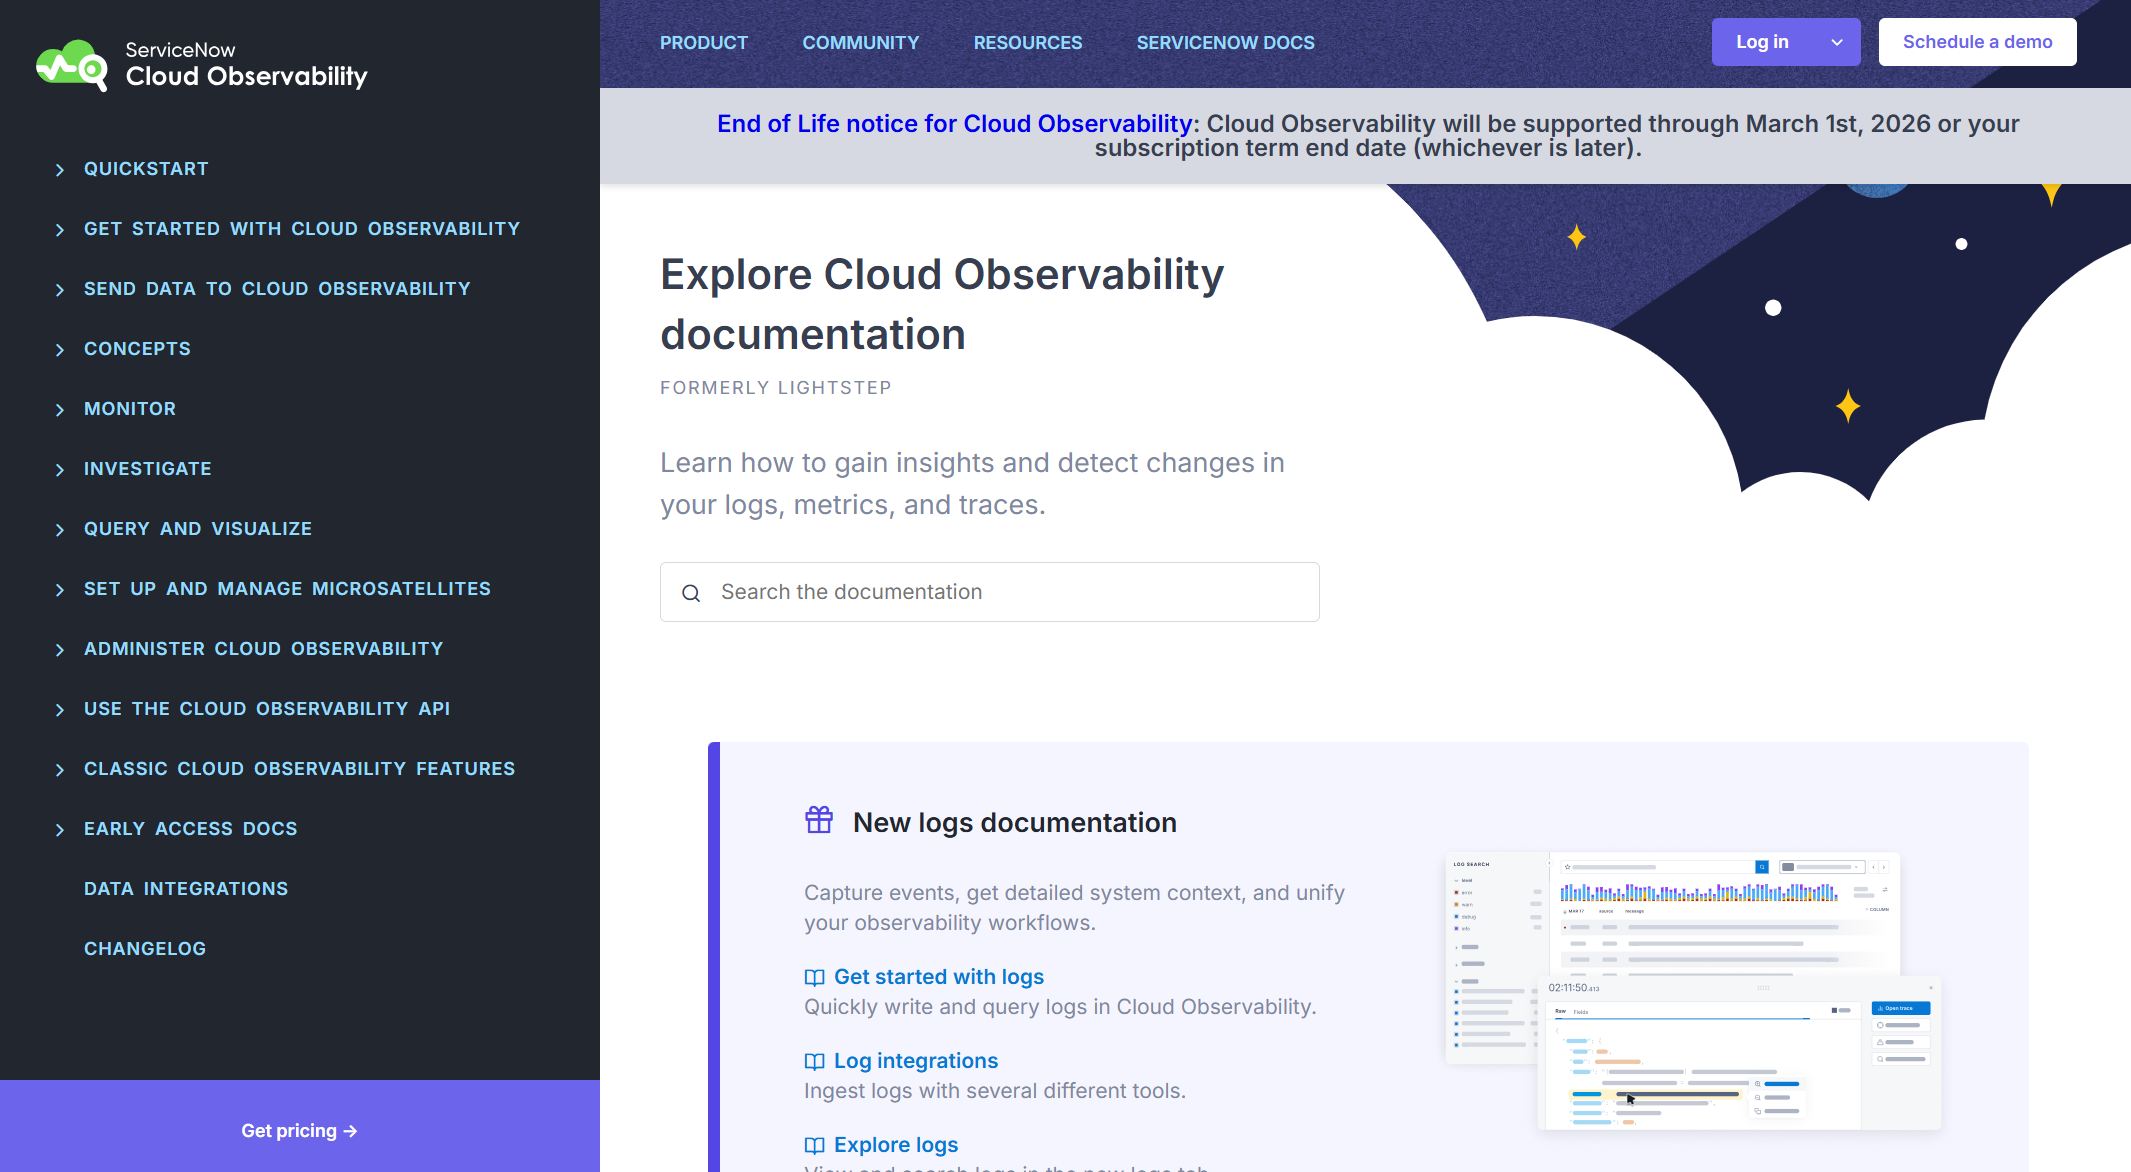
Lightstep collects and analyzes telemetry data from many systems. You get unified logs, metrics, and traces in a single workflow, which helps you detect and fix changes quickly. The platform gives you visibility into distributed systems and uses the OpenTelemetry Collector for data ingestion. You also get alerts and dashboards for performance monitoring.
Website: https://docs.lightstep.com/
Lightstep’s features make it easy to monitor complex environments and respond to anomalies fast. If you want unified observability, this tool is worth considering.
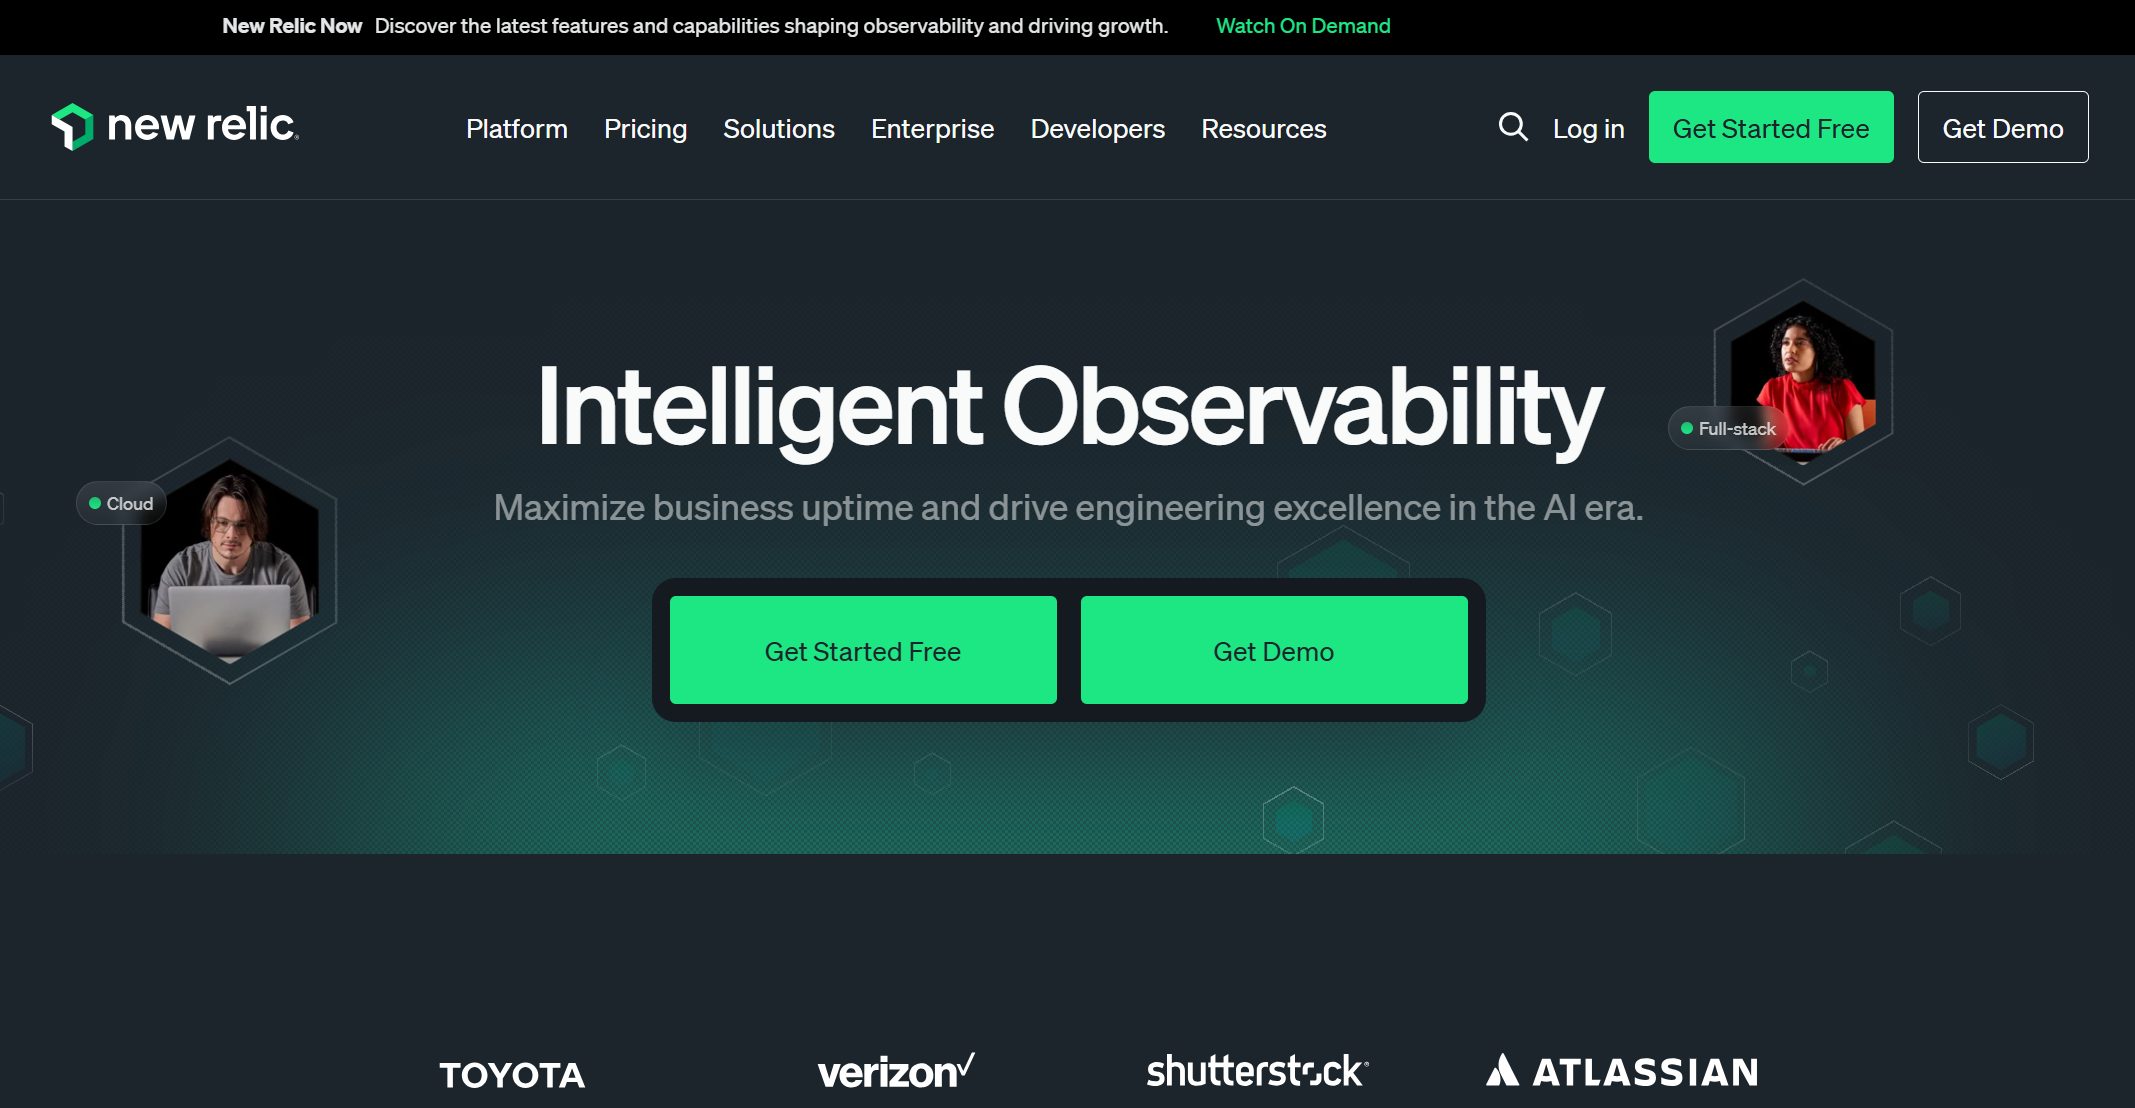
New Relic provides end-to-end visibility into your data pipelines, applications, and infrastructure. You analyze metrics and logs to spot trends and anomalies. The platform integrates with many data tools and sends real-time alerts before issues affect your operations. You can create custom dashboards to visualize data metrics and performance indicators.
Website: https://newrelic.com/
| Feature | Description |
|---|---|
| Comprehensive Monitoring | End-to-end visibility into pipelines, apps, and infrastructure. |
| Advanced Analytics | Analyzes metrics and logs for trends and anomalies. |
| Integration Capabilities | Connects with various data tools and platforms. |
| Real-Time Alerts | Notifies you of issues before they impact operations. |
| Detailed Dashboards | Custom dashboards for informed decision-making. |
New Relic’s features help you stay ahead of data issues and make smarter decisions. If you want a flexible and powerful platform, this is one of the best data observability tools.
Datafold helps you keep your data quality and reliability high. You organize metadata for a complete view of your data assets, which reduces errors. The platform detects anomalies and inconsistencies in real time, so you resolve issues quickly. You get customizable alerts to spot data quality problems before they affect your analysis. Datafold also supports collaboration, letting teams share insights and document issues efficiently.
Website: https://www.datafold.com/
| Feature | Description |
|---|---|
| Metadata Management | Organizes metadata for a full view of data assets. |
| Data Monitoring | Detects anomalies and inconsistencies in real time. |
| Alerts and Notifications | Customizable alerts for quick issue identification. |
| Collaboration | Centralized platform for sharing insights and documenting issues. |
| Automated Data Testing | Tests data pipelines to catch quality issues early. |
| Data Drift Detection | Spots changes in data over time to maintain integrity. |
| Data Comparison | Easy interface for comparing datasets and finding discrepancies. |
Datafold’s features help you automate data testing and maintain high standards. If you want reliable data and strong anomaly detection, Datafold is a smart choice.
Tip: When you choose among the best data observability tools, look for platforms that match your business needs and support seamless integration. The right features will help you build a trustworthy data stack and keep your analytics running smoothly.

When you look for a data observability platform, you want features that make your life easier and your data more reliable. The best platforms give you a complete toolkit for data monitoring, data quality management, and proactive monitoring. Here’s what you should expect from a leading data observability platform:
Real-time monitoring is a must-have for any data observability platform. You want to catch issues before they grow. Check out how real-time monitoring helps you:
| Benefit | Description |
|---|---|
| Catch issues at their source | Finds root causes, not just symptoms, so you fix problems fast. |
| Reduce alert-fatigue | Groups alerts by understanding what’s related, so you don’t get overwhelmed. |
| Immediate issue detection | Spots data quality problems as they happen, stopping them from spreading. |
| Performance optimization | Keeps your data pipelines healthy with real-time checks. |
| SLA compliance | Makes sure your data moves on time, so you meet business standards. |
| Adaptive data quality | Uses dynamic rules that adjust to real-time data patterns, improving data integrity. |
Platforms like FineDataLink shine here. You get real-time data synchronization and instant alerts, so you always know what’s happening in your data observability cloud.
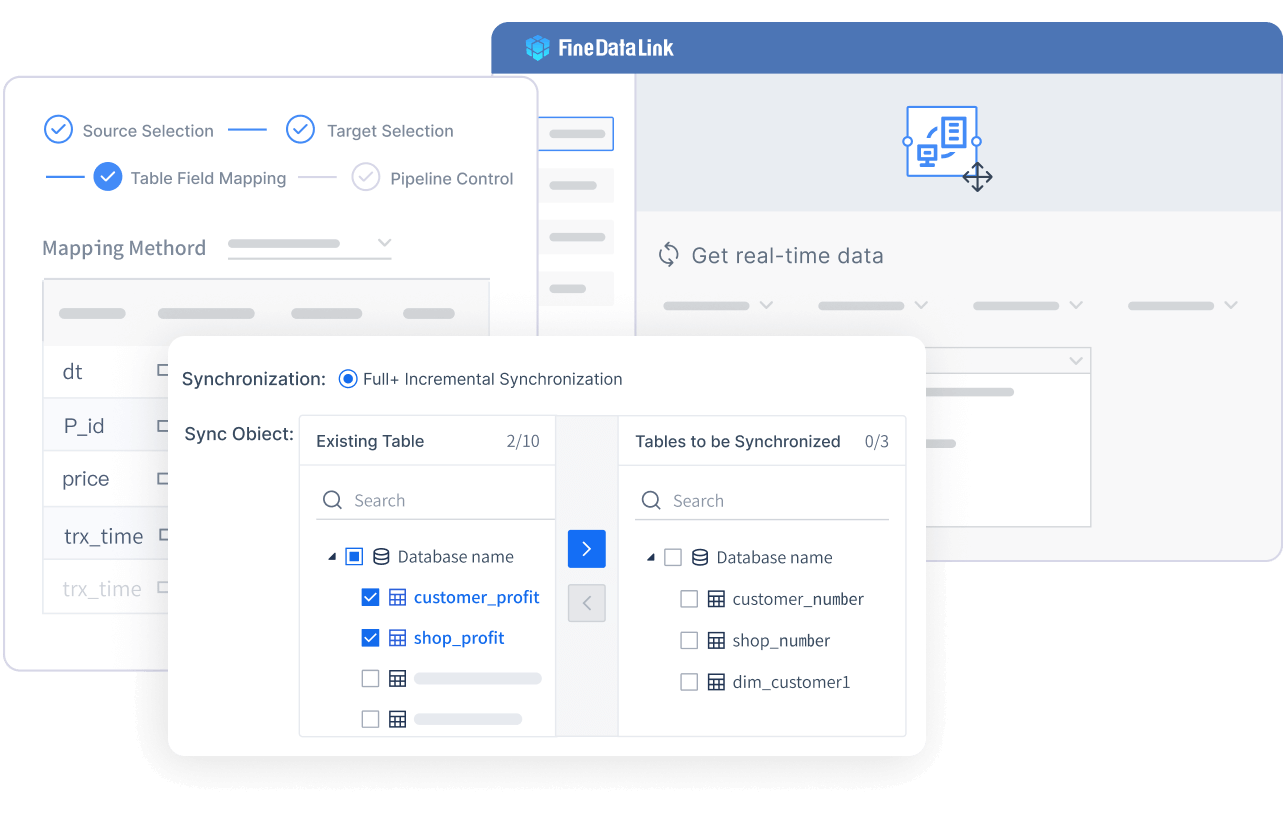
You need strong data quality monitoring to trust your analytics. A good data observability platform uses automated data quality rules and data quality checks to keep your data clean. These platforms let you set up data quality rules that run in real time. You can spot errors, missing values, or unexpected changes right away. This means you spend less time fixing problems and more time using your data.
Data lineage shows you where your data comes from and how it changes. This feature is key for data observability metrics and data integrity. When you can trace your data’s journey, you know it’s fresh and trustworthy. Data lineage helps you find errors, support audits, and build confidence in your reports. You get a clear view of your data’s path, which is important for compliance and decision-making.
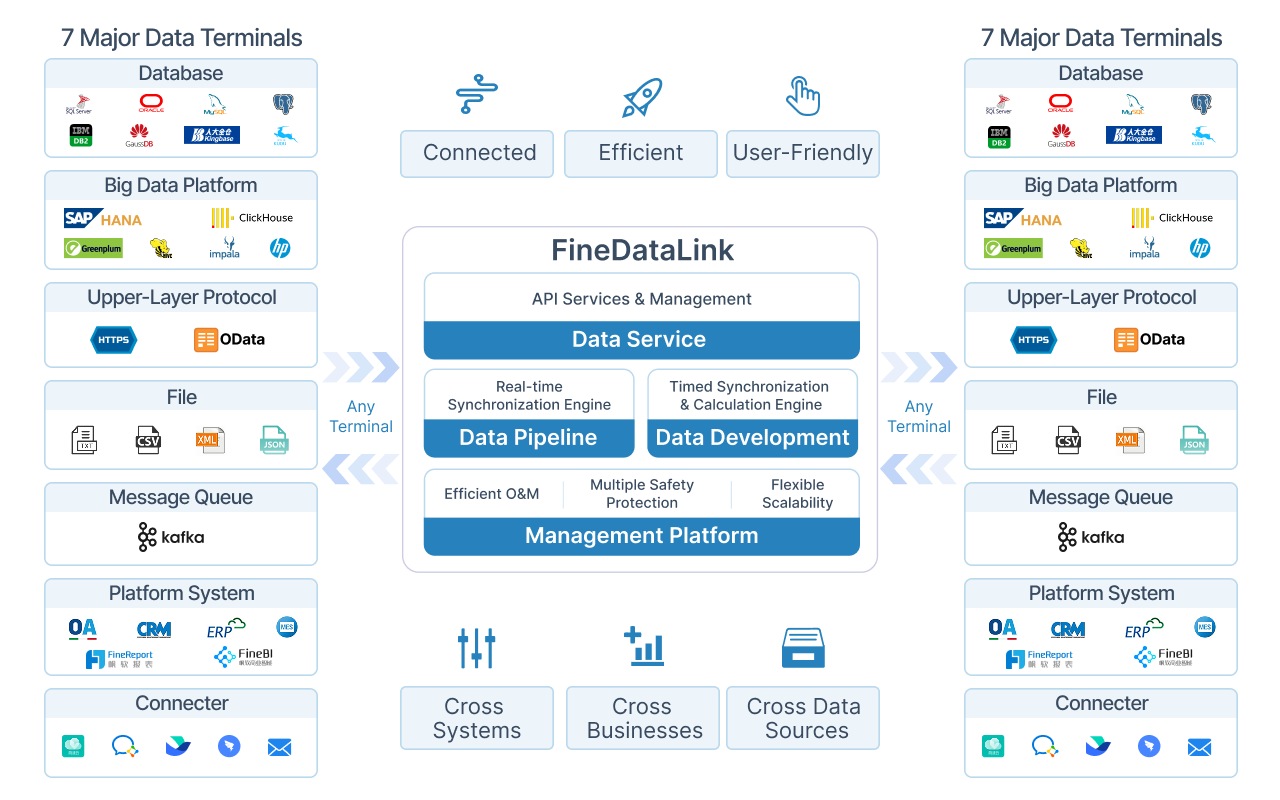
A top data observability platform connects to all your data sources, whether they’re in the cloud or on-premises. FineDataLink stands out with its ability to integrate over 100 data sources. You can connect databases, files, APIs, and more. This flexibility means you can build a unified data observability cloud that fits your business.
Customizable dashboards let you see the data observability metrics that matter most to you. You can track data quality rules, monitor pipeline health, and get alerts in real time. A good dashboard makes observability and monitoring simple. You get the information you need at a glance, so you can act fast.
Tip: Choose a data observability platform that offers real-time, automated, and customizable monitoring solutions. This will help you stay ahead of issues and keep your data reliable.
Choosing the right data observability platform can feel overwhelming. You want to know how these tools stack up before you make a decision. Let’s break down the main differences so you can find the best fit for your team.
Every data observability tool brings something unique to the table. Here are the key features you should look for:
You’ll find that some platforms focus more on real-time alerts, while others shine with deep lineage tracking or advanced anomaly detection. Think about which features matter most for your business.
You want a tool that fits smoothly into your current setup and grows with you. Here’s a quick look at what to check:
| Feature | Description |
|---|---|
| Compatibility | Works with your existing data stack without slowing things down. |
| Performance at Scale | Handles large amounts of data as your business grows. |
| Native Integrations | Connects easily to your main data sources and tools. |
| Scalability Benchmarks | Lets you test with data sizes similar to yours. |
| Pricing Scalability | Keeps costs predictable as your data grows. |
Platforms like Elastic Observability offer high interoperability and scale well across cloud providers. Others, like Databand, give you flexible deployment options, including hybrid and SaaS.
Nobody likes surprise bills. You want clear pricing and strong support. Here’s what you’ll see with most top tools:
| Pricing Model Type | Description |
|---|---|
| Telemetry-based Pricing | Pay for the amount of data you send into the platform. |
| Hybrid Pricing | Mixes data usage with charges for users or services. |
| Data Retention Costs | Some tools charge extra for storing or rehydrating old data. |
| Tiered Pricing | More users can mean lower costs per user. |
| Seasonal Pricing | Costs may rise during busy periods with more data traffic. |
| Pricing Editions | Choose from different plans (standard, pro, enterprise) with different features. |
| Budget Forecasting | Look for transparent pricing to help you plan your budget. |
| Usage Flexibility | Good platforms let you scale up or down without penalties. |
| Billing Tools | Some tools help you track usage and avoid unexpected charges. |
Tip: Always ask about support options. Fast, reliable help can save you time and stress when you need it most.
Now you have a clear view of how these data observability tools compare. Use this info to narrow down your choices and pick the platform that matches your needs.
Picking the right data observability platform can feel overwhelming, but you can make it easier by focusing on what matters most. Start by thinking about your data sources. Do you need to monitor data pipelines, warehouses, lakes, or applications? Next, look at your data volume and how complex your pipelines are. If you handle a lot of data, you need a platform that scales easily.
Here are some key things to check:
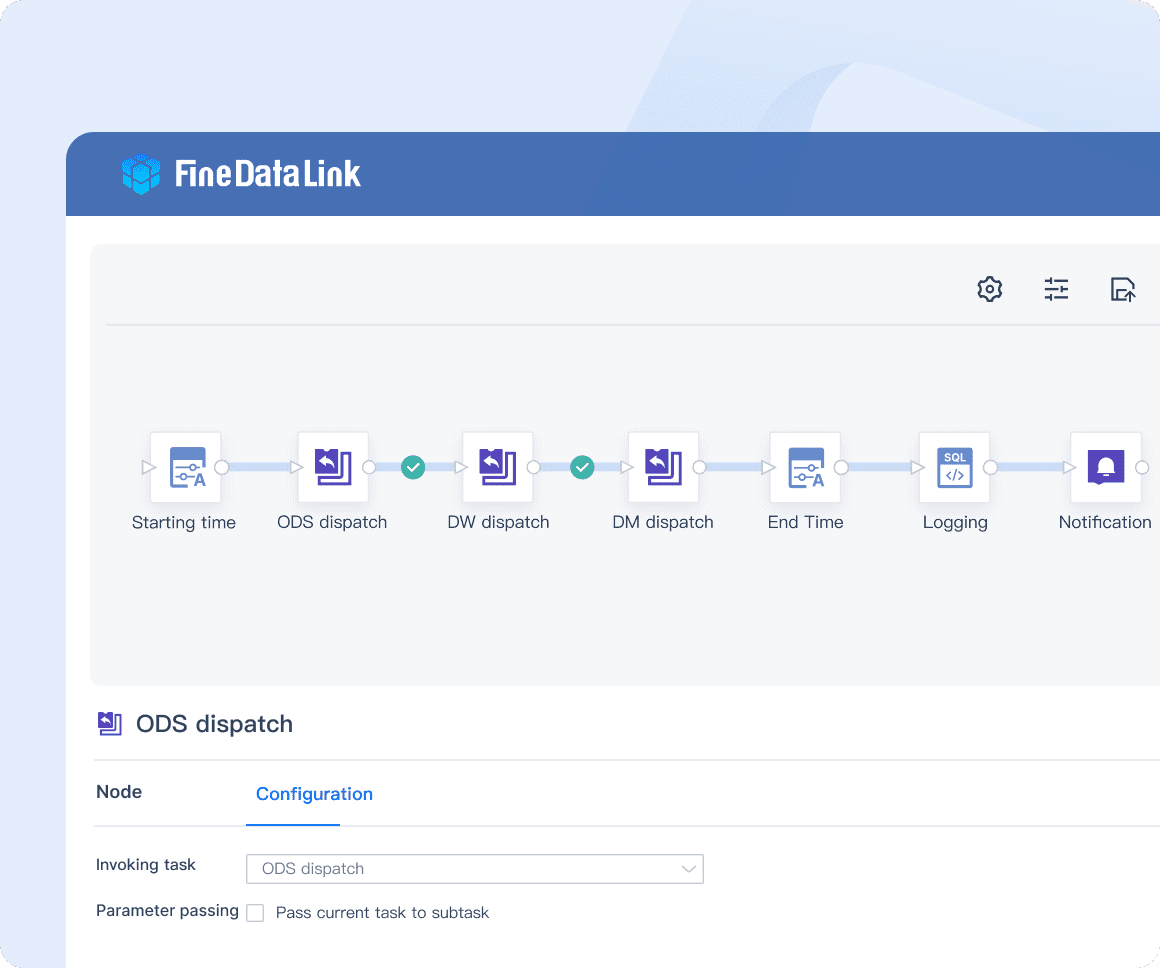
FineDataLink stands out here. You get seamless integration with over 100 data sources, real-time data synchronization, and a user-friendly, visual interface. This makes it simple to spot and fix data quality problems before they affect your business.
Many teams run into trouble by missing a few important details. Here’s a quick table to help you avoid common mistakes:
| Pitfall | Description |
|---|---|
| Delayed Incident Response | Slow monitoring can let data quality issues go unnoticed, causing bigger problems. |
| Ignoring User Experience | Focusing only on technical data can lead to user frustration and missed insights. |
| Insufficient Security | Weak security can expose sensitive data and damage trust. |
| Lack of Skill and Expertise | Without training, teams may struggle to use advanced features and solve data quality issues. |
| Insufficient Context | Missing logs or traceability makes troubleshooting harder. |
| Neglecting Alerting | Poorly set alerts can mean you miss critical data quality problems. |
| Lack of Standardization | Inconsistent data formats make it tough to resolve data quality issues. |
You want a platform that fits your business, not the other way around. Think about how easy it is to integrate with your current systems. Look for robust APIs and connectors, and check how quickly you can get started. Make sure the platform can handle more data as your business grows. Cost matters too—understand the pricing and what you get for your money.
| Factor | Key Considerations |
|---|---|
| Ease of Integration | Works with your systems, offers strong APIs, and quick setup. |
| Scalability | Handles more data without slowing down, manages resources well, and grows with you. |
| Cost-effectiveness | Clear pricing, good value, and a strong return on investment. |
FineDataLink checks all these boxes. You get a platform that makes data quality management simple, scales with your needs, and helps you avoid common data quality issues. With the right choice, you can keep your data quality high and your business running smoothly.
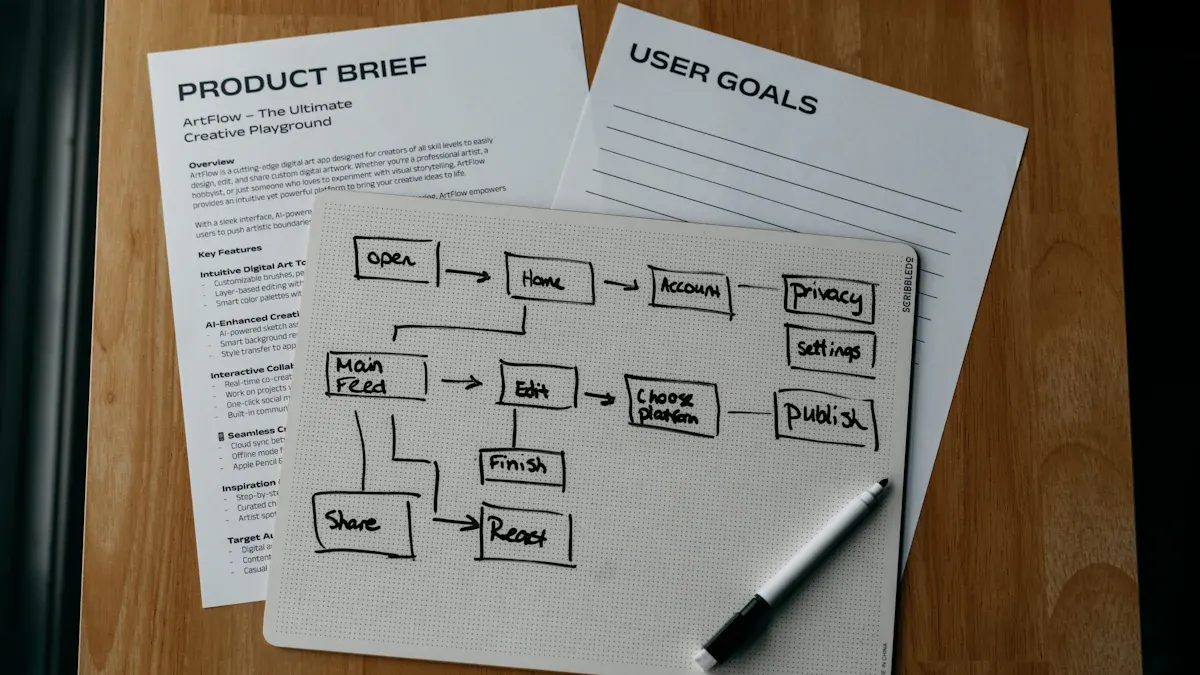
Ready to boost your data reliability? You can start with a few simple steps. First, set clear goals for your observability journey. Decide what you want to track and why it matters for your business. Next, map out your data ecosystem. Find out where your data comes from and how it moves through your systems.
Here’s a step-by-step guide to help you get started:
Tip: You don’t have to do everything at once. Start small, then expand as you learn what works best for your team.
You can use different types of tools for monitoring, logging, and tracing. Popular choices include Prometheus, Grafana, ELK Stack, and Jaeger. Each tool helps you see a different part of your data story.
Want to try before you buy? Many top data observability platforms offer free trials or demos. You can explore features, test integrations, and see how the platform fits your workflow.
| Tool Name | Free Trial/Demo Link | Description |
|---|---|---|
| Monte Carlo | Try Monte Carlo for Free with BigQuery | Monitors and alerts for freshness, volume, and schema changes with automated coverage. |
| Acceldata | 30-Day Free Trial | Experience the power of Data Observability firsthand. |
| Splunk Observability Cloud | Free Trial and Guided Onboarding | Offers a free trial and guided onboarding for users. |
| FineDataLink | Request a Free Trial | Seamless integration, real-time data sync, and a user-friendly interface for easy onboarding. |
Note: Free trials let you test features and see how each platform handles your data. You can compare dashboards, alerts, and integrations before making a decision.
Ready to get started? Pick a tool, sign up for a demo, and see how data observability can transform your business.
Choosing the right data observability tool shapes your data quality and business intelligence outcomes. Take a look at how key features make a difference:
| Feature | Impact on Data Quality and Business Intelligence Outcomes |
|---|---|
| Anomaly Detection | Helps identify data issues early, preventing bad data from propagating and ensuring reliable data for decision-making. |
| Schema Change Detection | Alerts teams to changes in data structure, preventing disruptions in downstream processes and maintaining data integrity. |
| Data Lineage Tracking | Provides visibility into data flow, aiding in diagnosing data quality issues and ensuring transparency in data management. |
| Data Quality Rules | Automates validation checks, serving as a first line of defense against data quality issues, thus enhancing overall data reliability. |
| Alerting and Notifications | Keeps data teams informed of potential issues in real-time, allowing for prompt action to maintain data quality. |
| Freshness Monitoring | Ensures data is timely and up-to-date, preventing outdated information from skewing analytics and impacting business decisions. |
| Usage and Performance Monitoring | Tracks key metrics to optimize resource utilization and ensure efficient data pipeline performance, contributing to better business outcomes. |
Use your shortlist and compare platforms based on your needs. Next, try these steps:
Stay proactive with your data management. Request a demo or free trial, like with FineDataLink, and keep learning about new trends to set your business up for long-term success.

The Author
Howard
Data Management Engineer & Data Research Expert at FanRuan
Related Articles

11 Best Data Management Tool Options Compared in 2026: Features, Pros, Cons & Use Cases
Compare the best data management tools for 2026. Review features, pros, cons, and ideal use cases for platforms like FineBI, Microsoft Purview, and Talend.
Lewis Chou
Apr 26, 2026

7 Best Data Governance Platforms Compared: Pros, Cons, and Which Teams They Fit Best
A data governance platform is software that helps organizations define, manage, monitor, and enforce how data is cataloged, accessed, trusted, and used across the business. 7 best data governance platforms compared at a
Howard Chu
Apr 20, 2026
What is a data management platform in 2025
A data management platform in 2025 centralizes, organizes, and activates business data, enabling smarter decisions and real-time insights across industries.
Howard
Dec 22, 2025