If you are searching for the best reporting tools for in-house teams, you are likely trying to solve a practical problem: how to give internal stakeholders reliable dashboards, recurring reports, and operational visibility without creating a reporting stack that is too hard to manage.
For in-house teams, reporting is usually not just about attractive charts. Operations teams need timely status updates. Finance teams need structured recurring reports. Marketing teams need campaign visibility. Leadership needs clean dashboards with consistent KPIs. And IT or BI teams need governance, maintainability, and predictable admin effort.
That is why the right reporting tool depends less on hype and more on whether it supports the reporting jobs your team actually needs to handle every week.
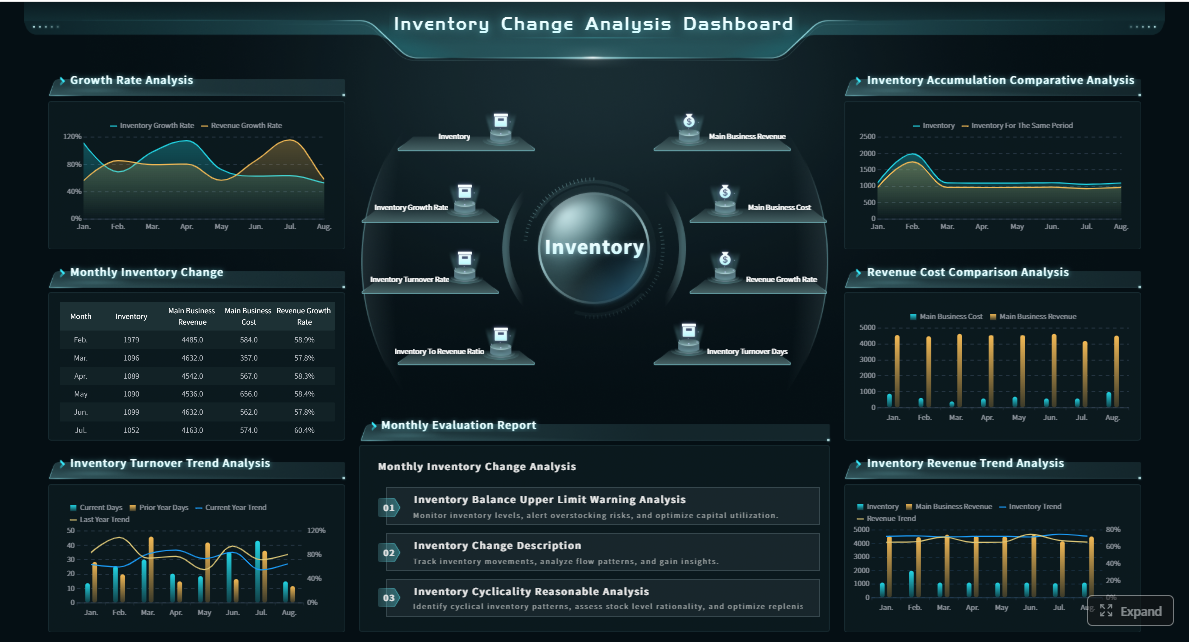 Click To Try The Dashboard
Quick Comparison Table
| Tool | Best for | Dashboarding | Pixel-perfect / paginated reporting | Scheduled reports | Operational reporting | Ease of use | Recommended users |
|---|---|---|---|---|---|---|---|
| Microsoft Power BI | Microsoft-centric organizations | Strong | Moderate, often via separate Microsoft reporting workflows | Strong | Good | Moderate | Enterprise IT, finance, analysts |
| Tableau | Advanced visual exploration | Very strong | Limited compared with dedicated reporting tools | Available, but may need added setup | Moderate | Moderate | Data teams, analytics-heavy departments |
| Looker Studio | Lightweight and low-cost reporting | Good for simple dashboards | Limited | Basic | Limited for complex workflows | Easy | Marketing teams, small internal teams |
| Metabase | Simple self-service analytics | Good | Limited | Basic to moderate | Moderate | Easy to moderate | Product, ops, startup internal teams |
| Apache Superset | Open-source flexibility | Strong | Limited | Varies by implementation | Moderate to strong with technical support | Moderate to difficult | Technical teams, data engineering-led orgs |
| Klipfolio | KPI dashboards and scheduled metric sharing | Good | Limited | Strong | Moderate | Moderate | Performance monitoring, executive KPI teams |
| Zoho Analytics | Broad reporting at lower price points | Good | Moderate | Strong | Moderate | Moderate | SMB and midsize internal teams |
| FineReport | Enterprise operational reporting and structured reporting workflows | Strong | Strong | Strong | Strong | Moderate | Finance, operations, manufacturing, enterprise reporting teams |
Best Reporting Tools for In-House Teams: What Matters Most
Choosing among the best reporting tools for in-house teams starts with defining the work your reports need to do.
Dashboards for monitoring
Dashboards help teams monitor KPIs quickly. These are useful for executives, sales leaders, marketing managers, and operations heads who need at-a-glance visibility into business performance. Strong dashboard tools make it easy to:
- Track trends
- Compare targets vs actuals
- Drill into exceptions
- Share live views across teams
Scheduled reports for recurring updates
Many internal stakeholders still rely on recurring reports sent daily, weekly, or monthly. These reports often need more structure than dashboards, especially in finance, compliance, procurement, or branch operations. Good scheduled reporting should support:
- Automated delivery
- Filtered views by department, region, or manager
- Printable or export-ready formats
- Consistent layouts for recurring review
Operational reporting for day-to-day decisions
Operational reporting is where many teams discover the limits of dashboard-first BI tools. These reports support daily workflows such as:
- Order and shipment tracking
- Production status reporting
- Inventory checks
- Budget control
- Store or branch performance reviews
- Exception handling and follow-up
These use cases often need parameter queries, tabular detail, printable layouts, and report logic that mirrors business processes.
What to compare beyond features
For internal teams, the best reporting tool is rarely the one with the longest feature list. It is the one that fits your environment and user behavior. Key buying criteria include:
- Usability: Can business users consume reports easily?
- Data connectivity: Does it connect to your existing systems?
- Automation: Can it handle recurring delivery without manual work?
- Governance: Can IT control access, definitions, and refresh schedules?
- Collaboration: Can teams share insights without duplication?
- Total cost: Does the tool stay manageable as usage grows?
The goal is not to buy the most advanced BI platform. The goal is to choose a tool that helps internal stakeholders make decisions reliably without adding unnecessary complexity.
How We Compared the 7 Options
To evaluate the best reporting tools for in-house teams fairly, we compared each option across the capabilities that matter most in everyday internal reporting.
1. Setup time
Some tools are easy to launch with cloud connectors and prebuilt templates. Others require more technical setup, modeling, or infrastructure. For lean internal teams, faster deployment can matter as much as raw capability.
2. Dashboard flexibility
We looked at how well each tool supports KPI dashboards, drill-down analysis, and stakeholder-friendly visual layouts. This is especially important for leadership, sales, and marketing reporting.
3. Scheduled delivery
Many in-house teams need more than live dashboards. They also need reports delivered on a schedule in formats stakeholders can actually use. We considered whether each tool supports recurring delivery reliably and with enough flexibility.
4. Operational reporting depth
This is a major differentiator. Some tools are excellent for exploration and visualization but less suited to detailed operational reports with filters, forms, structured tables, or print-ready output.
5. Maintenance requirements
Internal teams also need to think about long-term admin effort. A reporting tool that looks powerful in a demo can become difficult to govern, scale, or maintain if it requires too much specialized support.
6. Cross-functional support
Most in-house reporting environments serve more than one department. We considered how well each platform supports finance, operations, marketing, management, and other internal stakeholders with different reporting needs.
7. Trade-offs that matter in real teams
Every tool involves trade-offs between:
- Ease of use
- Customization
- Scalability
- Admin overhead
- Reporting depth
- Cost predictability
The best choice depends on who builds reports, who maintains them, and how those reports are used in day-to-day work.
7 Reporting Tools Compared
1. Microsoft Power BI
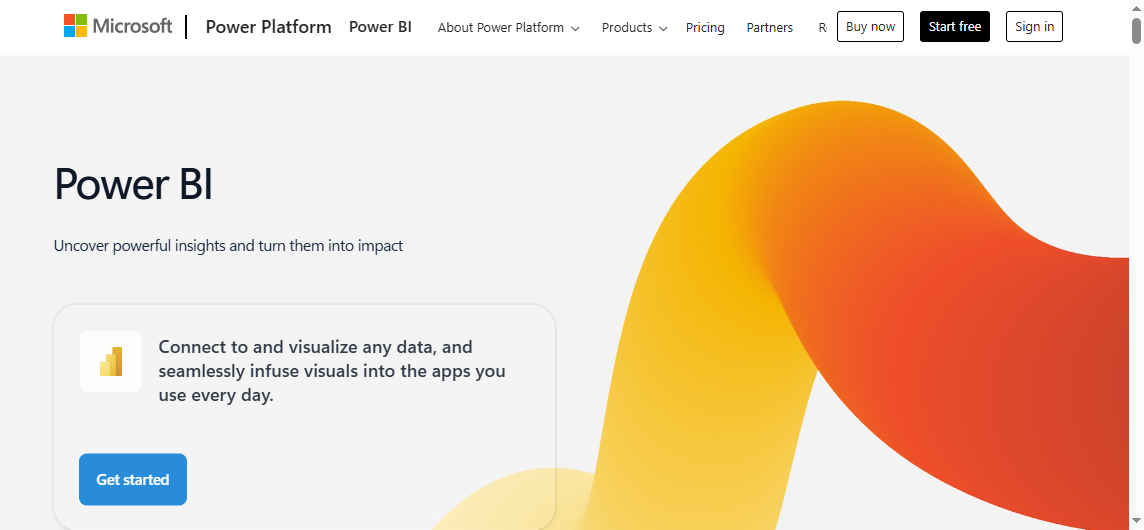 Microsoft Power BI is one of the most widely used reporting and BI platforms for internal teams. It is often a strong fit for organizations already invested in the Microsoft ecosystem and looking for a mix of interactive dashboards, governance, and broad data access.
Best for
Power BI is best for teams that want strong visualization and enterprise controls, especially if they already use Microsoft 365, Azure, Excel, or related services.
Pros
- Broad range of data connectors
- Strong interactive dashboards and drill-down analysis
- Widely adopted in enterprise environments
- Good governance and security options
- Familiar appeal for Excel-oriented organizations
Cons
- Licensing and deployment decisions can become complex
- Less technical business users may face a steeper learning curve
- Paginated or highly formatted reporting may require additional Microsoft reporting components or workflows
Where Power BI fits well
Power BI works well for:
- Executive dashboards
- Departmental KPI tracking
- Financial analysis dashboards
- Sales pipeline visibility
- Cross-functional performance monitoring
Where teams should evaluate carefully
If your internal reporting needs include highly structured recurring reports, print-oriented layouts, or operational workflows with parameterized reporting, you may need to assess whether Power BI alone is enough or whether supplementary reporting capabilities are required.
2. Tableau

Tableau is widely respected for data visualization, exploration, and dashboard design. It is often chosen by organizations that want analysts and business users to interact deeply with data and build polished visual experiences.
Best for
Tableau is best for teams prioritizing visual exploration and advanced dashboard design.
Pros
- Polished and flexible visualizations
- Strong support for interactive analysis
- Mature ecosystem and active user community
- Well suited to analytical storytelling
Cons
- Higher cost can be a factor for broader internal rollouts
- Operational reporting workflows may require additional setup
- Less naturally aligned with highly structured, pixel-specific reporting needs
Where Tableau fits well
Tableau is a good choice for:
- Executive dashboards
- Business review dashboards
- Trend analysis
- Marketing performance exploration
- Data-driven presentations for leadership
Where teams should evaluate carefully
If internal users rely heavily on recurring structured reports, printable forms, or operational detail views, Tableau may need complementary processes to cover those requirements smoothly.
3. Looker Studio
 Looker Studio is a lightweight reporting option often used for simple dashboards and web or marketing reporting. It is attractive for teams that want accessible sharing and a relatively low barrier to entry.
Best for
Looker Studio is best for cost-conscious teams that want lightweight reporting and simple collaboration.
Pros
- Accessible interface
- Easy sharing and collaboration
- Strong fit for marketing and web analytics reporting
- Useful for quick dashboard deployment
Cons
- Less depth for complex operational reporting
- Limited support for highly structured enterprise reporting needs
- Can feel restrictive for organizations with advanced governance or formatting requirements
Where Looker Studio fits well
Looker Studio works well for:
- Website and campaign reporting
- Basic executive summaries
- Simple cross-channel KPI dashboards
- Lightweight departmental reporting
Where teams should evaluate carefully
As reporting needs become more complex, especially around data governance, workflow-driven operations, or highly formatted recurring outputs, teams often need to look beyond lightweight dashboard tools.
4. Metabase
 Metabase is popular with teams that want self-service analytics without a heavy enterprise BI footprint. It is often appreciated for its ease of use and relatively fast time to value.
Best for
Metabase is best for internal teams that want a simpler analytics and reporting layer.
Pros
- User-friendly query and exploration experience
- Quick deployment
- Approachable dashboard building
- Good fit for product, operations, and startup reporting environments
Cons
- Fewer advanced enterprise controls than larger BI platforms
- Limited depth for highly formatted reporting
- May require workarounds for more formal reporting workflows
Where Metabase fits well
Metabase is useful for:
- Operational monitoring
- Internal product analytics
- Team dashboards
- Lightweight recurring reporting
Where teams should evaluate carefully
For organizations needing strong governance, sophisticated scheduling, or report designs tailored to formal business workflows, Metabase may feel too lightweight.
5. Apache Superset
 Apache Superset is an open-source BI platform that appeals to organizations with technical resources and a desire for flexibility without per-seat licensing.
Best for
Superset is best for teams with technical support that want open-source flexibility.
Pros
- Highly customizable
- Strong charting capabilities
- No traditional per-seat licensing model
- Suitable for engineering-led data environments
Cons
- More setup and maintenance effort
- Less friendly for non-technical users
- Operational success depends heavily on internal technical support
Where Superset fits well
Superset can be effective for:
- Technical analytics teams
- Internal BI environments with engineering ownership
- Custom reporting applications
- Organizations prioritizing open-source architecture
Where teams should evaluate carefully
If your users are mostly business stakeholders who need polished, low-friction reporting, Superset may require more technical mediation than commercial tools designed for broader internal adoption.
6. Klipfolio
 Klipfolio is designed around KPI tracking and business metric visibility. It is often chosen by teams that want cloud-connected dashboards and recurring performance updates.
Best for
Klipfolio is best for KPI dashboards and scheduled reporting across multiple business tools.
Pros
- Strong metric tracking
- Useful cloud integrations
- Scheduled delivery options
- Good fit for performance monitoring use cases
Cons
- Dashboard customization may feel narrower than full BI suites
- Less suited to deeper operational reporting requirements
- Structured enterprise reporting may require more compromise
Where Klipfolio fits well
Klipfolio works well for:
- Executive KPI dashboards
- Agency-style or multi-source performance reporting
- Sales and marketing scorecards
- Recurring summary reporting
Where teams should evaluate carefully
If your stakeholders need highly interactive analysis or detailed operational reports, a KPI-centered platform may feel too narrow over time.
7. Zoho Analytics
 Zoho Analytics offers a broad set of dashboarding and reporting capabilities at a price point that often appeals to smaller and midsize internal teams.
Best for
Zoho Analytics is best for in-house teams that want balanced reporting features at a lower price point.
Pros
- Broad feature coverage
- Automation support
- Relatively approachable pricing
- Suitable for organizations that want more than simple dashboards without moving to heavier enterprise tools
Cons
- Interface experience may vary by use case
- Performance can depend on reporting complexity and scale
- Some teams may outgrow it as governance and customization needs expand
Where Zoho Analytics fits well
Zoho Analytics is a practical option for:
- SMB reporting environments
- Finance and sales reporting
- Cross-functional dashboards
- Teams that want scheduled outputs with moderate complexity
Where teams should evaluate carefully
If your internal reporting estate becomes highly customized, governance-heavy, or operationally complex, you may eventually need a more specialized reporting architecture.

Which Tool Fits Different In-House Team Needs
Different in-house teams define “best” very differently. Here is how to think about fit by reporting scenario.
Best for executive dashboards
Executive dashboards should prioritize clarity, speed, and consistency. The strongest choices here are typically:
- Power BI for Microsoft-centered enterprises
- Tableau for polished visual storytelling
- Klipfolio for KPI-focused leadership reporting
- Zoho Analytics for cost-conscious midsize teams
What matters most is fast refresh, easy access, and a layout that highlights high-level KPIs without clutter.
Best for scheduled reports
Scheduled reports matter when stakeholders expect recurring updates in a stable format. Strong options include:
- Power BI, especially in enterprise environments with established workflows
- Klipfolio for recurring KPI distribution
- Zoho Analytics for balanced automation and affordability
- FineReport for teams that need more structured, formatted, and operationally aligned report delivery
If your users rely on emailed reports, printable outputs, or parameter-based report generation, this category deserves extra attention during evaluation.
Best for operational reporting
Operational reporting usually needs more than visual dashboards. It often requires granular filters, dependable data freshness, tabular detail, and structured outputs that match day-to-day business workflows.
Tools to assess here include:
- Power BI for broad enterprise reporting environments
- Metabase for lighter operational monitoring
- Superset where technical teams can support custom implementations
- FineReport for organizations that need dashboards plus structured operational reports, parameter queries, and recurring enterprise reporting workflows
Best for budget-sensitive teams
If budget is a major concern, good options often include:
- Looker Studio for simple, low-cost reporting
- Metabase for approachable internal analytics
- Superset for open-source flexibility with technical backing
- Zoho Analytics for feature breadth at a lower commercial price point
The key is not just affordability at purchase, but whether the tool’s complexity matches what your team can realistically adopt and maintain.
When Dashboards Are Not Enough
Many teams start with dashboards and only later realize they also need structured reporting. This usually happens when stakeholders ask for:
- Daily branch or region reports
- Scheduled finance summaries
- Paginated reports for review meetings
- Report exports in printable formats
- Parameter-driven operational queries
- Input forms tied to reporting workflows
Dashboards are excellent for monitoring and exploration, but they do not always replace recurring business reports. This is where teams often benefit from a reporting platform built for both visualization and operational reporting.
A Practical Option for Teams with Complex Internal Reporting Needs
Tools like Tableau and Power BI are widely used for visualization and BI analysis, but teams with complex reporting workflows may also need a dedicated enterprise reporting platform like FineReport.
FineReport is particularly relevant when in-house teams need more than interactive dashboards. It is designed for organizations that require:
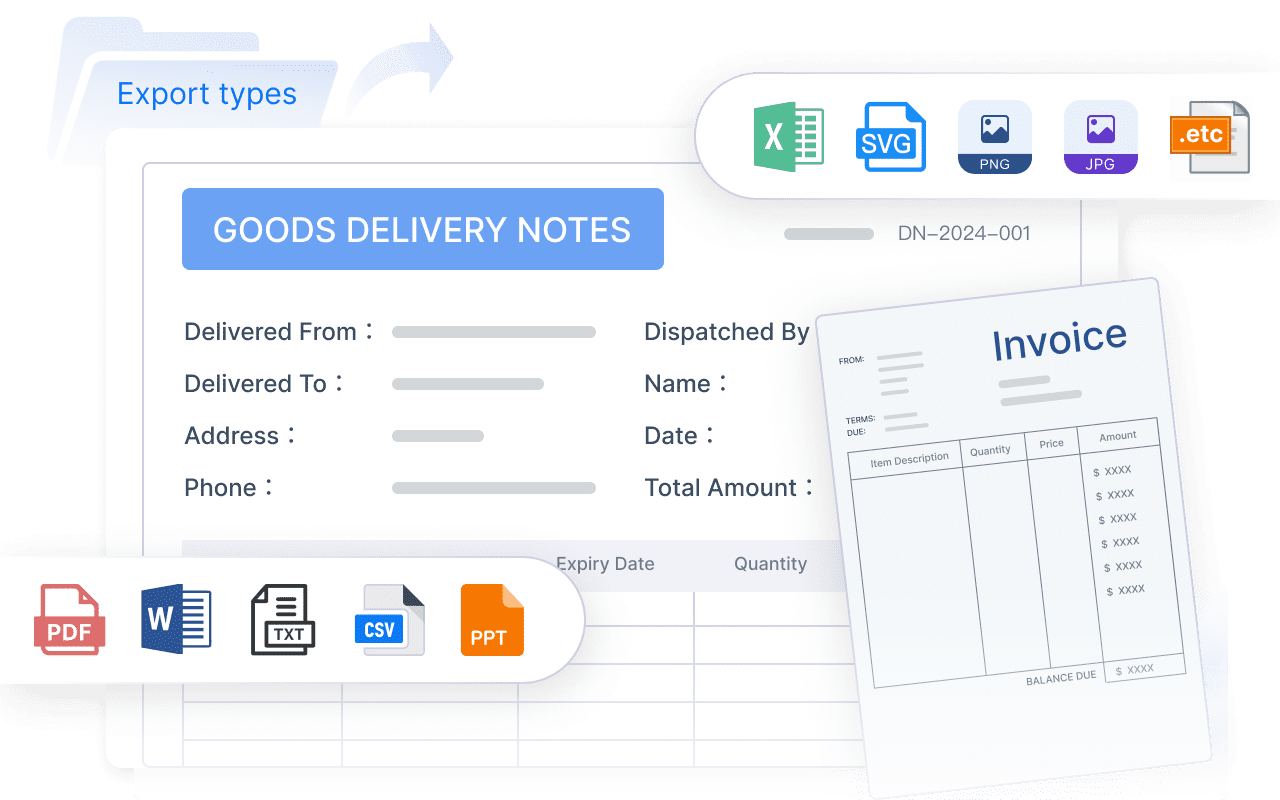
- Pixel-perfect report design for structured business outputs
- Paginated and printable reports for recurring internal use
- Parameter queries for operational filtering
- Scheduled reporting and automated distribution
- Integrated dashboards and detailed reports
- Data entry and form-based workflows
- Enterprise reporting governance across departments
This makes it a practical fit for scenarios such as:
- Finance reporting packs
- Production and manufacturing reports
- Sales and regional management reports
- Inventory and logistics tracking
- Management reporting with drill-down detail
- Operational workflows that combine report consumption with data input
FineReport is not just for dashboard display. It is useful when internal reporting needs to function as part of a business process.

Get Ready-to-Use Dashboard and Report Templates in Fine Gallery
Actionable Recommendations Before You Choose
If you are comparing the best reporting tools for in-house teams, these practical steps can save time and reduce the risk of buying the wrong platform.
1. Separate dashboard needs from reporting workflow needs
Do not assume one flashy dashboard demo covers all use cases. List which stakeholders need real-time dashboards versus scheduled, structured, or printable reports.
2. Test one operational use case, not just one executive dashboard
Many tools perform well for summary dashboards. The real test is whether they can support a full operational workflow such as filtered regional reports, recurring finance packs, or branch-level status tracking.
3. Identify who builds, governs, and maintains reports
A tool that works for analysts may not work for business-led teams. Be clear about whether report creation will sit with IT, BI, finance, operations, or a mixed ownership model.
4. Evaluate scheduling and distribution early
Recurring delivery is often treated as a secondary feature, but for in-house stakeholders it can be central. Check how each tool handles automated delivery, role-based access, and format flexibility.
5. Choose based on reporting maturity, not feature volume
A smaller team may succeed with a lighter tool. A larger enterprise with operational complexity may need a platform that supports governance, structured reports, and workflow-based reporting from the start.
Final Comparison Checklist Before You Choose
Before committing to a reporting platform, review this checklist:
- Confirm which data sources you need now and which may be added later
- Identify who will build reports, who will maintain them, and who only needs to consume them
- Test one or two real reporting workflows before making a final decision
- Validate scheduling, permissions, and stakeholder delivery requirements
- Check whether you need dashboards only or dashboards plus operational reports
- Choose the tool that matches your team’s reporting maturity, not just the longest feature list
For many teams, Power BI, Tableau, Looker Studio, Metabase, Superset, Klipfolio, or Zoho Analytics can be strong choices depending on priorities. But if your internal reporting environment includes structured recurring reports, operational workflows, print-ready layouts, and multi-department governance, FineReport is worth serious consideration.
FAQs
The best tool depends on your reporting needs, internal workflows, and technical environment. Teams that need dashboards, scheduled reports, and operational reporting often benefit most from a platform that balances usability, automation, and governance.
Dashboard tools focus on visual KPI monitoring and quick trend analysis, while reporting tools often support structured, recurring, and printable outputs. Many in-house teams need both, especially for finance, operations, and leadership reporting.
Tools with strong scheduling, automated delivery, and consistent export formats are usually best for recurring internal reports. This matters most for teams that send daily, weekly, or monthly updates across departments or regions.
Look for support for detailed tables, parameter-based queries, printable layouts, and workflow-friendly report logic. These features are important for day-to-day use cases like inventory tracking, budget control, and exception management.
FineReport can be a strong fit for enterprise teams that need structured reporting, operational visibility, and scheduled distribution in one platform. It is especially relevant for finance, operations, manufacturing, and other process-heavy departments.


The Author
Yida YIn
FanRuan Industry Solutions Expert
Related Articles

Best Finance Reporting Software for CFOs in 2026: 7 Tools Compared for Automation, Governance, and Reporting Depth
If you are searching for finance $1 , you are likely trying to solve a familiar CFO problem: finance data exists across ERP systems, spreadsheets, and BI dashboards, but producing reliable, board ready, repeatable report
Yida Yin
Jul 02, 2026

7 White Label Reporting Tool Options Compared: What Agencies and SaaS Teams Should Evaluate Before Buying
A white label $1 is software that lets you deliver dashboards, reports, or analytics experiences under your own brand instead of the vendor’s. If you are a marketing agency, consultancy, SaaS company, or product team, yo
Yida Yin
Jul 01, 2026

Automated Reporting for Clients: How to Keep KPI Definitions and Permissions Under Control
$1 for clients only works when two things stay stable as reporting volume grows: metric meaning and access control . Without those controls, teams may send reports faster, but they also scale inconsistency, confusion, an
Yida Yin
Jun 28, 2026