If you are searching for social media reporting tools free, you are probably trying to solve one of two problems fast: either you need a clear report for a boss or client, or you need a simple way to understand what is working across your social channels without buying an expensive platform too early.
In 2026, free social media reporting options are still useful, but “free” rarely means unlimited. Most tools give you one of the following: a forever-free plan with tight caps, a free trial of premium reporting features, limited exports, fewer connected accounts, or shorter historical data windows. That is enough for many small teams to validate a workflow, but not always enough for polished stakeholder reporting at scale.
The good news is that you do not need to overbuy on day one. With the right setup, you can use free social media analytics and reporting tools to track post performance, build lightweight dashboards, compare channels, and create one-off summaries before you commit to a paid system. And if your team eventually needs more governed cross-channel reporting, dashboard standardization, and AI-assisted summaries, a BI foundation plus an enterprise Data Agent layer becomes the next step.
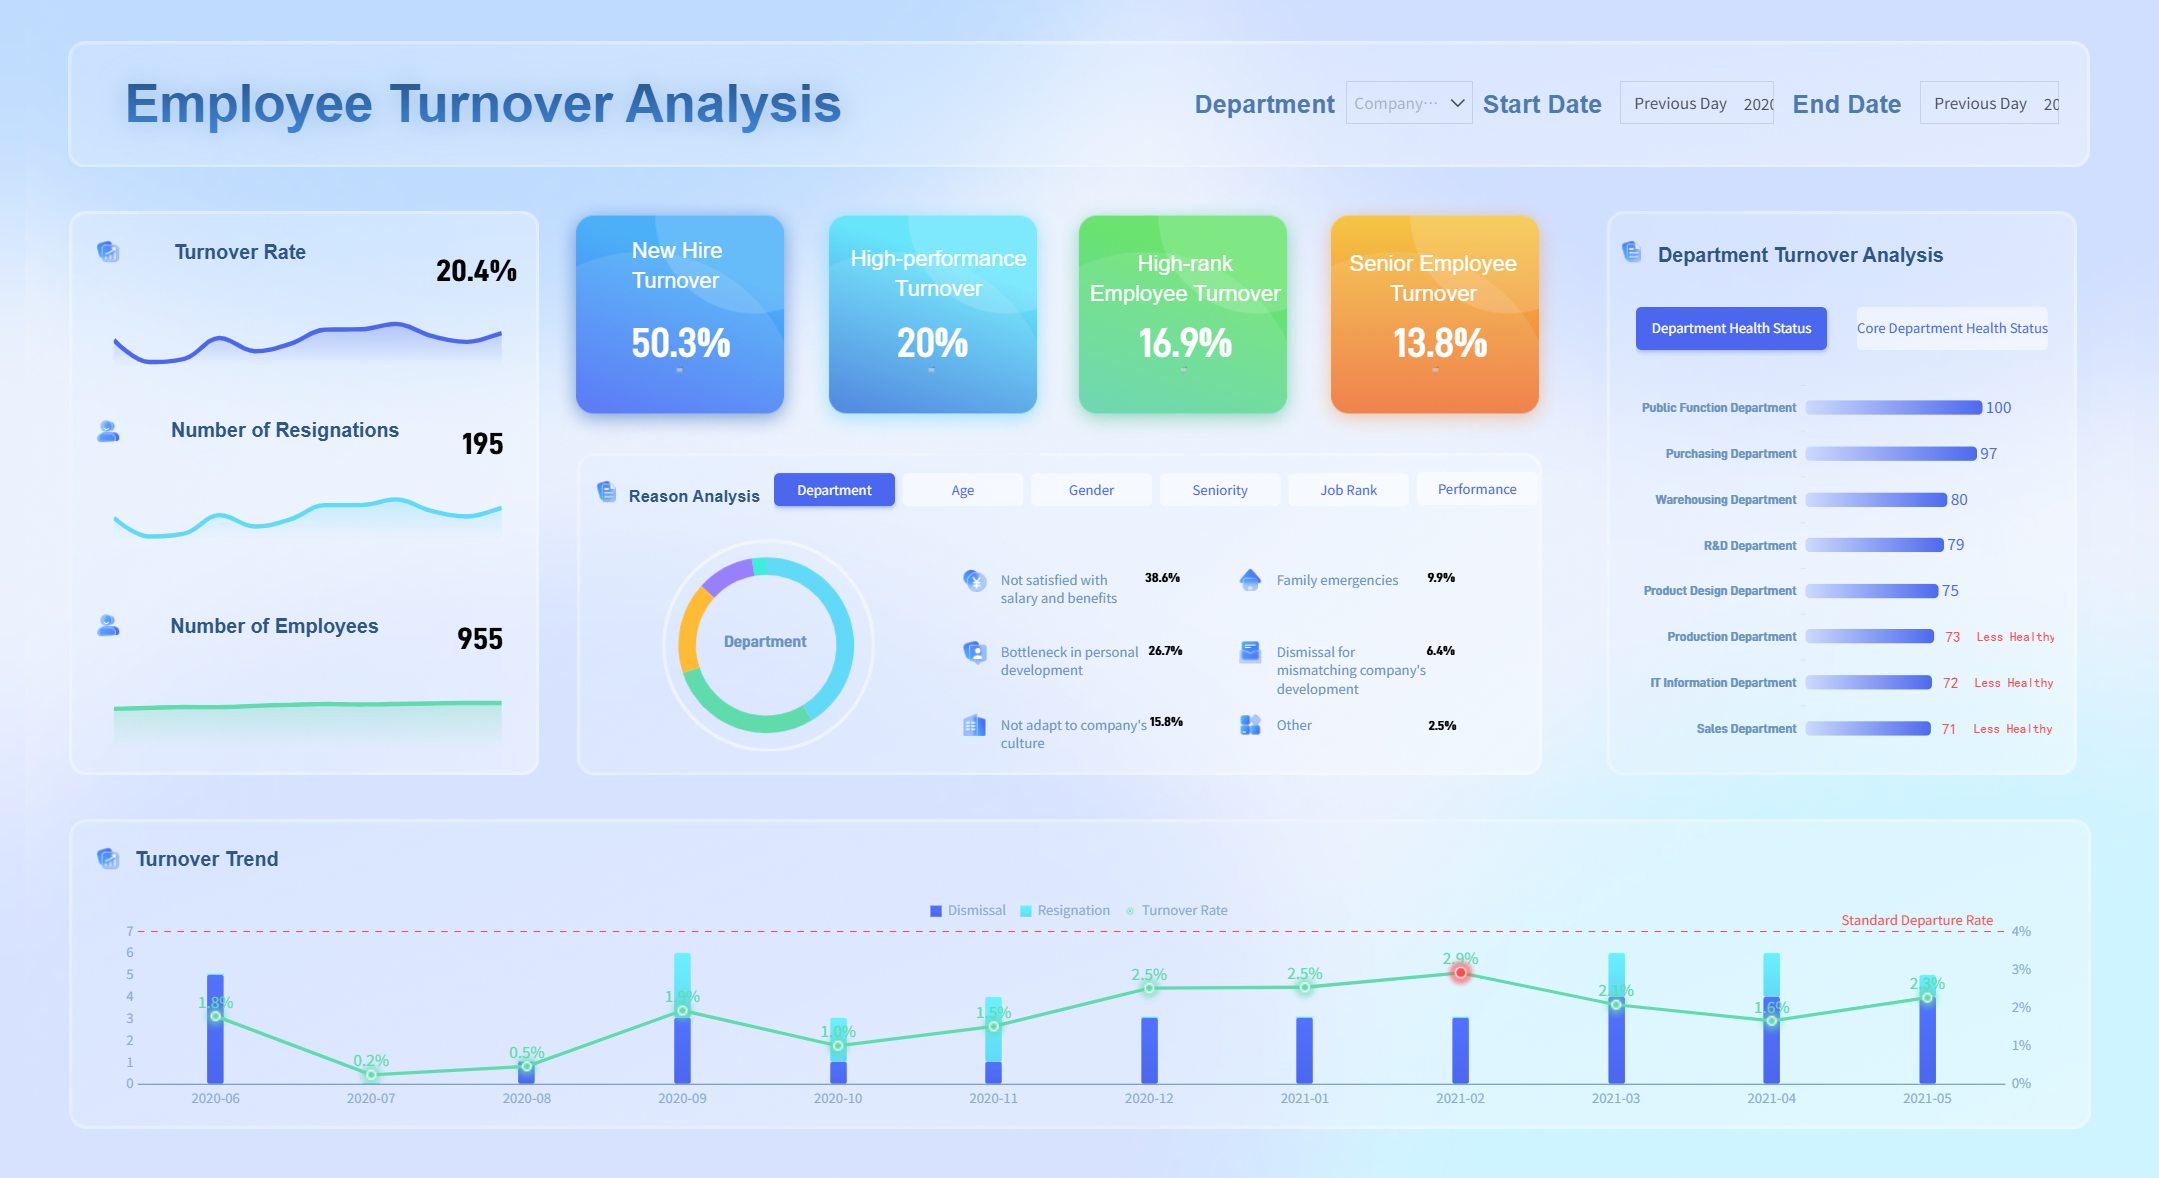
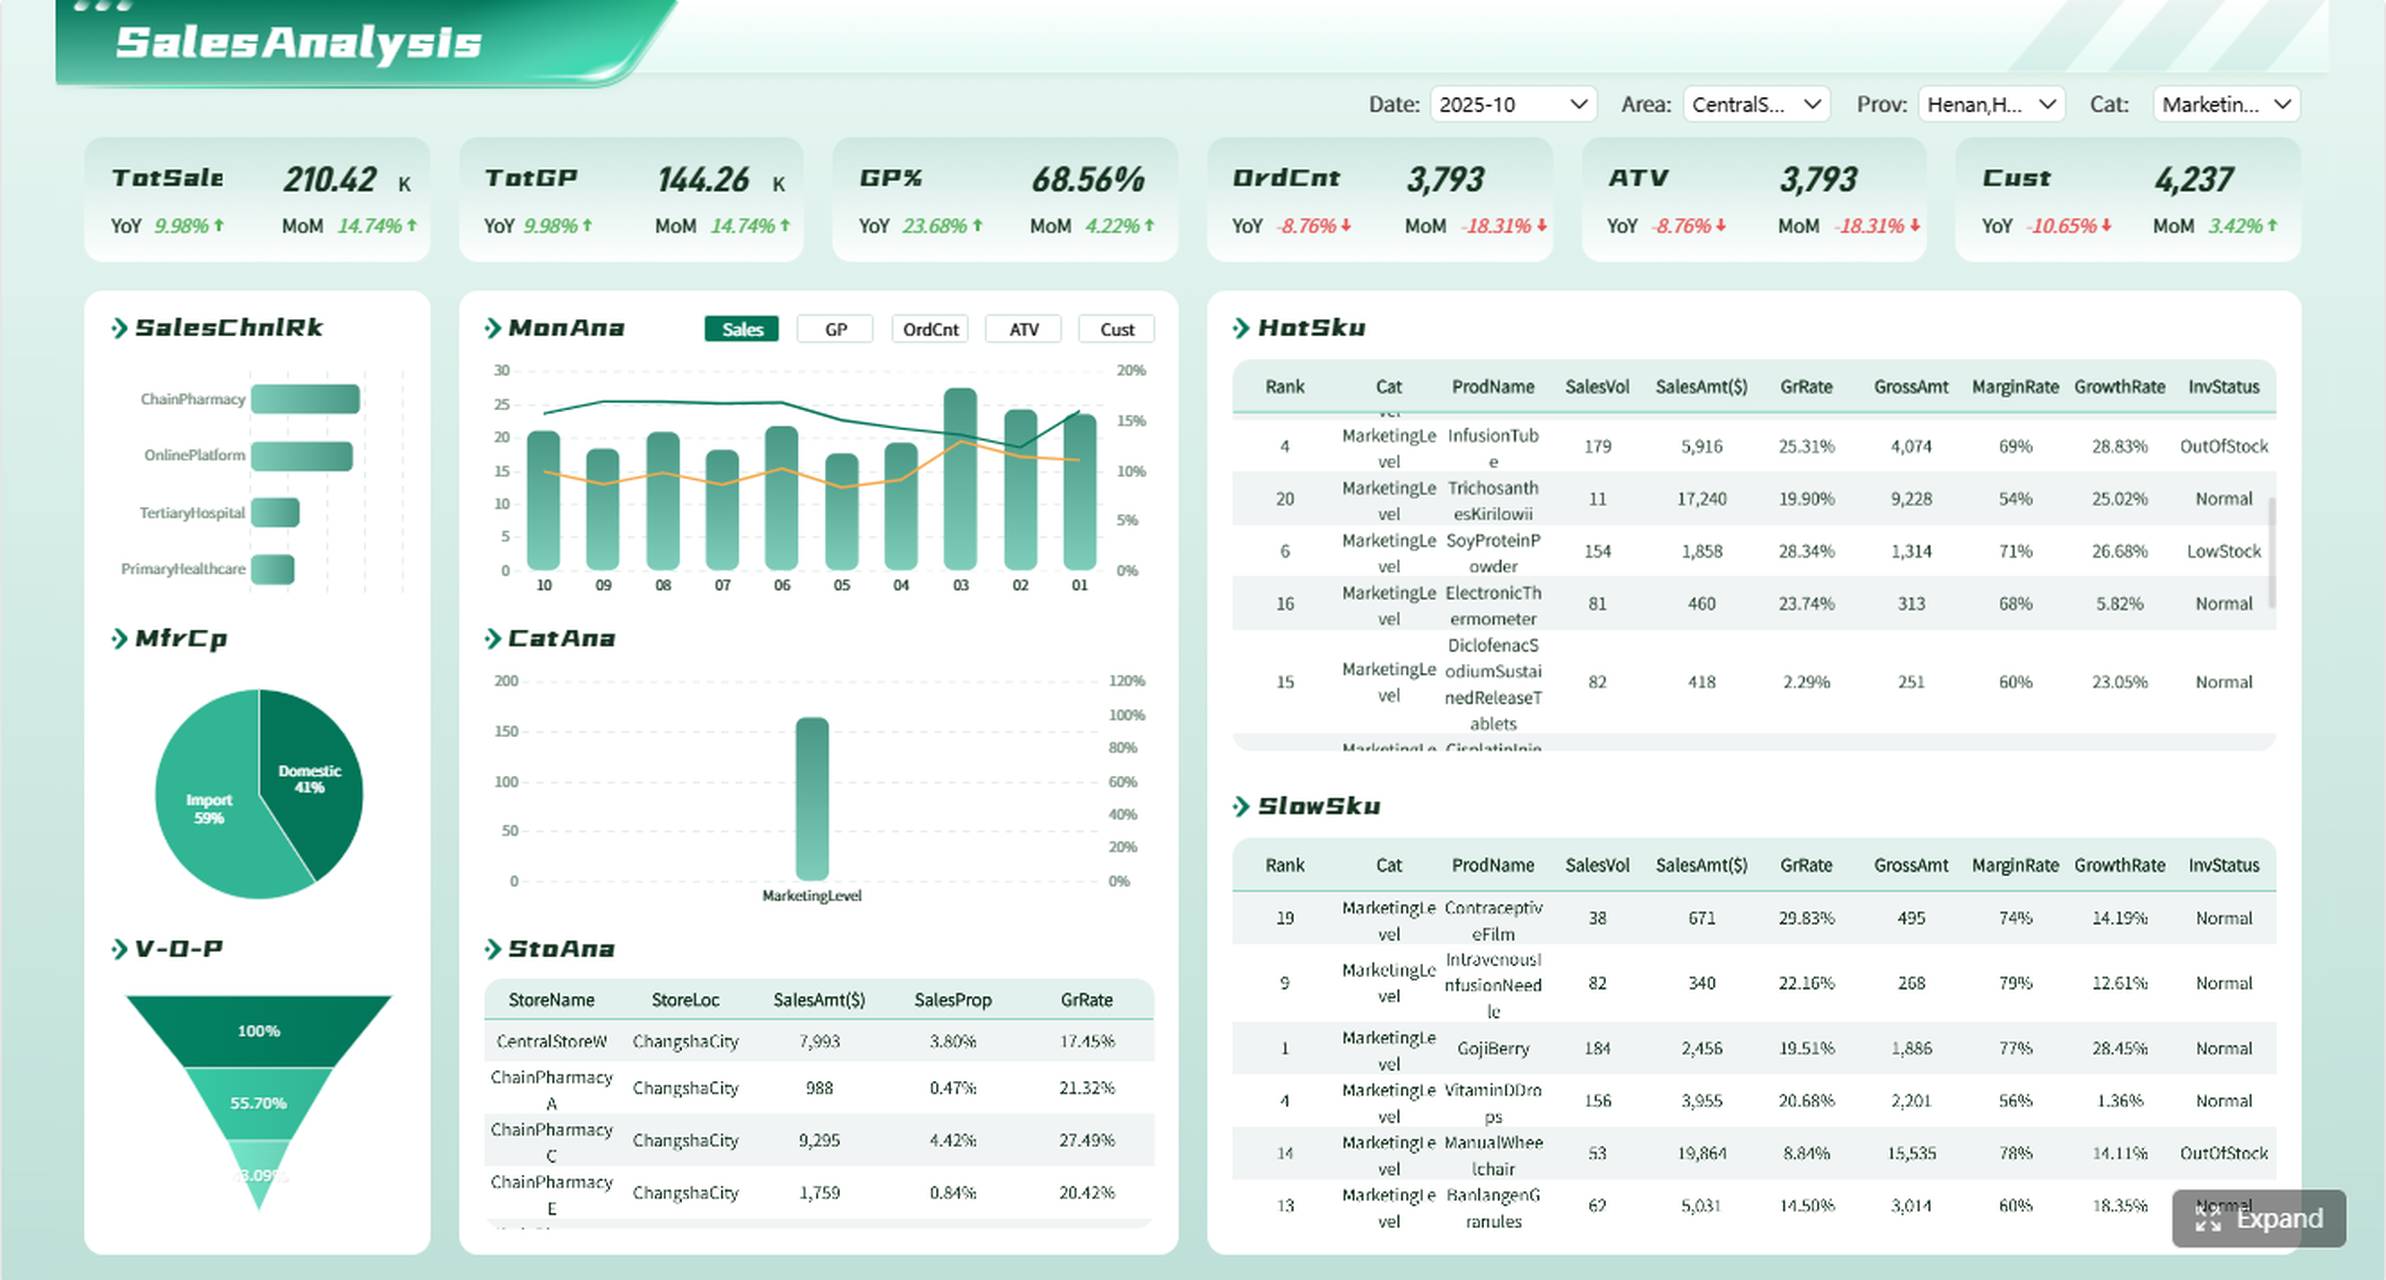
With FineBI + Dora, business users can ask for analysis in chat, generate chart-based answers or dashboard-style views from trusted BI assets, and receive scheduled summaries before the next meeting.
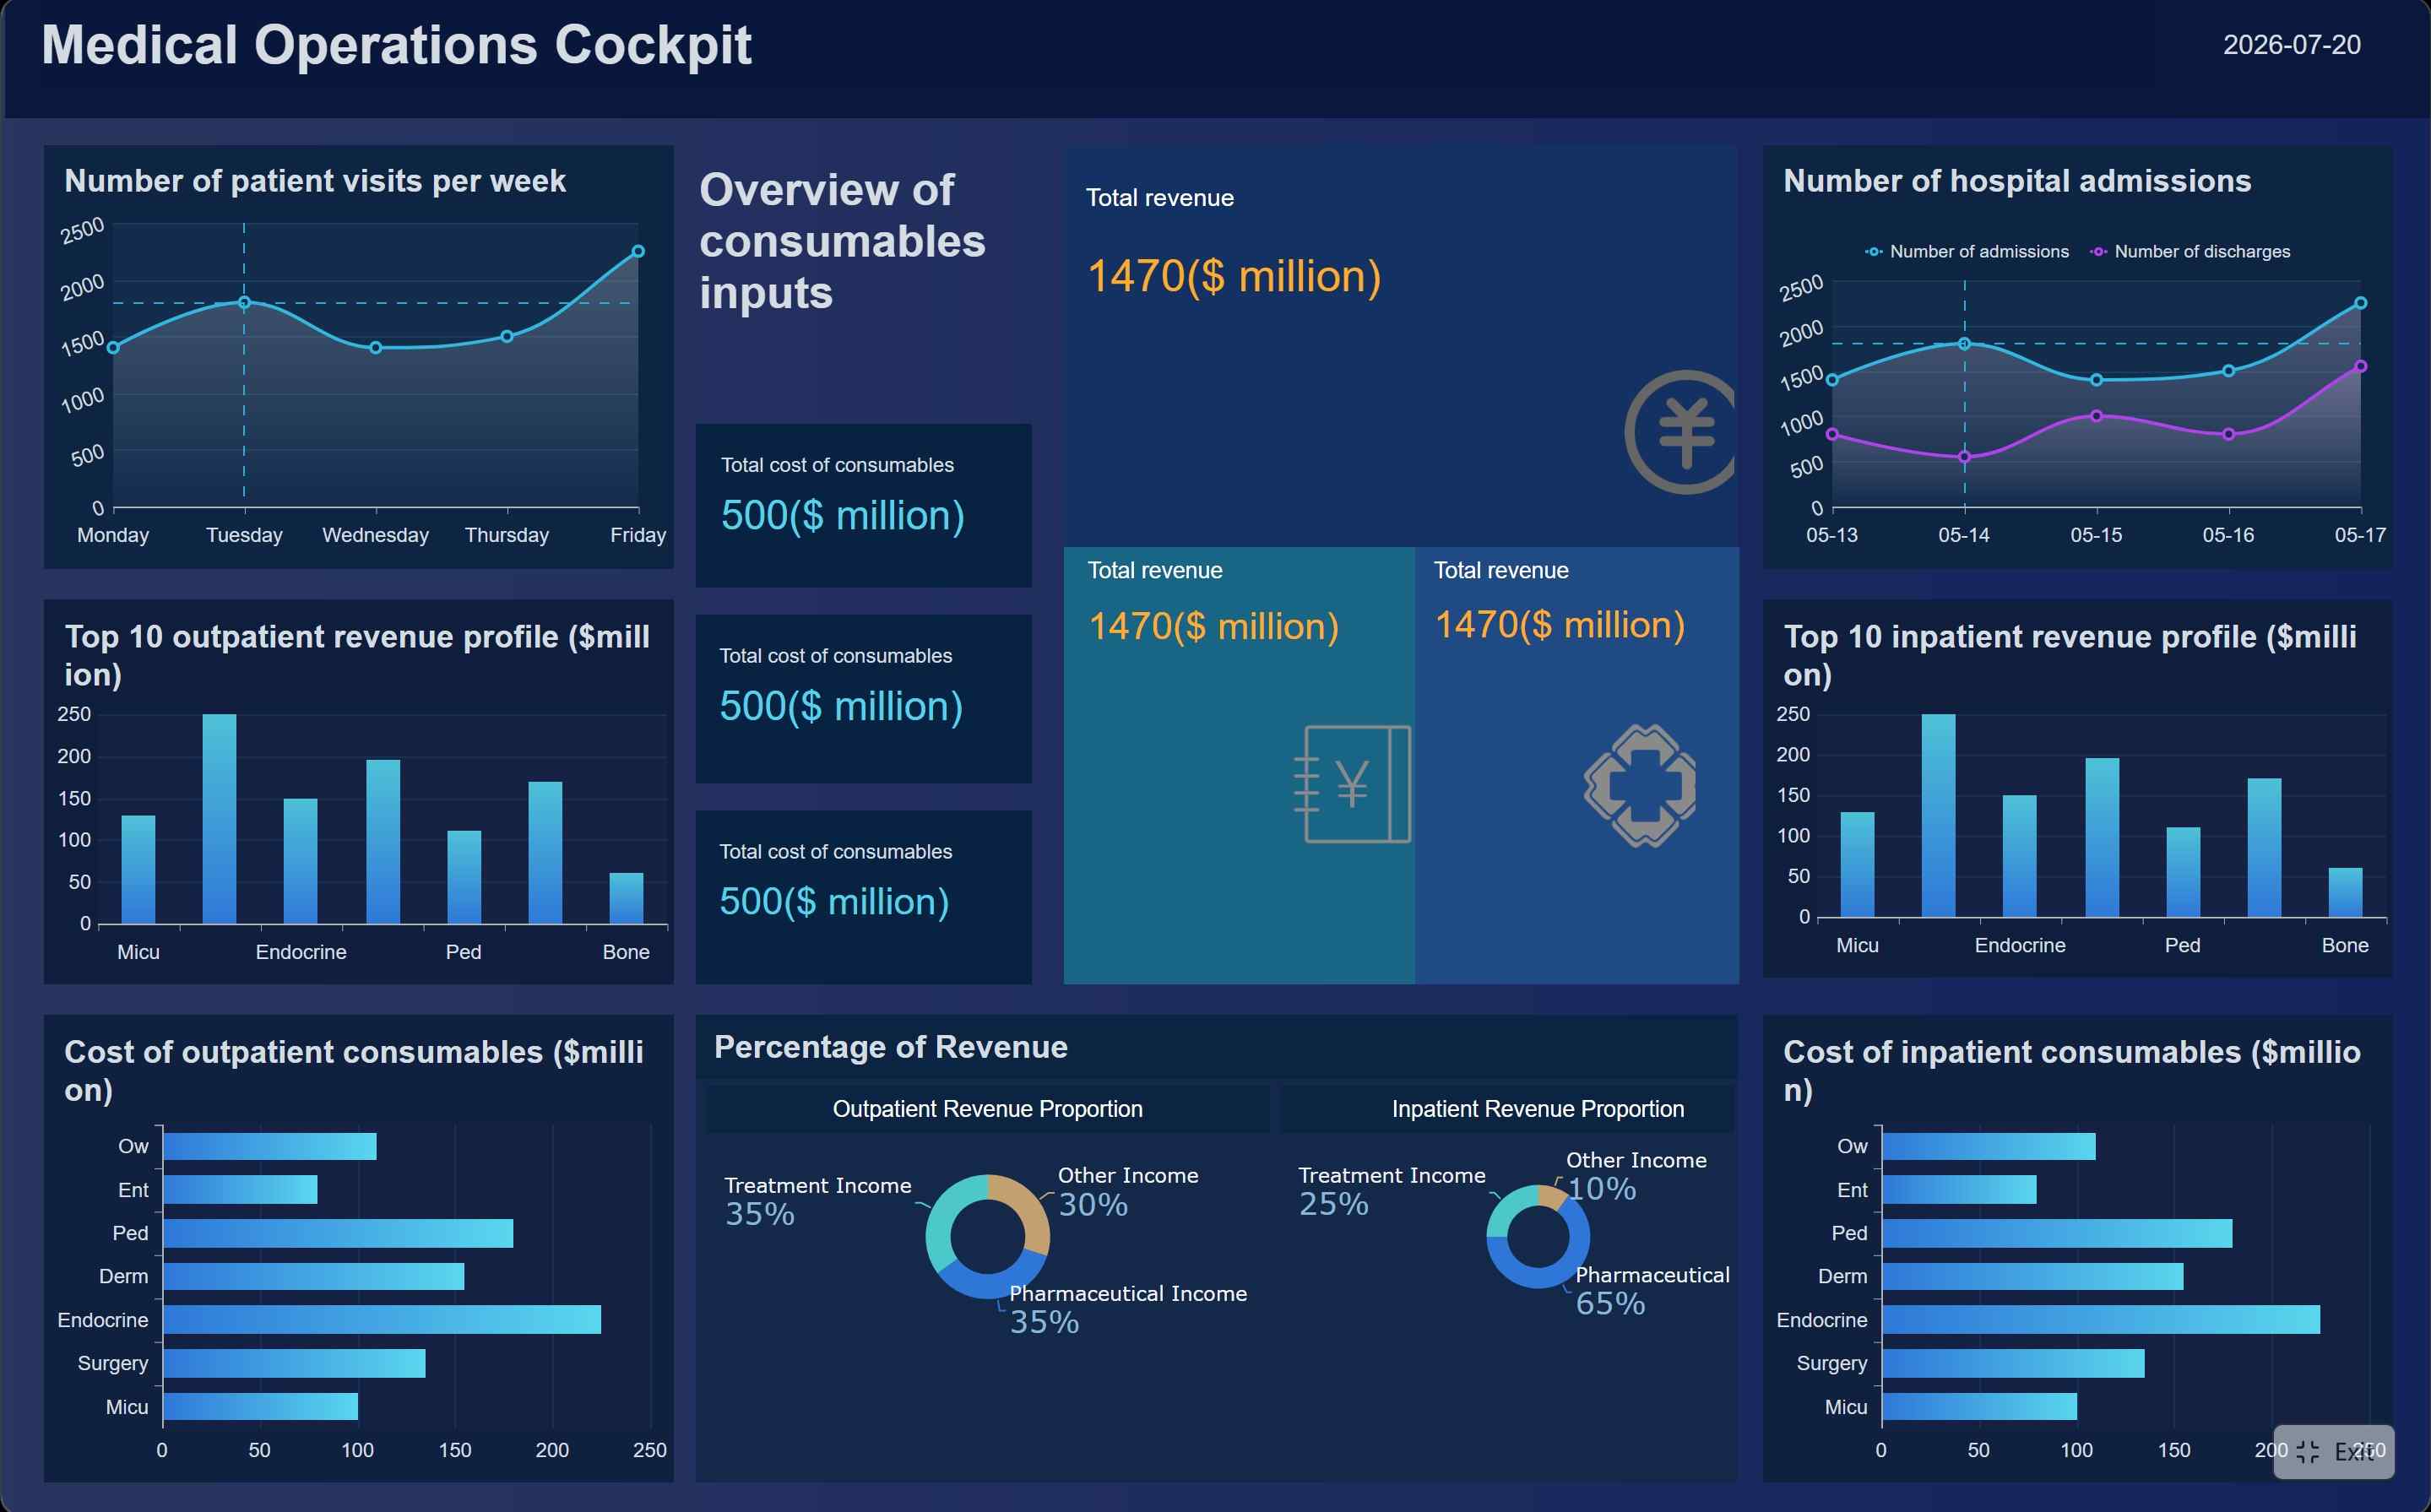 This medical operations dashboard displays hospital patient, revenue and medical supply cost data across multiple charts.
The biggest mistake buyers make is assuming all free tools solve the same problem. They do not.
Some are built for reporting, meaning they turn social data into summaries, charts, exports, or client-ready deliverables. Others are better for analytics dashboards, where the focus is ongoing performance review. Still others are really social listening or monitoring tools, designed to track mentions, hashtags, trends, or brand sentiment rather than create polished reports.
What “free” usually means now
When evaluating free social media reporting tools, expect one of these models:
- Forever-free plans: Useful for individuals or very small teams, but often capped by profile count, users, exports, or feature access.
- Free trials: Better if you want to test advanced scheduling, white-label reporting, competitor analysis, or automation before buying.
- Restricted exports: Some tools let you view dashboards for free but limit PDF, PPT, CSV, or branded report downloads.
- Capped connected accounts: Free tiers often allow one brand, one workspace, or a handful of profiles.
- Limited date ranges: Historical reporting is one of the first features pushed behind a paywall.
- Partial feature access: You may get owned-channel analytics but not competitor benchmarking, paid social reporting, or cross-network comparisons.
This matters because a free tool can look impressive and still be wrong for your use case.
- Reporting tools focus on exports, summaries, scheduled reports, and stakeholder communication.
- Analytics dashboards focus on performance exploration, trends, KPIs, and ongoing optimization.
- Monitoring or listening tools focus on mentions, reputation, hashtags, competitor chatter, and industry trend spotting.
If you mainly need monthly client updates, a simple report generator may be enough. If you need multi-platform decision support, a dashboard tool is more useful. If you care about brand health and conversations, look for monitoring first and polished reporting second.
Realistic expectations by team type
Different users hit free-plan limits at different speeds.
Small teams and freelancers
Free tools can work surprisingly well if you:
- manage a few social profiles
- do not need custom branding
- only need monthly summaries
- can live with manual exports or screenshots
Agencies
Agencies usually hit free-plan limits quickly because they need:
- multiple client workspaces
- branded exports
- repeatable templates
- scheduled reporting
- collaboration controls
Free can still help for trial projects or internal testing, but agencies often outgrow it first.
In-house marketers
In-house teams often land in the middle. A free tool may be enough if reporting is simple and internal. But once leadership asks for cross-channel comparisons, campaign attribution, or regular executive summaries, the limitations show up fast.
2) How we evaluated the best free options
To assess the best social media reporting tools free in 2026, the key question is not “Which tool has the most features?” It is “Which tool gives useful reporting value before asking for payment?”
We looked at practical evaluation criteria rather than marketing claims.
Setup time and usability
A free tool is not helpful if it takes hours to configure. We prioritized tools that let users:
- connect accounts quickly
- find core metrics without heavy training
- navigate dashboards easily
- get value without a complex onboarding process
This matters even more for small teams and marketers who do not have a dedicated analyst.
Supported networks and data coverage
A good free option should support the channels you actually use. Common priorities include:
- Facebook
- Instagram
- LinkedIn
- TikTok
- X
- YouTube
- Pinterest
A long platform list sounds great, but relevance matters more. A tool that works deeply on your top two channels is often more useful than one that lightly touches seven.
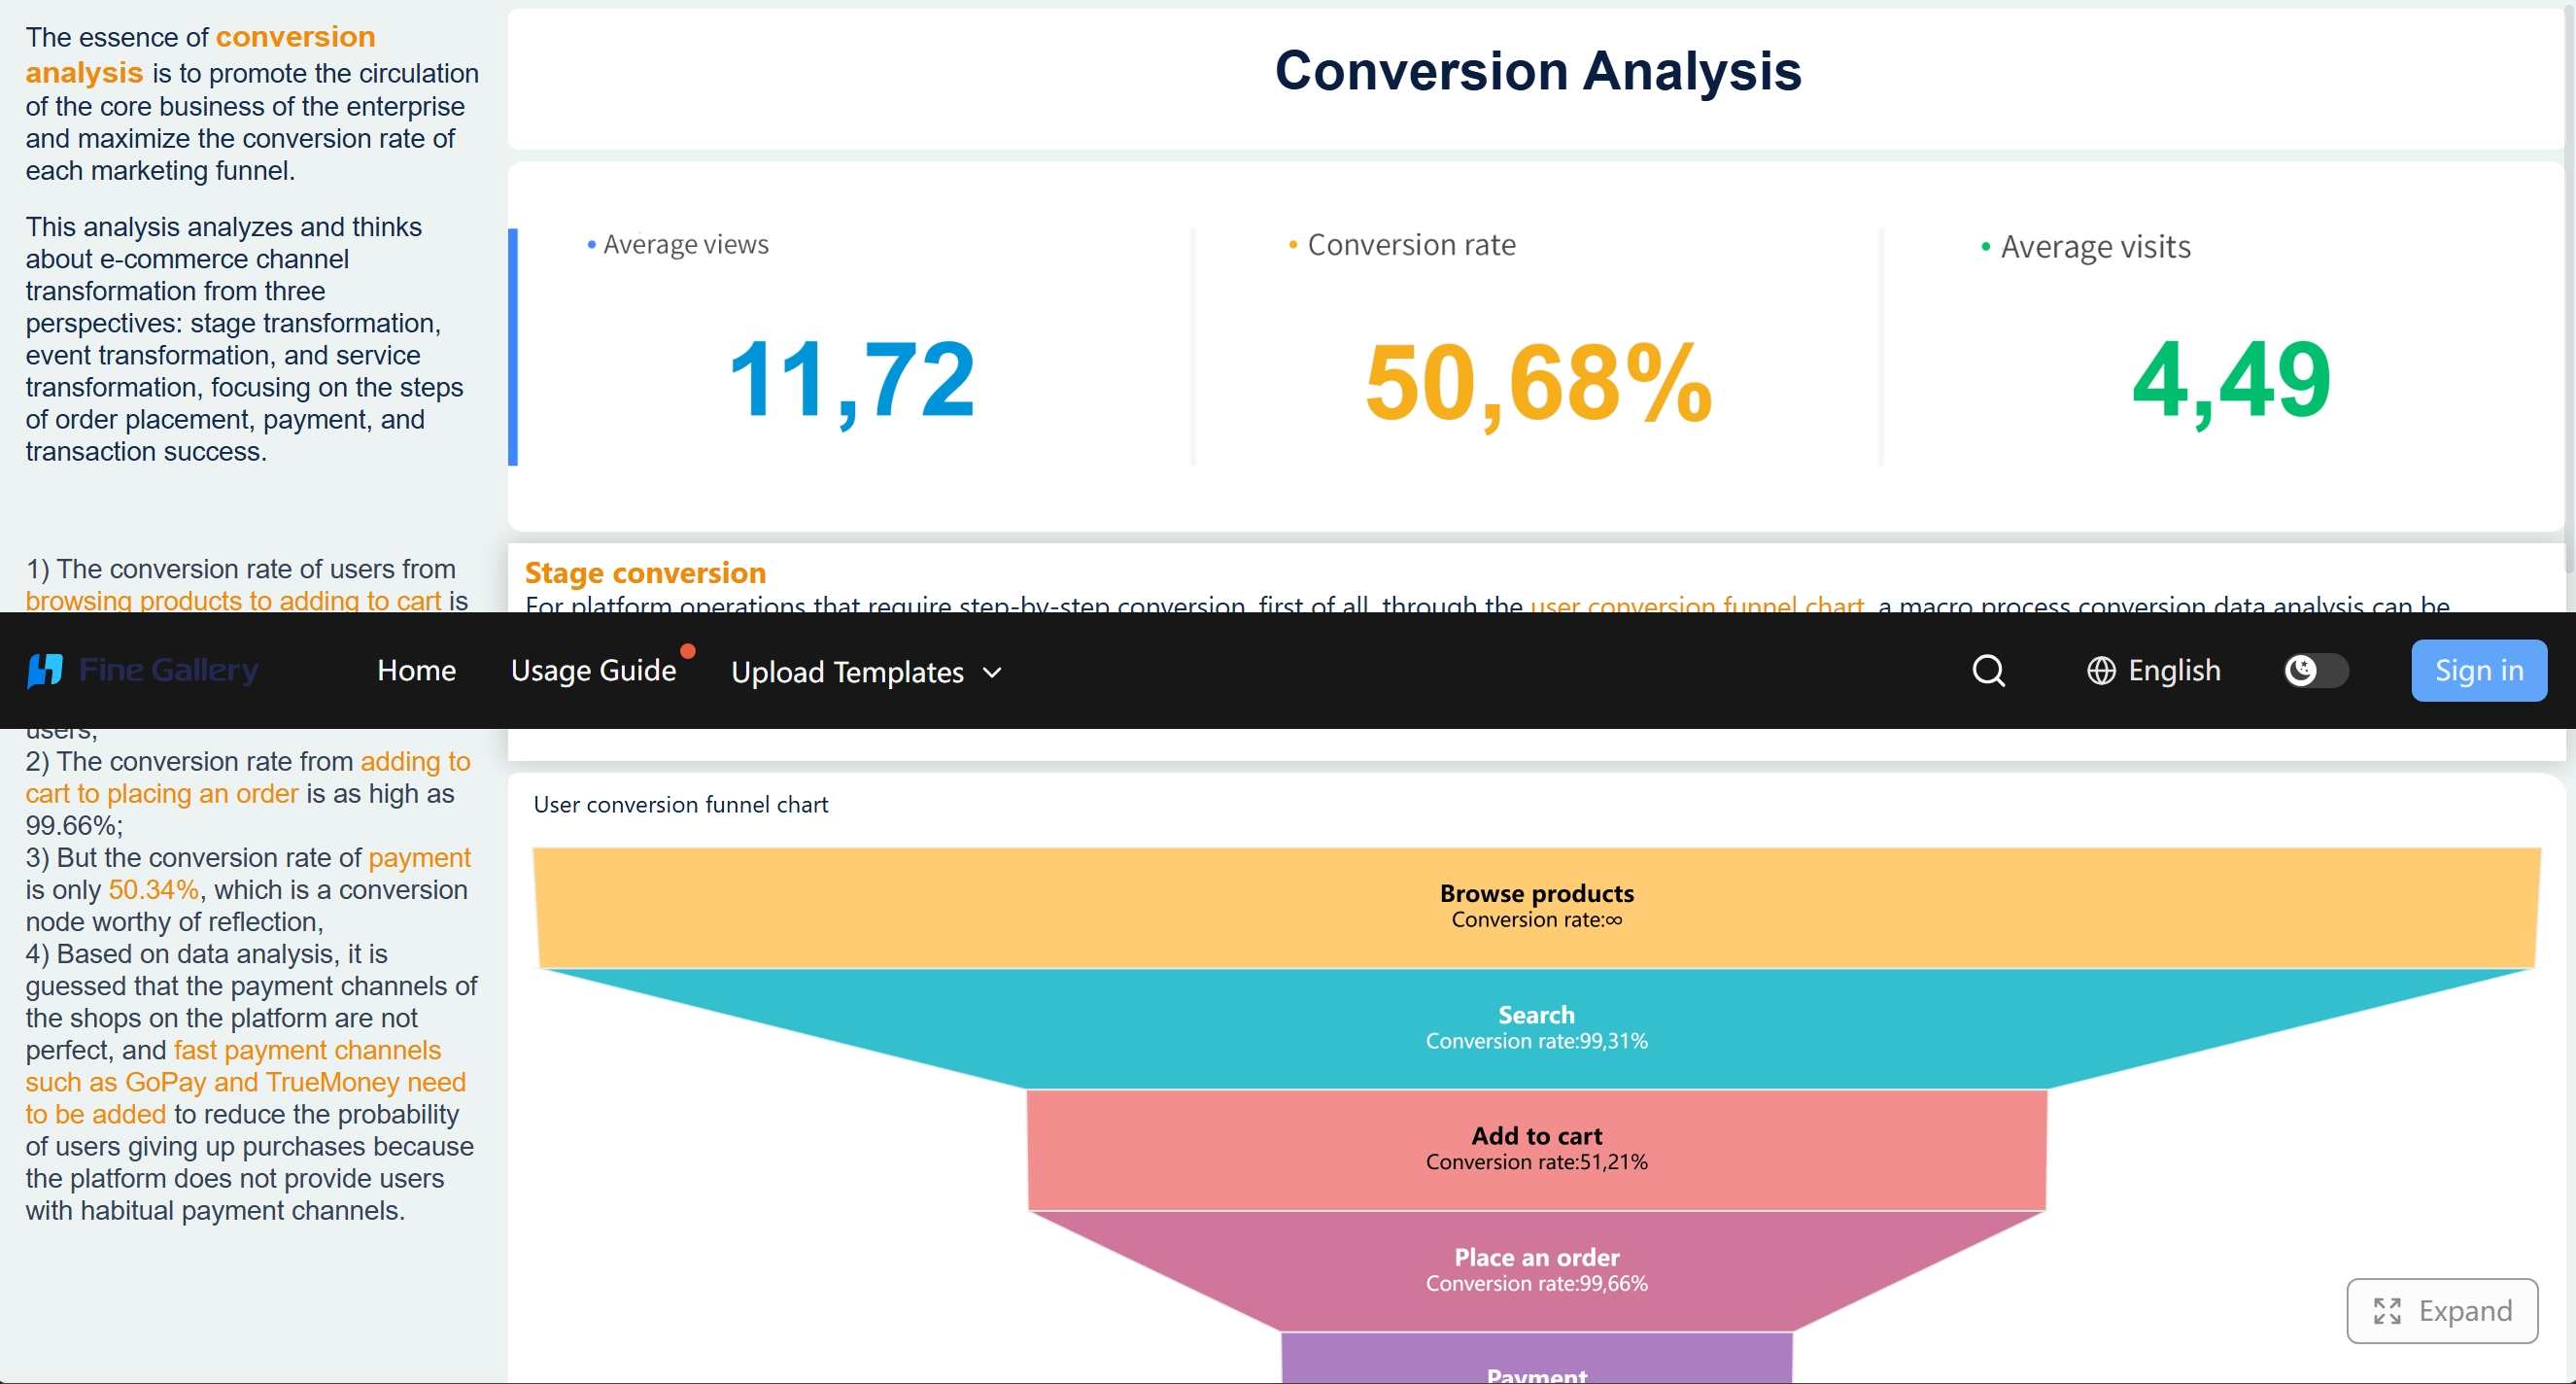 This e-commerce conversion analysis dashboard visualizes key metrics and a multi-stage user purchase funnel to identify conversion bottlenecks.
Report quality and export options
We compared whether tools offer:
- clean dashboards
- presentation-ready charts
- CSV or spreadsheet exports
- PDF or slide exports
- one-off report templates
- scheduled report delivery
For many users, this is the dividing line between “interesting analytics” and “usable reporting.”
Collaboration, white-labeling, and scheduling
These features often separate hobby use from professional use.
We checked whether the free version includes or restricts:
- multiple users
- shared workspaces
- client access
- branded reports
- white-label features
- automated report scheduling
Research, campaign analysis, and competitor review
We also considered whether the tool is useful for:
- social media marketing research
- campaign performance reviews
- competitor benchmarking
- client reporting
- basic social media analysis across time periods
Some free platforms are better for owned-content reporting, while others are better for comparing public accounts or spotting trends.
Accessibility and learning curve
Finally, we looked at how accessible each tool feels in real use. For a free tool, clean design and low friction matter. If core analytics are buried, adoption drops.
Below are the most practical free options for different reporting needs. This is not a ranking based on the flashiest homepage. It is a working shortlist based on what users actually get before paying.
View Free Social Media Reporting Templates
All free native social media reporting tools like Meta Analytics, TikTok Analytics and Looker Studio only support single-platform data and cannot merge cross-channel social metrics in one dashboard. They also lack customizable report templates and enterprise collaboration functions. If you need a unified tool to combine all your social media data, FineBI with ready-made templates from Fine Gallery is the best choice.
Free access type: Forever-free native tool
Ideal use case: Facebook and Instagram reporting for small businesses and in-house teams
Biggest strength: First-party data and no extra software cost
Biggest limitation: Limited cross-platform reporting outside Meta properties
When upgrading starts to make sense: When you need multi-platform reports, better exports, or agency workflows
Meta Business Suite remains one of the most practical free options for owned Facebook and Instagram reporting. It covers core metrics such as reach, engagement, audience trends, and content performance. For teams focused primarily on Meta channels, it can be enough for recurring monthly reviews.
It is better described as a native analytics dashboard than a complete reporting suite. Exports and presentation quality are not always ideal for polished stakeholder reporting, but the value is hard to beat if your footprint is mostly inside Meta.
2. Instagram Insights
Free access type: Forever-free native tool
Ideal use case: Solo creators and brands that live primarily on Instagram
Biggest strength: Easy mobile access to post, Reel, Story, and audience performance
Biggest limitation: Single-platform only and not built for cross-channel reporting
When upgrading starts to make sense: When you need exports, templates, or comparisons beyond Instagram
Instagram Insights is still one of the easiest free social media analysis tools to use. It is immediate, native, and useful for creators who need fast post-level insight. It helps answer practical questions like which Reels drove the most reach, when followers are active, and what content generated profile visits or follows.
It is less a report generator and more a built-in analytics view. Great for optimization, not great for multi-stakeholder reporting.
3. TikTok Studio Analytics
Free access type: Forever-free native tool
Ideal use case: Brands and creators focused on short-form video performance
Biggest strength: Strong content-level metrics such as watch time and audience retention
Biggest limitation: Limited usefulness if you need cross-network summaries
When upgrading starts to make sense: When TikTok data needs to sit beside Meta, LinkedIn, or YouTube performance
TikTok Studio Analytics is excellent for understanding content performance on the platform itself. If your reporting goal is improving video strategy, it is one of the strongest free options available. It gives enough depth to support campaign reviews, content diagnostics, and audience behavior analysis.
If you only need TikTok reporting, it can carry you a long way. If you need unified marketing reports, it cannot do the whole job alone.
4. YouTube Studio Analytics
Free access type: Forever-free native tool
Ideal use case: Video-first brands, educators, and creators
Biggest strength: Deep first-party insight into views, watch time, CTR, and retention
Biggest limitation: Built for YouTube performance, not social reporting across channels
When upgrading starts to make sense: When leadership wants broader campaign or social mix reporting
YouTube Studio offers some of the richest free analytics anywhere in social. For teams that treat YouTube as a major content engine, this is a must-use source of truth. It supports granular content analysis and helps marketers move beyond vanity metrics.
Like other native tools, it is powerful but narrow. You will likely need another layer if you want executive-ready multi-channel reporting.
5. LinkedIn Analytics
Free access type: Forever-free native tool
Ideal use case: B2B teams and professional brands
Biggest strength: Direct page and audience analytics for LinkedIn performance
Biggest limitation: Reporting depth can feel limited compared with dedicated third-party tools
When upgrading starts to make sense: When you need better exports, benchmarking, or cross-channel rollups
LinkedIn Analytics is often overlooked in “free tool” roundups, but for B2B marketers it belongs on the list. It supports core reporting around impressions, engagement, follower growth, and content performance. For internal reviews, that may be enough.
Its biggest weakness is reporting polish. It is useful, but not always convenient for repeatable executive reporting.
6. Looker Studio with social connectors
Free access type: Free dashboard platform, though some connectors may cost money
Ideal use case: Marketers who want customizable dashboards and can handle some setup
Biggest strength: Flexible reporting and dashboard building
Biggest limitation: Connector quality and maintenance vary
When upgrading starts to make sense: When you need easier setup, stronger support, or managed reporting
Looker Studio is not a native social platform and not a turnkey social reporting app, but it is a practical free choice for users who want flexible dashboards. If you can feed social data into it, you can build custom views for recurring reporting.
This is best for people comfortable with a bit of dashboard logic. It is less beginner-friendly than native analytics, but more powerful for combining sources.
7. Social Status
Free access type: Free plan or free trial depending on feature scope
Ideal use case: Agencies and brands that want stronger reporting exports
Biggest strength: Good export options and strong reporting orientation
Biggest limitation: The best automation and customization features are not usually fully free
When upgrading starts to make sense: As soon as you need recurring reports, more profiles, or white-labeling
Social Status is one of the more reporting-focused tools in this category. It leans toward automated reporting, profile analytics, competitor analysis, and boardroom-friendly exports. That makes it more useful than many “free analytics” tools if your main pain point is turning performance into a deliverable.
For agencies or brands testing external reporting workflows, it is a strong option to trial before paying.
Free access type: Free tools plus limited trial access
Ideal use case: Competitor review, benchmarking, and content analysis
Biggest strength: Helpful for social media marketing research and comparative analysis
Biggest limitation: Full reporting workflows live behind paid tiers
When upgrading starts to make sense: When you need deeper retention, competitor sets, and shareable recurring reports
Socialinsider is especially useful if your main goal is not just reporting owned performance but also benchmarking against competitors. Its free tools can help with engagement calculations, profile comparisons, and top-level analysis.
It is less of a forever-free full suite and more of a practical way to test whether competitor-focused analytics are worth paying for.
9. Metricool
Free access type: Forever-free plan with feature limits
Ideal use case: Small businesses and marketers who want publishing plus analytics in one place
Biggest strength: Balanced mix of scheduling, analytics, and simple reporting
Biggest limitation: Free plan caps and lighter reporting sophistication
When upgrading starts to make sense: When you need more brands, deeper history, or stronger stakeholder reporting
Metricool remains popular because it is useful, approachable, and broad enough for growing teams. It combines content planning, analytics, and lightweight reporting in one interface. That makes it attractive for marketers who want an all-in-one operational tool before investing in a dedicated reporting stack.
It may not be the most advanced option, but it is one of the more practical free paths for everyday use.
Best for solo creators and small businesses
The best starting points are usually:
- Instagram Insights
- TikTok Studio Analytics
- YouTube Studio Analytics
- Meta Business Suite
- Metricool
These tools are simple, accessible, and sufficient for basic performance reporting.
Best for agencies that need simple client-ready exports
The best free or trial-first options are usually:
- Social Status
- Looker Studio
- Metricool
These are more useful when presentation quality matters, though agencies often outgrow the free tier quickly.
Best for teams that care more about monitoring mentions and trends than polished reports
The best fit is usually not a pure reporting tool at all. In those cases, monitoring and listening platforms or free comparison tools can be more useful than dashboard software. Socialinsider’s free comparisons can help here, but teams focused heavily on mentions and trend tracking often need a different category of product.
4) What you actually get before paying
This is where expectations need to be realistic. Most free social media reporting tools are designed to help you start, not stay forever.
Features commonly included for free
The most common free features include:
- basic post performance metrics
- engagement and reach summaries
- account growth tracking
- limited dashboard views
- lightweight date filtering
- one-off report views
- basic templates
- simple exports or screenshot-friendly charts
In some cases, you can also get a basic free social media report generator experience, especially for one-off summaries or channel-specific reporting.
Limits that push users toward paid plans
The most common limits are predictable:
- watermarked exports
- fewer connected profiles
- short data retention windows
- missing competitor benchmarks
- no custom branding
- limited user seats
- no scheduled reports
- restricted automation
- fewer comparison views across platforms
This is the real gap between free social media analysis tools and full reporting suites. Free tools help you understand performance. Paid suites help you operationalize reporting.
For example, you may be able to see top-performing posts for free, but not automate a weekly stakeholder summary. You may be able to export a basic chart, but not white-label a client deck. You may be able to track one profile, but not a portfolio of brands.
How an AI Data Agent Handles This Scenario
At some point, the reporting problem stops being “Where can I find free metrics?” and becomes “How do I turn recurring social data work into a repeatable process?”
This is where FineBI + Dora becomes relevant for larger teams, multi-brand environments, agencies with reporting complexity, or enterprises trying to standardize marketing reporting beyond scattered native dashboards.
The most relevant Dora digital employee here is the Daily Briefing Secretary, often working alongside a Data Analyst digital employee.
Instead of having marketers manually open five native analytics panels and stitch screenshots into slides, Dora can sit on top of trusted FineBI dashboards and semantic assets to support governed, repeatable social reporting workflows.
A scenario-specific query could look like this:
“Show me this month’s social performance by channel, campaign, and content type. Highlight engagement drops, top-performing posts, and prepare a summary for tomorrow’s marketing review.”
How Dora works in this reporting scenario
-
Retrieve trusted FineBI dashboard or analysis-subject data.
FineBI consolidates social KPIs, campaign tags, channel data, and reporting dimensions into trusted dashboards and governed metric models.
-
Understand KPI definitions, filters, business terms, and semantic rules.
Dora uses the governed semantic layer so terms like engagement rate, campaign period, branded content, or paid versus organic follow agreed definitions instead of prompt guesswork.
-
Generate chart-based answers or dashboard-style analysis views through chat.
A marketing manager can ask for social performance by region, channel, or content pillar and receive a chart-based answer instead of manually rebuilding the view.
-
Detect abnormal changes or threshold breaches.
If LinkedIn engagement drops sharply week over week or a campaign underperforms against threshold rules, Dora can flag the exception.
-
Push insights, alerts, or suggested follow-up actions to responsible users.
Instead of waiting for the next reporting meeting, Dora can send scheduled summaries, anomaly alerts, or campaign performance pushes to the right owners.
-
Produce follow-up summaries for meetings or management review.
Dora can help prepare a briefing summary using trusted FineBI assets, reducing repetitive analyst effort and improving consistency across reports.
Free tools are good at exposing metrics. They are rarely good at handling the full reporting workflow across teams.
That workflow usually includes:
- combining multiple channels
- enforcing KPI definitions
- aligning campaign names and dimensions
- generating recurring summaries
- pushing alerts before meetings
- preserving access permissions
- making outputs usable for non-analysts
This is why Dora should be positioned as an enterprise Data Agent and AI assistant, not a generic chatbot. It works best when FineBI provides the trusted dashboard, metric, and semantic foundation underneath.
FineBI’s role in trusted reporting
FineBI is the BI foundation in this scenario. It helps teams build:
- social reporting dashboards
- metric models
- campaign dimensions
- channel comparisons
- trusted semantic assets
- governed permissions
Without that foundation, AI answers are just text over messy data. With it, Dora can support more controlled Agentic BI workflows.
How Dora improves execution
Dora helps enterprises move from people manually checking dashboards to AI helping them:
- ask for analysis in natural language
- retrieve dashboard and metric views from FineBI assets
- generate chart-based answers
- create scheduled daily or weekly briefings
- monitor anomaly conditions
- push timely updates to owners
- support follow-up before review meetings
Compared with raw prompt-only agents, this governed workflow is a better enterprise fit because it is tied to permissions, KPI governance, semantic rules, and reusable Skills. It also supports more controllable and auditable execution for recurring reporting work.
The right choice depends more on your workflow than on the tool’s marketing page.
Choose based on your primary goal
Pick one primary use case first.
Campaign reporting
If you need to summarize campaign performance for stakeholders, prioritize tools with:
- clean exports
- date comparisons
- campaign tagging support
- presentation-ready visuals
Ongoing analytics
If you need to improve content performance week by week, prioritize:
- post-level metrics
- trend charts
- audience insights
- content breakdowns
If your focus is competitive review or content benchmarking, prioritize:
- public account comparisons
- content analysis
- engagement benchmarking
- market trend visibility
Brand monitoring
If your main concern is mentions and trend watching, choose monitoring-oriented tools instead of expecting a reporting suite to do listening well.
Do not choose based on the longest feature list. Choose based on your active channels and reporting needs.
A B2B team heavy on LinkedIn and YouTube should evaluate differently than a local retailer focused on Instagram and Facebook. A creator living on TikTok will get more value from native analytics than from a generic dashboard with shallow platform support.
Questions to ask before upgrading
Before paying, ask these questions:
- Do you need scheduled reports?
- Do you need stakeholder-ready dashboards?
- Do you need more historical data?
- Do you need multi-platform comparisons?
- Do you need white-label exports?
- Do you need competitor benchmarking?
- Do you need collaboration across teams or clients?
- Is the free version enough to validate your reporting process first?
If the free tool lets you prove your workflow, that is already a win. You can upgrade later with more confidence and less waste.
There is no single universal winner in social media reporting tools free. The best choice depends on what kind of reporting problem you are trying to solve.
Best practical free options by use case
- Best for Meta-focused businesses: Meta Business Suite
- Best for Instagram-first creators: Instagram Insights
- Best for TikTok performance analysis: TikTok Studio Analytics
- Best for YouTube reporting depth: YouTube Studio Analytics
- Best for B2B LinkedIn teams: LinkedIn Analytics
- Best for flexible custom dashboards: Looker Studio
- Best for testing stronger exports and report automation: Social Status
- Best for competitor review and social media marketing research: Socialinsider
- Best all-around small business starter: Metricool
Who can stay free longer
You can usually stay on free plans longer if you are:
- a solo creator
- a small business with one or two primary channels
- an in-house marketer with simple internal reporting
- a team comfortable with manual exports and basic dashboards
Who will hit limits quickly
You will likely hit the wall fast if you are:
- an agency managing multiple clients
- a multi-brand team
- a company needing scheduled executive reporting
- a team requiring custom branding and polished deliverables
- an organization needing cross-channel governance and consistent KPI definitions
How to trial paid features without wasting time
The smartest approach is to use free tools to validate your reporting process first. Learn:
- which KPIs matter
- which channels matter
- which exports are actually needed
- which stakeholders need what level of detail

Then test paid features with a real workflow, not a generic product tour.
Actionable Best Practices
1. Standardize KPI definitions early
Even simple social reporting breaks when teams define metrics differently. Decide how you define engagement, growth, campaign windows, and paid versus organic splits before building recurring reports.
2. Build a semantic layer inside the BI workflow
If social data needs to be compared across channels, dashboards, and business teams, a semantic layer matters. FineBI helps teams build trusted metric and dashboard assets that make later AI use more reliable.
3. Start with one high-value recurring workflow
Do not automate everything at once. Start with a concrete reporting scenario such as:
- weekly brand performance summary
- monthly campaign review
- executive pre-meeting briefing
- underperforming channel alert
This is where Dora lands best as an AI digital employee.
4. Preserve permissions and governance in AI workflows
AI-generated reporting must still respect access boundaries. Dora works better in enterprises because it can sit on governed FineBI assets instead of bypassing permission logic with ad hoc prompts.
5. Use human review for AI-generated summaries
Dora can accelerate summaries, alerts, and follow-up, but review still matters. Human validation is especially important during the rollout stage while teams refine semantic rules, Skills, and KPI mappings.
FineBI + Dora Solution Pitch
Building this manually is complex. FineBI helps teams build trusted dashboards, metrics, and semantic assets. Dora turns those assets into an AI assistant that can answer questions in chat, generate dashboard-style analysis views, push scheduled summaries, monitor anomalies, and follow up with responsible owners.
For social reporting teams, that means moving beyond disconnected native analytics and spreadsheet-heavy reporting cycles. FineBI provides the governed reporting foundation. Dora adds the execution layer for recurring questions, weekly briefings, exception monitoring, and management preparation.
FineBI + Dora is not only a BI upgrade; it is a practical fourth-generation Agentic BI path. FineBI provides governed metrics and visual analysis. Dora provides the AI assistant layer for scenario execution, with more controlled Skills, lower token waste, faster execution paths, and more stable workflows than prompt-only agents.

Get Ready-to-Use Dashboard Templates in Fine Gallery
The strongest Dora pitch is scenario + product + service: FineBI provides the trusted BI foundation, Dora provides the AI digital employee, and implementation service connects data, governance, semantic setup, Skills, and rollout.