Dashboard
Best Small Business Dashboard Software in 2026: 8 Tools Reviewed for Features, Pricing, and Fit
Lewis Chou
Apr 21, 2026
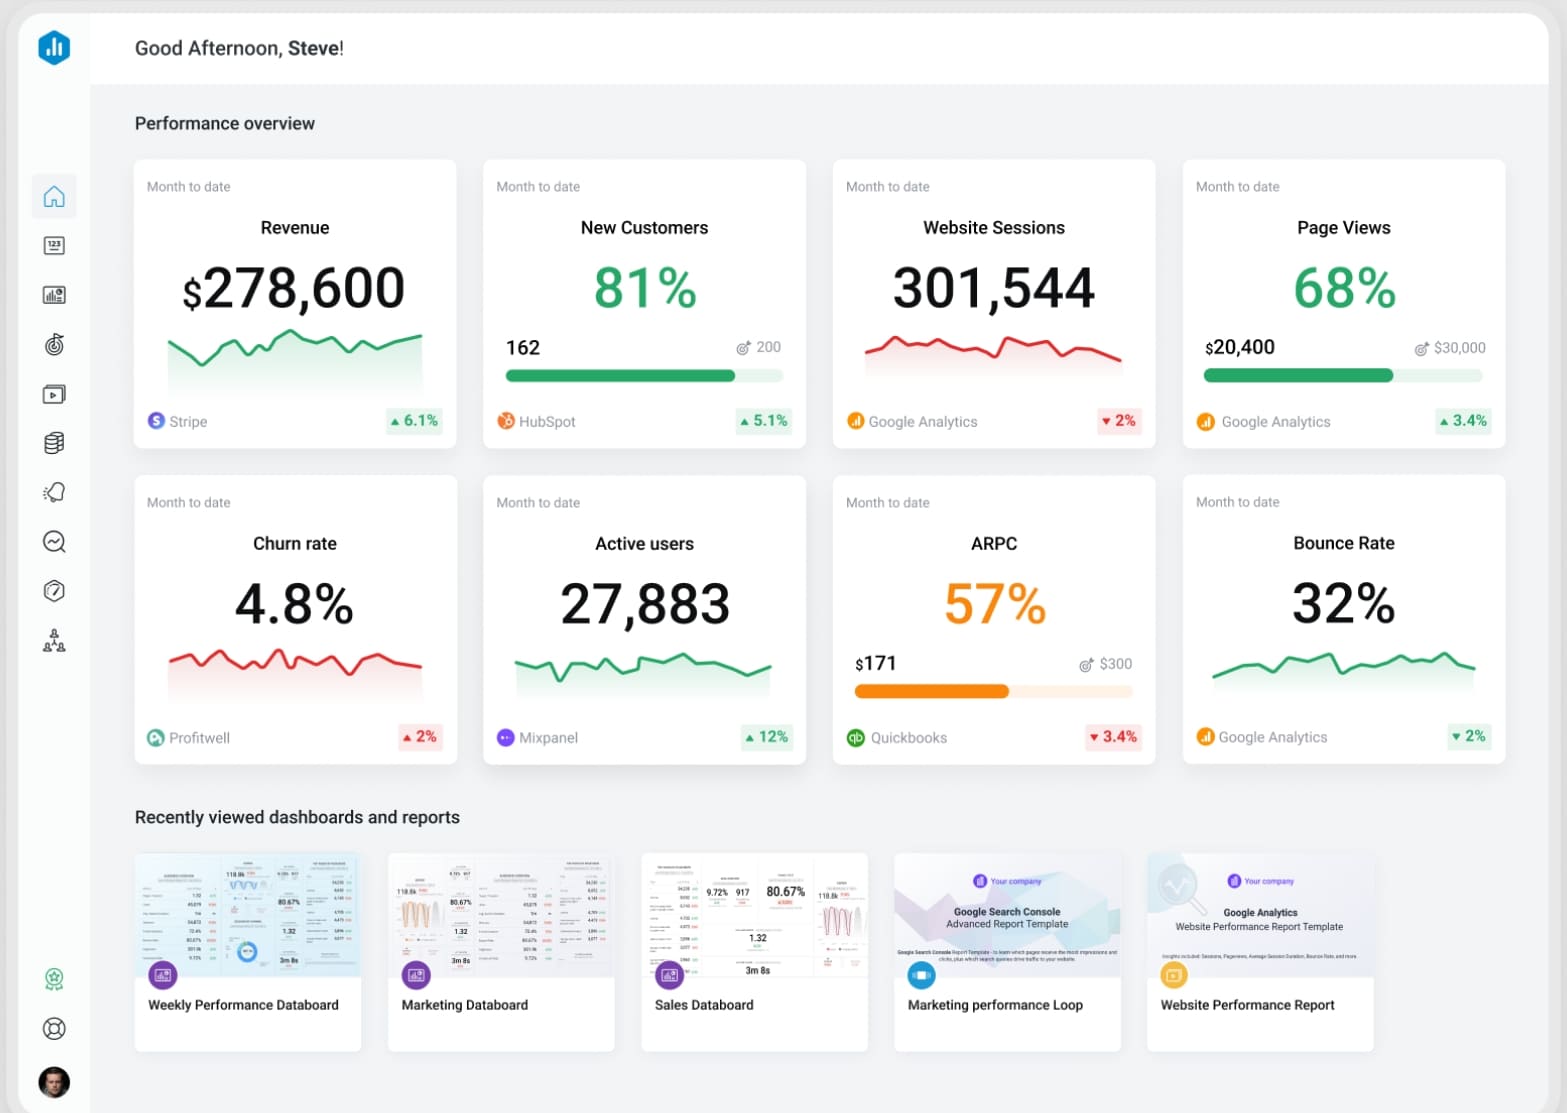
Small business dashboard software is a tool that pulls key business data into one visual workspace so owners and teams can track performance, spot issues, and make faster decisions.
Best Small Business Dashboard Software in 2026 at a Glance
Here is a quick comparison of the best small business dashboard software options for 2026 based on fit, pricing, usability, and reporting depth.
| Tool | Best Fit | Starting Price | Standout Features | Ease of Use |
|---|---|---|---|---|
| FineBI | Growing small businesses needing flexible dashboards and deeper analysis | Custom quote / business pricing | Self-service BI, drag-and-drop dashboards, multi-source data integration, scalable reporting | Moderate |
| Looker Studio | Budget-conscious teams and marketing reporting | Free | Google ecosystem integration, shareable dashboards, basic visualization | Easy |
| Zoho Analytics | Small businesses already using Zoho or needing affordable BI | From low-cost monthly plans | Data blending, AI assistant, broad app connectors | Easy to Moderate |
| Tableau | Businesses needing advanced visualization and analytical depth | Mid-to-high tier pricing | Powerful visual analytics, interactive dashboards, strong data exploration | Moderate to Advanced |
| Microsoft Power BI | Microsoft-based businesses needing strong value | Affordable per-user pricing | Deep Excel integration, broad connectors, powerful modeling | Moderate |
| Databox | Agencies, service businesses, and KPI tracking | Free tier and paid plans | Prebuilt KPI dashboards, client reporting, mobile-first experience | Easy |
| Klipfolio | Metric-heavy teams needing custom KPI dashboards | Mid-tier subscription pricing | Real-time metrics, custom formulas, TV dashboards, many connectors | Moderate |
| Geckoboard | Teams wanting simple live dashboards for visibility | Mid-tier subscription pricing | Real-time dashboards, goal tracking, office display views | Very Easy |
What these Small Business Dashboard Software do well in 2026
The best dashboard tools are no longer just chart builders. In 2026, strong platforms help small businesses:
- Connect data from multiple systems
- Automate recurring reporting
- Customize views by team or role
- Support mobile and browser access
- Scale from simple KPI tracking to more detailed analysis
Best platform snapshots by business type
If you want the short version:
- Startups and solo operators: Looker Studio, Databox, Geckoboard
- Service businesses and agencies: Databox, Klipfolio, FineBI
- Ecommerce brands: Looker Studio, Power BI, Zoho Analytics
- Growing teams needing more control: FineBI, Power BI, Tableau
What makes a dashboard tool worth the investment
A dashboard platform is worth paying for when it saves reporting time, reduces spreadsheet dependency, improves visibility across sales and operations, and gives your team trusted numbers in one place. For many small businesses, the real value comes from fewer manual updates and faster decisions rather than from advanced visuals alone.
How to Choose Small Business Dashboard Software
Choosing the right small business dashboard software starts with matching the tool to your reporting complexity, team skills, and growth plans.
Core features to compare
Before choosing a platform, compare these essentials:
- Reporting and dashboard creation: Can you build both simple KPI views and more detailed reports?
- Integrations: Does it connect to your CRM, accounting software, ecommerce platform, spreadsheets, and ad channels?
- Customization: Can you tailor dashboards for owners, sales teams, finance, and operations?
- Automation: Does it refresh data automatically and send scheduled reports or alerts?
- Mobile access: Can you check performance on mobile without losing usability?
- Data blending: Can it combine data from multiple tools into one view?
- Permissions and sharing: Can you control who sees what?
Key buying factors
For small businesses, software fit is often less about having the most features and more about having the right balance.
Budget
Some tools look inexpensive at first but add costs for more users, connectors, storage, or advanced features. Always check:
- Base subscription
- Per-user pricing
- Additional connector costs
- Viewer vs editor licensing
- Support or onboarding fees
Setup time
If your team needs dashboards live next week, prioritize tools with templates and simple integrations. If you can invest more time upfront, more flexible BI tools may pay off later.
Team size
A very small team may only need a handful of dashboards. A growing company often needs role-based reporting, permission control, and shared standards.
Technical skill level
Some tools are built for non-technical users. Others are more powerful but require stronger data modeling or setup knowledge. Be realistic about who will maintain the system after launch.
All-in-one platforms vs specialized reporting tools
This is one of the biggest trade-offs.
All-in-one BI platforms like FineBI, Power BI, and Zoho Analytics are better when you want:
- Broader data integration
- Deeper analysis
- More customization
- Better long-term scalability
Specialized dashboard tools like Databox and Geckoboard are better when you want:
- Faster setup
- Simpler KPI monitoring
- Easier client or team visibility
- Less technical administration
Red flags to watch for
Before committing to a subscription, watch for these issues:
- Limited connectors for your core systems
- Weak export and sharing options
- Dashboards that slow down with larger datasets
- Pricing that climbs sharply with user growth
- Heavy dependence on manual CSV uploads
- Poor permission controls
- Minimal support for custom metrics or calculations
If your business expects to grow beyond basic dashboarding, choosing a scalable platform early can prevent a painful migration later.
8 Small Business Dashboard Software Reviewed: Features, Pricing, Pros, Cons, and Best Fit
1. FineBI
One-sentence overview: FineBI is a self-service business intelligence platform that gives small businesses flexible dashboards, interactive analysis, and multi-source reporting without requiring an enterprise-scale setup.
 Key Features:
- Drag-and-drop dashboard creation
- Self-service analytics for business users
- Multi-source data integration
- Interactive drill-down and ad hoc analysis
- Role-based access and sharing
- Scalable architecture for growing teams
Pros & Cons:
- Pros:
- Strong balance between ease of use and analytical depth
- Supports more advanced reporting needs than many lightweight dashboard tools
- Good fit for businesses combining data from several systems
- Useful for teams that want both dashboards and deeper exploration
- Cons:
- More robust than very small teams may need at the beginning
- Pricing is not as simple or transparent as some self-serve SaaS tools
- May require a more structured setup than basic KPI platforms
Best For (Target user/scenario): Growing small businesses that need more than surface-level KPI tracking and want a dashboard platform that can scale with operations, sales, finance, and management reporting.
Standout features
FineBI stands out because it bridges the gap between basic dashboard tools and heavier BI platforms. For small businesses that are outgrowing spreadsheets, it offers a stronger foundation for connected reporting. It is especially useful if you need to bring together data from multiple business systems and allow different teams to explore it without depending entirely on IT.
Pricing
Pricing is typically customized based on deployment, users, and business requirements, so it is best suited to teams willing to evaluate value beyond entry-level self-serve pricing.
2. Looker Studio
One-sentence overview: Looker Studio is a free dashboard and reporting tool that works especially well for small businesses already using Google products and marketing data sources.
 Key Features:
- Free dashboard builder
- Native Google Analytics, Google Ads, and Sheets integration
- Shareable live reports
- Custom charts and community connectors
- Web-based collaboration
Pros & Cons:
- Pros:
- Very low barrier to entry
- Excellent for marketing and website reporting
- Easy to share with stakeholders
- Good option for startups on tight budgets
- Cons:
- Performance can vary with larger datasets
- Advanced modeling is limited compared with full BI tools
- Connector quality may depend on third parties
- Less suitable for complex operational reporting
Best For (Target user/scenario): Startups, freelancers, marketers, and small ecommerce businesses that need affordable reporting quickly.
Standout features
Looker Studio is best known for quick dashboard setup and easy sharing. If your business lives in Google Analytics, Google Ads, Search Console, and Sheets, it can cover a lot of reporting needs at no software cost.
Pricing
The core product is free, though some third-party connectors may carry separate fees.
3. Zoho Analytics
One-sentence overview: Zoho Analytics is an affordable BI and dashboard platform that gives small businesses a broad set of reporting features with relatively approachable setup.
 Key Features:
- Data imports and live connectors
- Prebuilt reports and dashboard templates
- AI-powered assistant
- Data blending across apps
- Sharing and collaboration
- Integration with the Zoho ecosystem
Pros & Cons:
- Pros:
- Competitive pricing for small teams
- Good range of connectors and business app integrations
- Easier entry point than some enterprise BI tools
- Helpful for businesses already using Zoho CRM or Zoho Books
- Cons:
- User interface may feel less polished than some competitors
- Advanced customization can take time
- Very complex reporting needs may stretch the platform
Best For (Target user/scenario): Small businesses seeking affordable BI with decent flexibility, especially those already invested in Zoho apps.
Standout features
Zoho Analytics offers a useful middle ground. It goes beyond lightweight dashboard tools but remains more accessible and budget-friendly than some premium analytics platforms.
Pricing
Zoho Analytics generally offers tiered monthly pricing based on users, rows, and features, making it one of the more budget-conscious options in this category.
4. Tableau
One-sentence overview: Tableau is a leading analytics platform known for advanced visual exploration and highly interactive dashboards.
 Key Features:
- Advanced data visualization
- Interactive dashboard filtering and drill-down
- Broad data connectivity
- Strong data storytelling
- Rich analytical capabilities
Pros & Cons:
- Pros:
- Excellent visualization quality
- Strong for exploratory analysis
- Flexible and powerful for complex data questions
- Widely used and well supported in the market
- Cons:
- Higher cost than many small businesses need
- Steeper learning curve
- Can be excessive for simple KPI reporting
Best For (Target user/scenario): Data-driven small businesses with more advanced analytical needs and the resources to support implementation.
Standout features
Tableau remains one of the strongest options for visual analytics. If your team values deep exploration and presentation-quality dashboards, it is a compelling choice. For many very small businesses, however, it may be more power than necessary.
Pricing
Tableau typically uses per-user subscription pricing at a higher tier than budget-oriented dashboard tools.
5. Microsoft Power BI
One-sentence overview: Power BI is a feature-rich dashboard and reporting platform that offers strong value for small businesses, especially those already using Microsoft products.
 Key Features:
- Integration with Excel, Teams, and Azure
- Data modeling and DAX calculations
- Custom dashboards and reports
- Wide connector library
- Scheduled refresh and sharing
Pros & Cons:
- Pros:
- Strong price-to-capability ratio
- Powerful data modeling
- Familiar environment for Microsoft users
- Good scalability as reporting needs grow
- Cons:
- Can be intimidating for non-technical users
- Setup can become complex
- Sharing and governance may require planning
Best For (Target user/scenario): Small businesses already operating in Microsoft 365 and those that need a scalable reporting environment at a reasonable price.
Standout features
Power BI is often the value leader for businesses that need more than simple dashboards. It is particularly effective when Excel is still central to your workflows and you want a path toward more disciplined reporting.
Pricing
Power BI usually starts with affordable per-user pricing, though enterprise-level sharing and capacity costs can increase as usage expands.
6. Databox
One-sentence overview: Databox is a KPI-focused dashboard platform built for fast setup, clear scorecards, and straightforward business performance tracking.
 Key Features:
- Prebuilt templates
- Mobile app and alerts
- Goal tracking
- Client-facing reporting
- Integrations with CRM, marketing, and sales platforms
Pros & Cons:
- Pros:
- Very easy to set up
- Strong for agency and client reporting
- Great mobile experience
- Useful for executive KPI visibility
- Cons:
- Less suitable for deep analysis
- Complex custom reporting can be limiting
- Some advanced use cases may require higher tiers
Best For (Target user/scenario): Agencies, consultants, and service businesses that need quick KPI dashboards and recurring client reporting.
Standout features
Databox is built for speed and simplicity. If your primary need is monitoring a handful of important metrics across sales, marketing, and revenue, it can deliver value quickly without a heavy implementation process.
Pricing
Databox offers a free plan and paid tiers, with pricing increasing based on users, dashboards, and data sources.
7. Klipfolio
One-sentence overview: Klipfolio is a customizable dashboard platform designed for teams that want highly tailored KPI tracking and live business metrics.
 Key Features:
- Real-time dashboards
- Custom formulas and metrics
- Many cloud app integrations
- TV and wallboard display options
- Flexible KPI visualization
Pros & Cons:
- Pros:
- Strong customization for metric tracking
- Useful for real-time operational visibility
- Good range of integrations
- Helpful for businesses with specific KPI definitions
- Cons:
- Setup can take time
- Interface is less beginner-friendly than simpler tools
- Not as strong for broad BI use cases as full analytics platforms
Best For (Target user/scenario): Small businesses that are highly KPI-driven and want custom dashboard logic rather than basic templates.
Standout features
Klipfolio is a solid choice when your business wants dashboards to reflect specific formulas, targets, and operational metrics. It fits organizations that care less about broad BI and more about precision KPI monitoring.
Pricing
Klipfolio generally uses subscription-based pricing that scales with users, data services, and platform needs.
8. Geckoboard
One-sentence overview: Geckoboard is a simple live dashboard tool that helps small teams display core metrics clearly with minimal setup.
Key Features:
- Real-time dashboards
- Goal and target tracking
- TV mode for office display
- Common business app integrations
- Simple chart and metric widgets
Pros & Cons:
- Pros:
- Very easy for non-technical teams
- Clean interface
- Effective for shared team visibility
- Good for straightforward scoreboards
- Cons:
- Limited analytical depth
- Not ideal for complex reporting
- Fewer advanced customization options
Best For (Target user/scenario): Very small teams, sales teams, and operations teams that want simple real-time dashboards without BI complexity.
Standout features
Geckoboard does one thing well: visible, live metrics. It is especially useful for teams that want a dashboard on a screen or a quick performance snapshot without needing full analytical workflows.
Pricing
Geckoboard typically uses tiered subscription pricing based on the number of dashboards, users, and integrations.
Which Dashboard Tool Fits Your Business Type?
The best small business dashboard software depends heavily on your business model, reporting habits, and internal resources.
Best choices for solo owners and very small teams
If you need fast visibility without much setup, prioritize ease of use and low cost.
Best options:
- Looker Studio for free reporting and simple marketing dashboards
- Geckoboard for live team metrics and simple scoreboards
- Databox for easy KPI tracking with mobile access
These tools work well when you need quick answers and do not have time for significant implementation.
Best options for sales-driven businesses and client reporting
Service businesses, agencies, and sales-led teams usually need recurring KPI reports, target tracking, and shareable views.
Best options:
- Databox for client dashboards and executive KPI reporting
- Klipfolio for tailored KPI logic and live metric tracking
- FineBI for broader cross-functional reporting across sales, finance, and operations
If your reporting includes multiple clients, targets, or service lines, a platform with stronger organization and customization becomes more valuable.
Best platforms for ecommerce and marketing performance tracking
Ecommerce brands often need to combine website, advertising, CRM, and sales data.
Best options:
- Looker Studio for Google-centric marketing reporting
- Zoho Analytics for budget-friendly blended reporting
- Power BI for businesses that want stronger modeling and multi-source analysis
These platforms are useful when you need to compare acquisition, conversion, revenue, and retention data together.
Best picks for businesses that need deeper customization or multi-source reporting
As reporting grows more complex, lightweight dashboard tools can start to feel restrictive.
Best options:
- FineBI for self-service analytics with stronger dashboard flexibility
- Power BI for scalable reporting and data modeling
- Tableau for advanced visual analysis
If your business needs dashboards across multiple departments or wants to reduce spreadsheet-driven reporting, these tools are usually better long-term choices.
Final Verdict and Shortlist Recommendations
If you are comparing the best small business dashboard software in 2026, the right choice comes down to how much reporting depth you need now and how much complexity you expect later.
Best overall choice for most small businesses
FineBI is the best overall choice for many growing small businesses because it offers a practical mix of dashboard usability, self-service analytics, and scalability. It is especially strong for teams that want more than basic KPI widgets and need to unify reporting across several systems.
Best budget-friendly option
Looker Studio is the best budget-friendly option thanks to its free entry point and strong fit for marketing, website, and simple business dashboards.
Best for ease of use
Databox and Geckoboard are the easiest tools to get running quickly. Databox is better for broader KPI and client reporting, while Geckoboard is ideal for simple live visibility.
Best for advanced reporting and scalability
Power BI is the strongest value option for advanced reporting, while FineBI is an excellent choice for businesses that want scalable self-service analytics with flexible dashboarding. Tableau remains a top option for visual depth, but it is often better suited to teams with more analytical maturity.
How to narrow your final decision
Use this simple shortlist logic:
- Choose Looker Studio if cost is your top concern
- Choose Databox if you want quick KPI dashboards with minimal setup
- Choose Geckoboard if simplicity matters more than analytical depth
- Choose Zoho Analytics if you want affordable BI with broad app integration
- Choose Power BI if you already use Microsoft heavily
- Choose Tableau if advanced visualization is your main priority
- Choose Klipfolio if custom KPI tracking is central to your workflow
- Choose FineBI if you need a scalable platform that supports both dashboarding and deeper business analysis
For most small businesses, the best software is not the one with the longest feature list. It is the one your team will actually use consistently, trust confidently, and grow with over time. If your business is moving beyond spreadsheets and basic reporting, FineBI is one of the most practical platforms to put on your shortlist.
FAQs
The best option depends on your budget, data complexity, and team skills. Looker Studio and Databox work well for simple KPI tracking, while FineBI, Power BI, and Zoho Analytics are better for deeper reporting and growth.
Start by checking integrations, ease of use, automation, customization, and total pricing. The right tool should match your current reporting needs while still supporting future growth.
Free tools can be enough if you need basic dashboards and simple reporting. As your business grows, paid platforms usually offer better data blending, permissions, automation, and scalability.
The most important features are data integrations, automated refreshes, customizable dashboards, role-based sharing, and mobile access. If you report across several systems, data blending and flexible calculations also matter.
A BI platform is designed for broader analysis, deeper customization, and more complex data modeling. A simple KPI dashboard tool focuses on quick setup and clear performance tracking for everyday visibility.


The Author
Lewis Chou
Senior Data Analyst at FanRuan
Related Articles

How to Build an Investment Portfolio Reporting Dashboard for Executives: KPIs, Benchmarks, and Drill-Down Views
Investment portfolio reporting for executives is not about showing every holding, transaction, and chart your investment team can produce. It is about giving CEOs, CFOs, CIOs, boards, and investment committees a fast, re
Yida YIn
Jun 25, 2026

12 KPI Reporting Examples for Executive Dashboards: What to Show in Weekly, Monthly, and Quarterly Reviews
Executive leaders do not need more data. They need decision ready $1 examples that match how often they review the business and what actions they are expected to take. A weekly $1 should surface fast moving risks and per
Yida YIn
Jun 25, 2026

How to Build a Digital Marketing Reports Dashboard: Executive Examples, KPIs, and Templates
A $1 is the control layer that helps executives and marketing leaders turn scattered channel data into fast, confident decisions. If you are a CEO, CMO, operations director, or marketing analytics lead, the real problem
Yida Yin
May 07, 2026