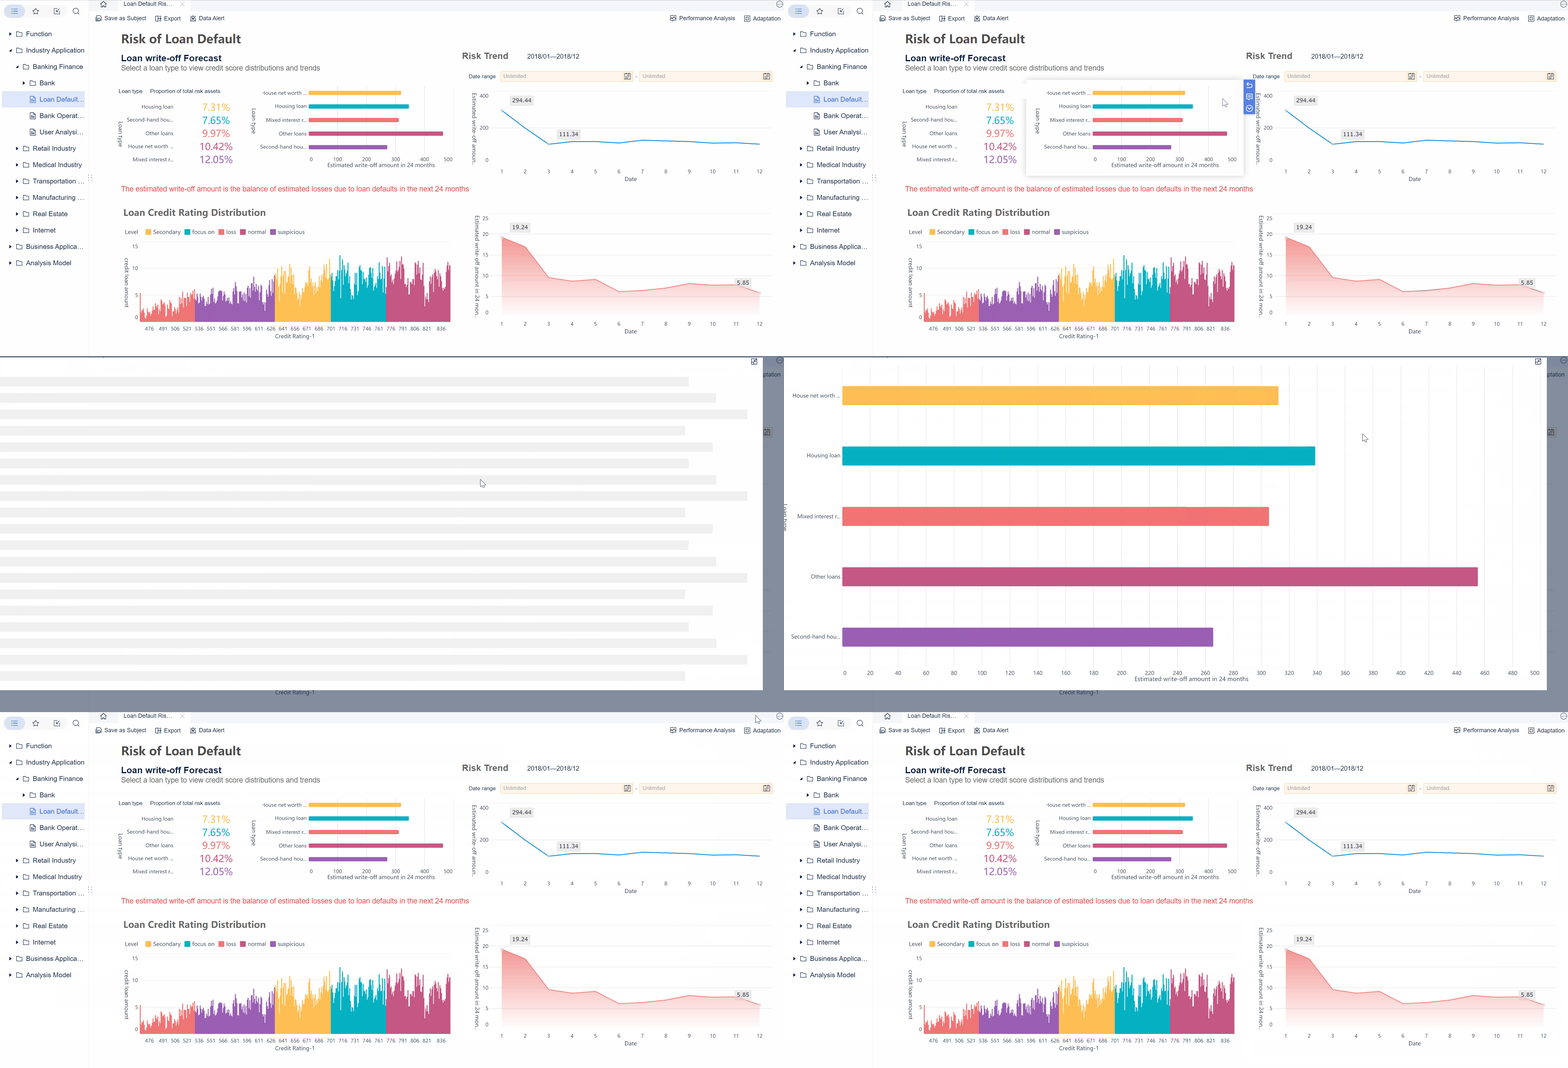
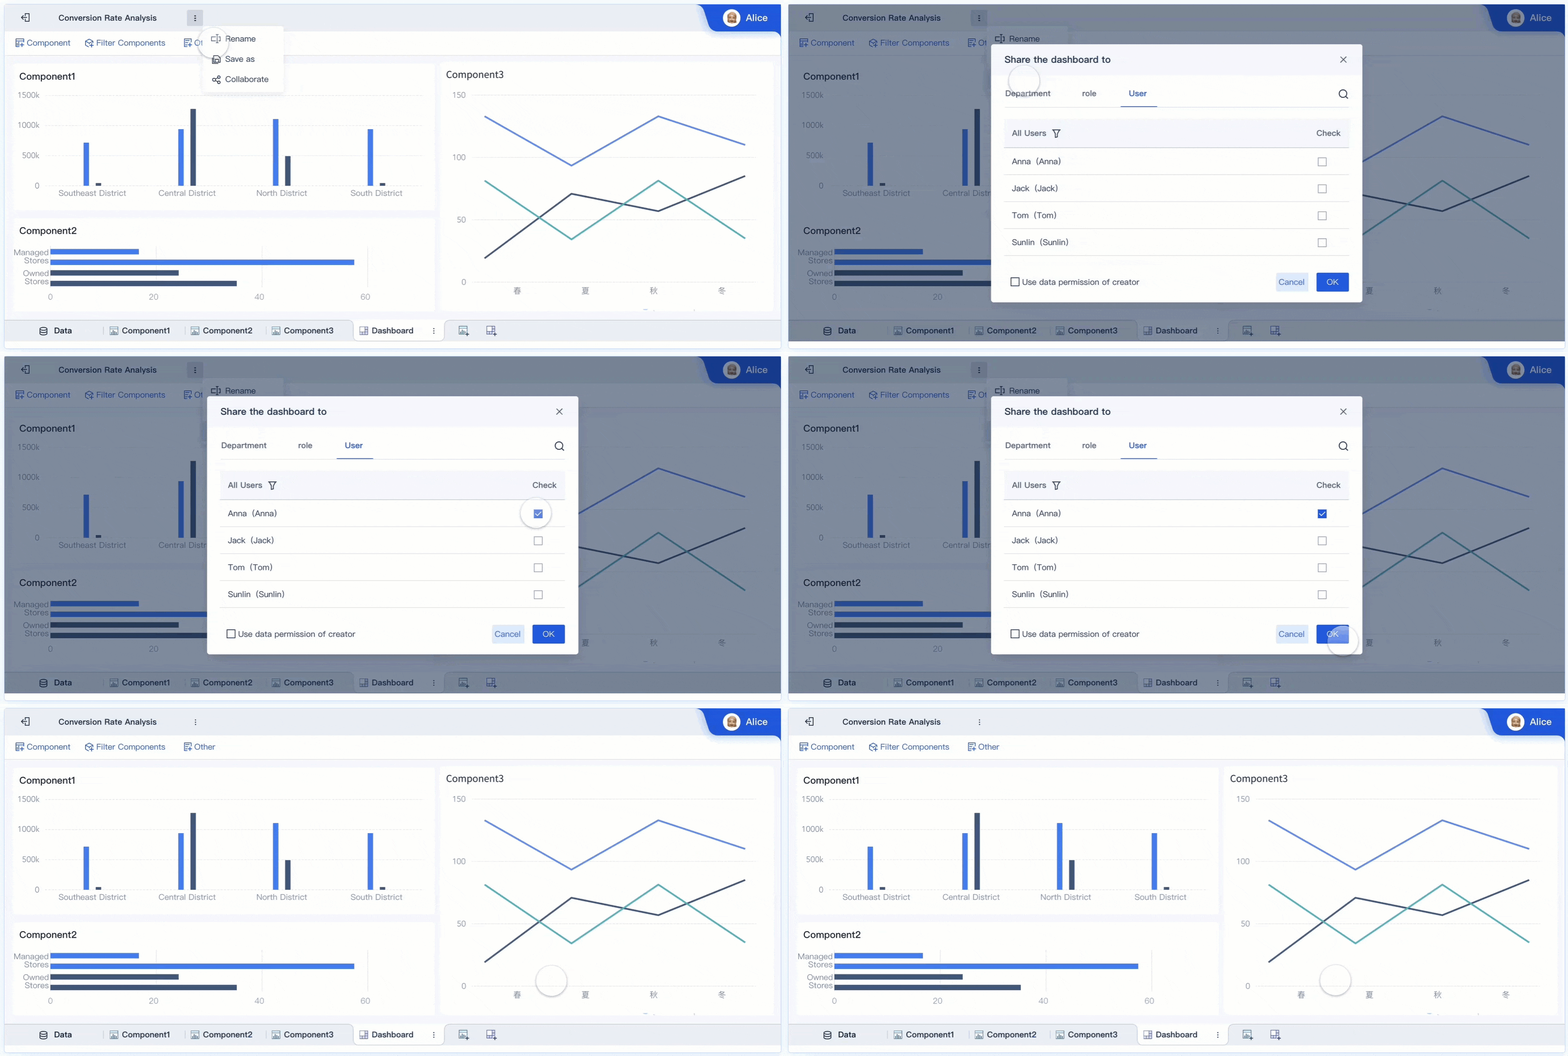
Finance leaders do not need more disconnected spend reports. They need a practical way to see where money is going, where controls are weakening, and what requires action before month-end turns into cleanup. A brex spend management intelligence dashboard should give finance teams a centralized view of spend patterns, budget performance, policy compliance, and payment timing so they can manage risk and make faster decisions.
With FineBI + Dora, business users can ask for analysis in chat, generate chart-based answers or dashboard-style views from trusted BI assets, and receive scheduled summaries before the next meeting. That matters for finance teams managing card spend, reimbursements, approvals, vendor concentration, and budget variance across multiple departments.
Click To Try The Dashboard
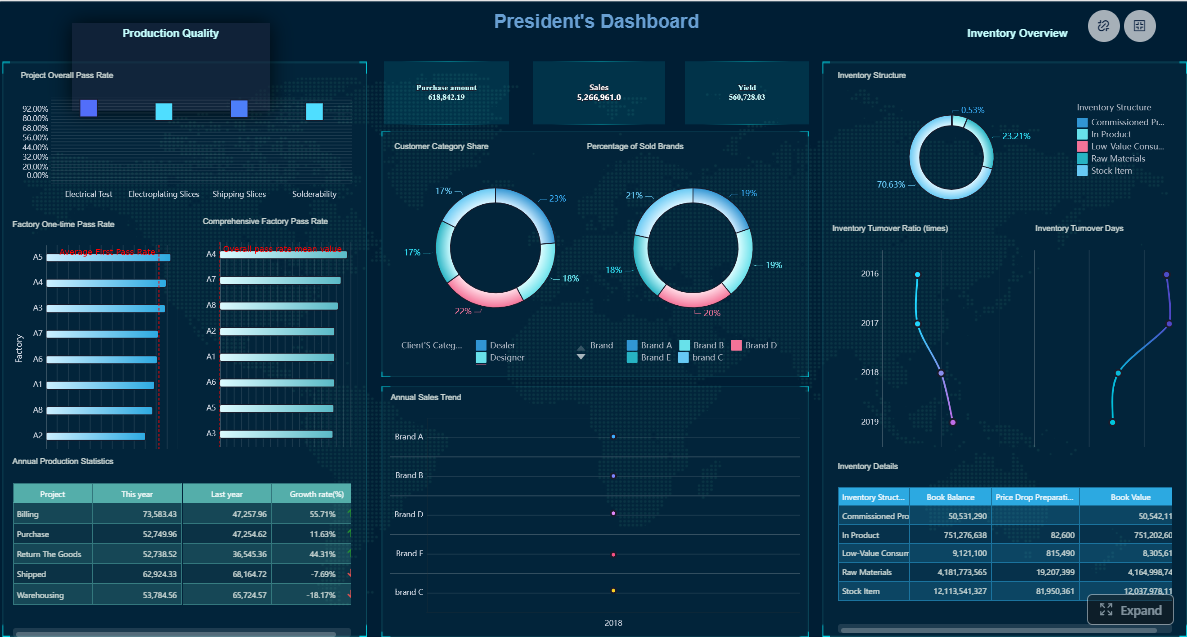
All dashboards in this article are built with FineBI
What the Brex Spend Management Intelligence Dashboard Is and Why It Matters
A brex spend management intelligence dashboard is a finance control and decision-support layer that consolidates spend data into usable management views. In practical terms, it helps finance leaders monitor company spending by category, department, employee, merchant, and policy status without jumping between exports, approval tools, and accounting reconciliations.
For finance leaders, the dashboard should answer a few immediate questions:
Where is spend increasing faster than expected?
Which teams are overshooting budgets?
Which vendors represent rising exposure or duplication?
How much spend is out of policy or pending approval?
What upcoming payment activity may affect liquidity?
A centralized dashboard reduces blind spots because it turns scattered transactional activity into a structured management picture. Instead of waiting until month-end to detect problems, finance can review trends in a timely manner and intervene before overspend, weak compliance, or vendor leakage becomes systemic.
This is why dashboard intelligence matters beyond bookkeeping. Bookkeeping records what happened. Spend intelligence helps finance leaders guide what should happen next. It supports:
Policy enforcement: identifying exceptions, approval gaps, and recurring violations
Strategic planning: understanding spend drivers and cost concentration
Working capital visibility: seeing payment timing and reimbursement patterns
Operational alignment: helping department leaders spend responsibly without slowing execution
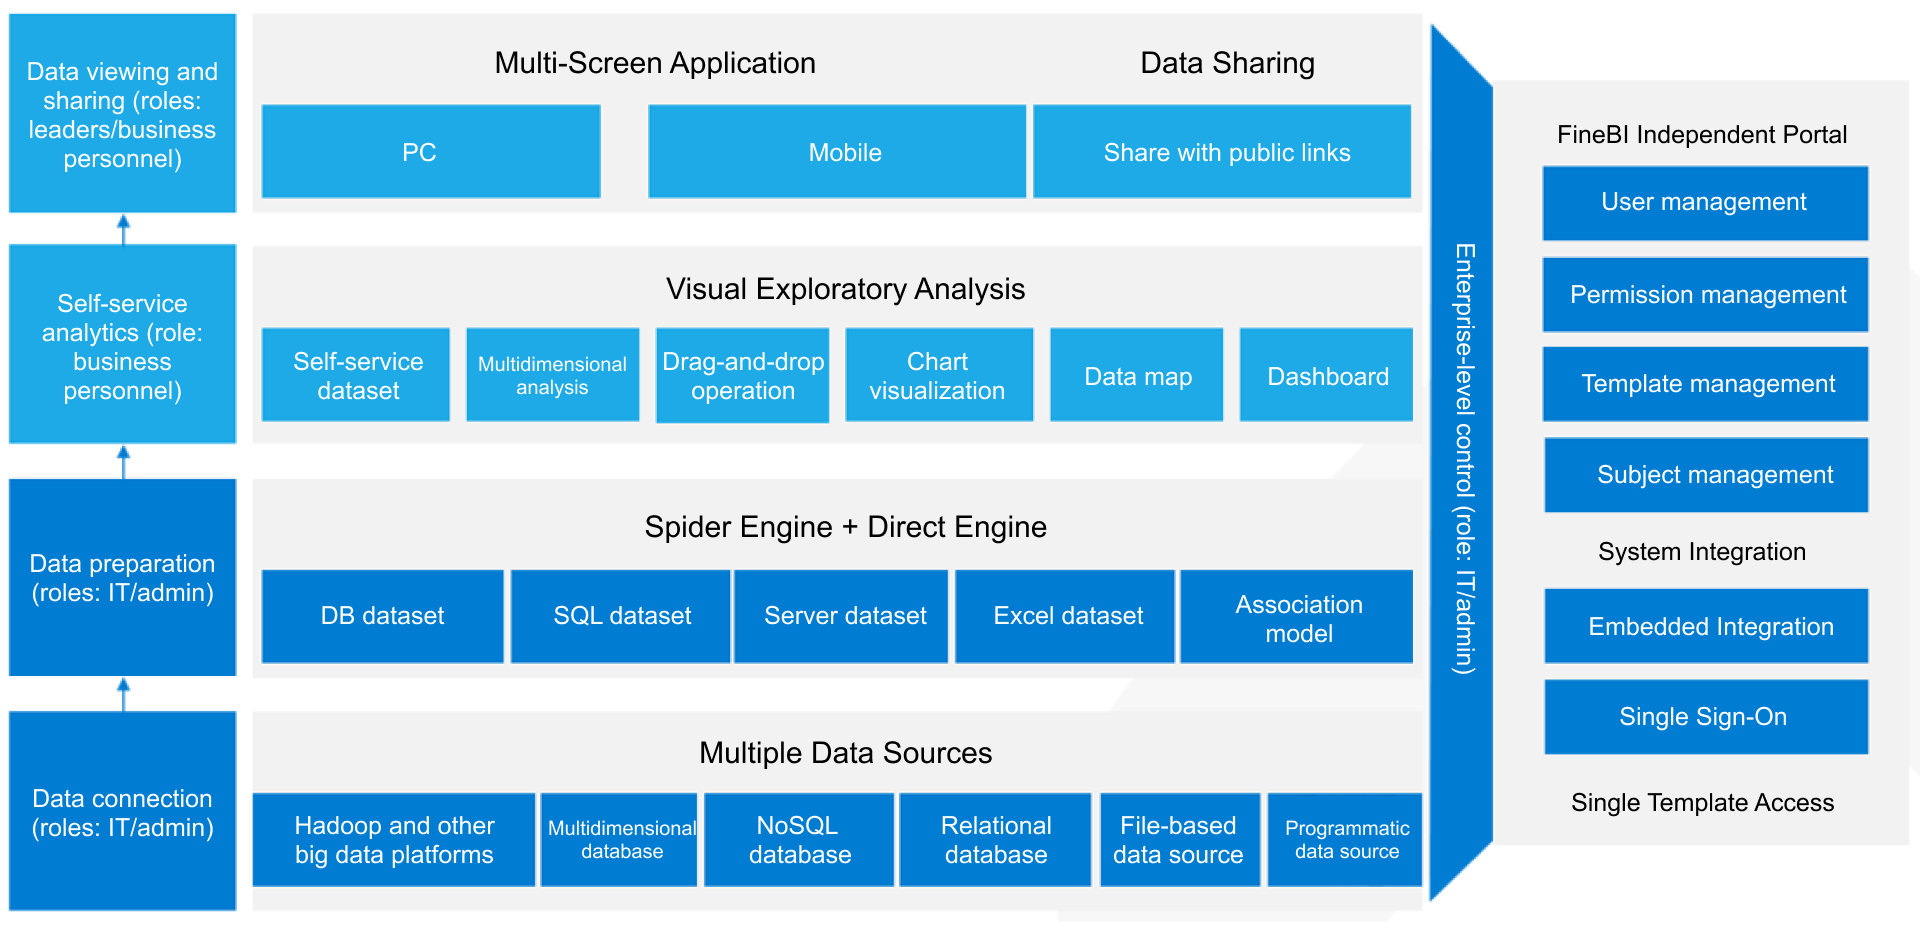
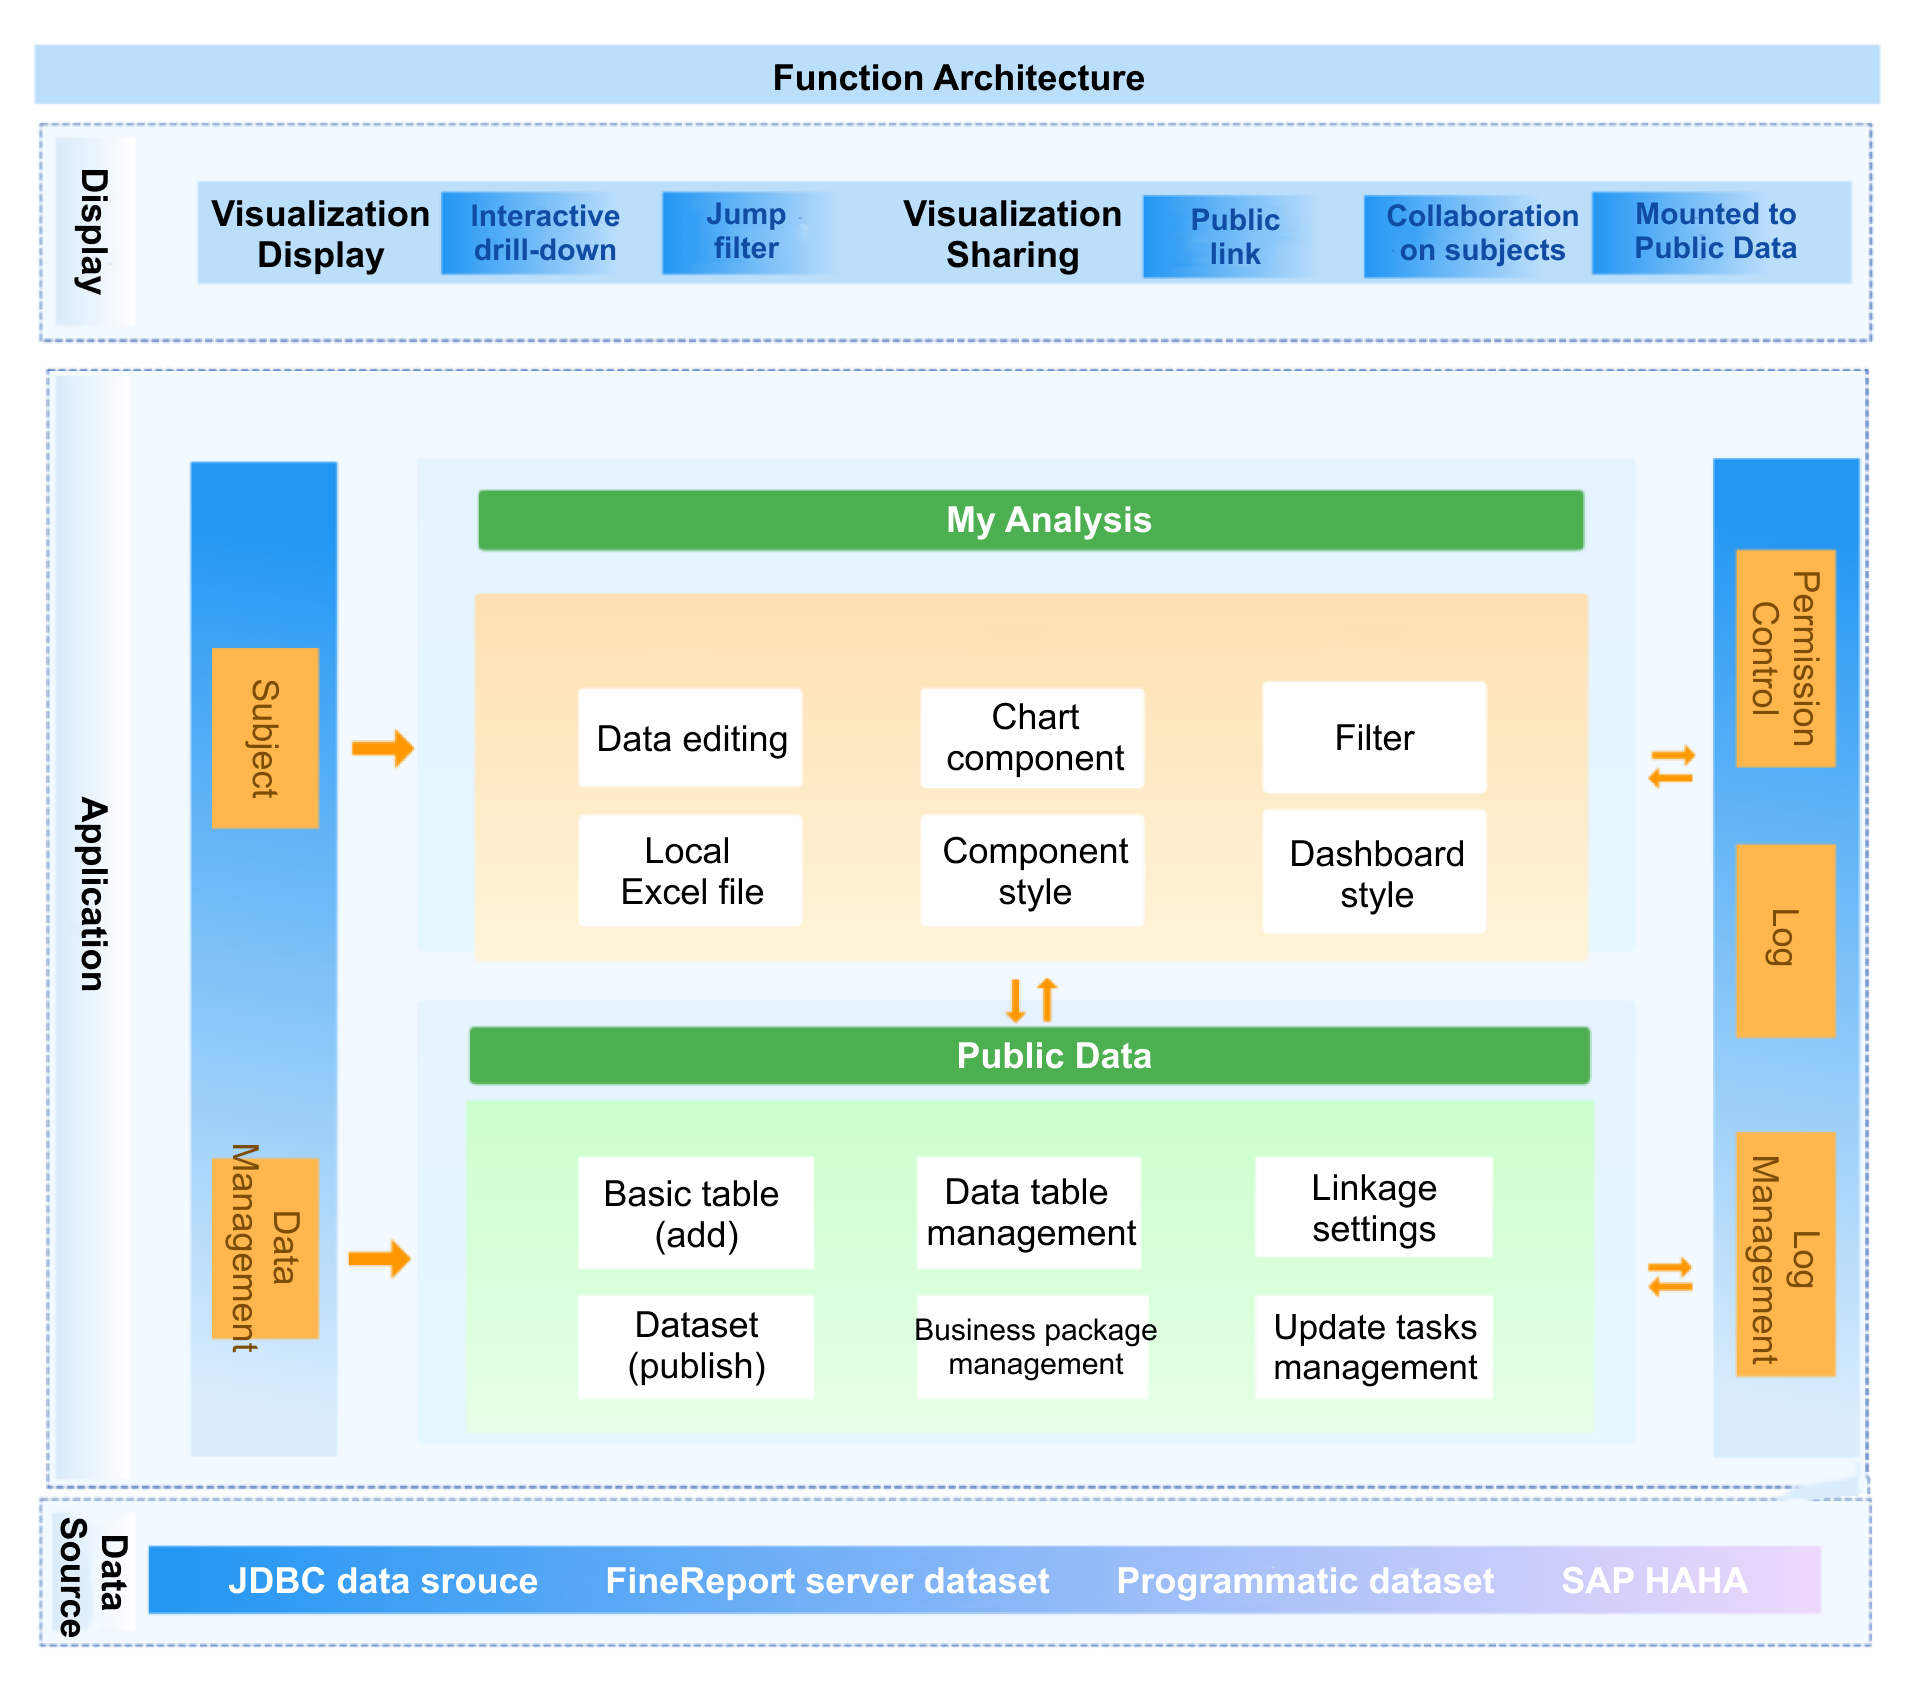
The BI foundation is critical here. FineBI helps finance teams build trusted dashboards, governed metric definitions, and semantic rules so the organization is working from one version of spend truth. Dora then adds the AI assistant layer, making those spend insights easier to access, summarize, monitor, and follow up on through chat and governed AI workflows.
The Core Metrics Finance Leaders Should Track First
A useful dashboard starts with a small set of high-value KPIs that support cost control, compliance, and planning. Below are the first metrics finance leaders should prioritize.
Spend by category, team, and vendor
This is the first lens for understanding where money is going and whether spend concentration is healthy.
Spend by category: Definition of total spending grouped by expense types such as travel, software, marketing, professional services, office operations, and employee reimbursement. Business value: Shows which expense classes are growing, which categories require tighter controls, and where cost optimization should start. AI use:Dora can retrieve category-level spend through chat, compare period-over-period changes, and summarize which categories are driving variance.
Spend by team: Definition of spend grouped by department, cost center, business unit, or manager. Business value: Reveals which functions are consuming budget fastest and where accountability should sit. Helps finance partner with department leaders more effectively. AI use:Dora can generate a chart-based answer for team-level spend, flag unusual spikes, and push periodic summaries to team owners.
Spend by vendor: Definition of total spend grouped by supplier or merchant. Business value: Identifies concentration risk, fragmented buying, and opportunities for vendor consolidation or contract negotiation. AI use:Dora can surface top vendors, compare supplier trends, and detect overlap across departments that may indicate redundant purchasing.
When finance can view spend across these three dimensions together, it becomes easier to distinguish normal operating growth from inefficient or risky spend patterns.
Budget versus actual performance
Budget variance is one of the most important finance management signals because it turns raw spend into performance context.
Budget vs actual: Definition of planned spend compared with actual incurred or committed spend by period, team, or category. Business value: Helps finance detect overruns early, improve forecast discipline, and support corrective action before the close. AI use:Dora can retrieve approved budget and actual spend metrics from FineBI assets, explain key variance drivers, and produce scheduled variance briefings for finance review.
Forecast gap: Definition of the difference between current spend trajectory and expected future spend versus budget targets. Business value: Supports better reallocation decisions and reduces surprise shortfalls later in the quarter. AI use:Dora can summarize whether current patterns suggest likely overspend and notify owners when thresholds are breached.
This metric is especially valuable when finance leaders want to move from retrospective reporting to proactive cost management.
Policy compliance and exception trends
Spend visibility is incomplete without control visibility. A dashboard should show not only what was spent, but whether it was spent according to policy.
Out-of-policy transaction rate: Definition of the percentage or count of transactions that violate spend rules or policy thresholds. Business value: Highlights control weaknesses and areas where policy design, employee training, or approval workflows need attention. AI use:Dora can retrieve compliance metrics, explain recurring violation patterns, and trigger alerts when exceptions rise beyond defined thresholds.
Approval gap rate: Definition of transactions missing required approvals or completed outside standard workflow. Business value: Indicates breakdowns in spend governance that may expose finance to audit, compliance, or fraud risks. AI use:Dora can identify pending or bypassed approvals and push exception summaries to finance controllers or budget owners.
Recurring exception trend: Definition of repeated violations by team, category, employee group, or vendor. Business value: Helps leaders distinguish one-time mistakes from structural issues. AI use:Dora can monitor repeat patterns over time and support follow-up workflows with responsible owners.
Cash flow timing and payment visibility
Spending is not only about total cost. Timing matters for liquidity, reimbursement experience, and working capital control.
Upcoming payment obligations: Definition of scheduled or expected outgoing payments over upcoming periods. Business value: Helps finance plan cash needs and avoid surprises from concentrated payment windows. AI use:Dora can prepare weekly payment visibility summaries and answer ad hoc questions on upcoming obligations.
Reimbursement cycle timing: Definition of the time between employee submission, approval, and reimbursement payment. Business value: Supports employee experience while also revealing workflow delays and control friction. AI use:Dora can flag delayed reimbursement cases and summarize bottlenecks by approver or team.
Card spend timing pattern: Definition of spend distribution over time by card activity, merchant type, or department. Business value: Improves liquidity planning and helps finance identify unusual bursts of discretionary spending. AI use:Dora can compare current card activity with historical norms and issue alerts on unusual trends.
How Dashboard Insights Improve Financial Decision-Making
The best finance dashboards do not stop at reporting. They improve how decisions are made across the operating cycle.
Faster month-end reviews and cleaner reporting
When spend data is centralized and consistently modeled, finance teams spend less time stitching together exports and checking whether different reports define the same metric differently. That reduces manual reconciliation and improves confidence in month-end review discussions.
With FineBI as the BI foundation, finance can create governed metrics for spend, budget variance, policy exceptions, and payment status. Instead of rebuilding analysis every period, teams can work from the same trusted dashboard structure each close cycle.
Dora adds another layer of efficiency. Finance managers can ask for a summary of month-to-date spend changes, exception rates, or vendor outliers in natural language and get a chart-based answer or dashboard-style analysis view sourced from trusted BI assets. That shortens the path from question to action.
Better cost control without slowing teams down
Finance needs a balance: employees should be able to spend for business needs, but not in ways that create leakage, weak governance, or unexpected overruns. Dashboard insight supports that balance by showing where autonomy is working and where guardrails are weak.
For example, if one business unit consistently exceeds travel budgets while another shows a rising pattern of unapproved software purchases, finance can target intervention more precisely. The point is not to add friction everywhere. It is to apply better controls where the data shows the highest risk.
This is also where Agentic BI becomes practical. FineBI provides the governed dashboard and semantic foundation. Dora can act as a Risk Alert Officer or Daily Briefing Secretary, pushing scheduled summaries and anomaly alerts to the right owners so finance does not have to manually monitor every metric every day.
More accurate forecasting and scenario planning
Historical and current spend signals become more useful when finance can quickly identify which changes are structural and which are temporary. A dashboard that tracks category-level growth, team-level variances, and vendor concentration supports more realistic forecasting.
Finance leaders can use these signals to answer questions like:
Is software spend rising because of deliberate scaling or duplicate subscriptions?
Is travel spend seasonal or policy drift?
Are current trends likely to create budget pressure next quarter?
Which business units need revised assumptions?
With Dora, these scenario discussions become easier to prepare for. Instead of manually assembling charts before every review, finance can ask Dora for a spend variance summary, a vendor overlap analysis, or a quarterly briefing pack based on trusted FineBI assets.
Warning Signs and Patterns Leaders Should Not Ignore
Even a strong dashboard loses value if leaders do not know what to watch for. The following warning signals deserve close review.
Sudden spikes in discretionary spending
Large increases in travel, entertainment, software, marketing, or department-level purchases may indicate urgent business needs, but they may also signal weak controls, budget drift, or fragmented buying. The dashboard should make those spikes visible early, ideally with trend comparisons and drill-down paths.
Finance leaders should ask:
Which category changed?
Which team or manager is driving it?
Is the spend planned, seasonal, or unexpected?
Is there a corresponding budget adjustment?
Dora can help here by monitoring threshold changes and surfacing preliminary attribution through a governed AI workflow rather than requiring analysts to investigate every fluctuation manually.
Repeated policy exceptions or approval bottlenecks
A single policy exception may be a user mistake. A repeated pattern usually points to a process issue. If the same teams, merchants, or spend types regularly appear in exception reporting, finance should investigate whether the rules are unclear, enforcement is weak, or approvals are too slow to fit business reality.
Likewise, if approval cycle times are lengthening, finance may be introducing friction that delays reimbursement, hurts employee experience, or encourages off-process behavior.
A useful dashboard should not only count exceptions. It should also show:
recurring violators
exception type
approval lag
approver bottlenecks
unresolved cases over time
Vendor overlap and underused subscriptions
Redundant software and fragmented vendor relationships are common sources of spend leakage. Separate departments may buy similar tools without visibility across the organization, or finance may continue paying for subscriptions with low business usage.
A dashboard should help identify:
multiple vendors serving the same need
duplicate software categories across teams
small recurring payments that accumulate over time
vendors with rising spend but unclear ownership
This matters not just for cost savings, but for procurement leverage and cleaner vendor governance.
For this finance scenario, the most relevant Dora digital employees are the Data Analystdigital employee, Daily Briefing Secretary, and Risk Alert Officer. Together, they help finance leaders move from passive dashboard review to active, governed follow-up.
A finance leader does not always have time to open multiple dashboards, drill into category detail, compare budget variance, and investigate exceptions manually. Dora helps reduce that operating friction by working on top of trusted FineBI dashboards, semantic models, and permissions.
A concrete chat example might look like this:
“Show me this month’s spend by category and department, compare budget versus actual, highlight out-of-policy transactions, and identify the top vendors with unusual growth.”
Here is how the AI workflow works in a practical enterprise setup:
Retrieve trusted FineBI dashboard or analysis-subject data. Dora connects to the governed spend dashboard, budget models, and compliance views already defined in FineBI.
Understand KPI definitions, filters, business terms, and semantic rules. Dora uses the trusted semantic layer so “department spend,” “policy exception,” “budget variance,” and “upcoming payment obligations” map to approved business definitions.
Generate chart-based answers and dashboard-style analysis views through chat.
Instead of returning a generic text response, Dora can provide finance-friendly views such as category trend charts, vendor rankings, budget variance tables, or exception summaries.
Detect abnormal changes or threshold breaches. Dora can act as a Risk Alert Officer, watching for sudden spend spikes, repeated policy violations, delayed approvals, or unusual vendor growth based on configured thresholds and rules.
Push insights, alerts, or suggested actions to responsible users.
Finance controllers, budget owners, or department managers can receive scheduled summaries, weekly briefings, or exception notifications without searching through multiple dashboards.
Produce follow-up summaries for meetings or management review. Dora can act as a Daily Briefing Secretary or Report Researcher, preparing a concise management view before forecast reviews, month-end discussions, or budget meetings.
This is where FineBI + Dora stands out as a practical enterprise approach. FineBI provides the trusted BI and semantic foundation: dashboards, governed metrics, permissions, and reusable analysis assets. Dora builds on top of that foundation with natural-language data query, skills-based execution, summaries, alerts, and follow-up workflows.
That matters because finance use cases require control. Leaders need AI outputs that respect permissions, KPI definitions, business rules, and data quality constraints. Dora is designed as an enterprise Data Agent, not a generic chatbot. It fits finance operations better through governed AI workflows, reusable Skills, and more controllable execution paths. It also offers stronger landing capability than feature-only agent comparisons because it is anchored to real BI assets and repeatable operating scenarios.
For finance teams, this means:
less dependency on manual report assembly
faster access to trusted spend answers
scheduled KPI briefings before meetings
timely anomaly alerts for overspend or compliance risk
Ownership should be explicit. Finance, procurement, department heads, and approvers should each know which metrics they are expected to review and act on.
Build thresholds, alerts, and escalation rules
Thresholds turn dashboards into operating tools. Without them, teams may see issues but fail to act consistently.
Useful trigger examples include:
category spend rising above expected threshold
department budget variance exceeding tolerance
repeated out-of-policy transactions from the same owner or team
delayed approvals beyond standard SLA
unusual vendor growth over a defined period
This is one of the strongest AI/Data Agent scenarios. Dora can monitor these conditions, trigger alerts, summarize what changed, and route follow-up to the right stakeholders through governed workflows.
Connect dashboard findings to broader finance strategy
Spend intelligence should not remain isolated inside an expense review meeting. It should feed broader finance priorities such as:
annual and quarterly budgeting
procurement consolidation
working capital planning
policy optimization
executive reporting
cost discipline initiatives
When dashboard findings are tied to these larger decisions, finance moves from reactive control to strategic influence.
Standardize KPI definitions, synonyms, filters, and metric ownership
This is a foundational best practice and especially important for AI readiness. If “department spend” is defined differently across reports, neither dashboards nor AI summaries will be trusted.
FineBI helps teams build this semantic consistency into the BI workflow. Dora then uses those same definitions to answer questions in a governed way. This reduces confusion and improves adoption.
Use human review for AI-generated summaries and expand gradually
Finance is a high-accountability function. AI-generated summaries, alerts, and report drafts should be reviewed by finance owners, especially in early rollout stages. Start with recurring workflows such as weekly spend briefings, variance summaries, or exception alerts. Then expand to more advanced Skills once data quality, KPI governance, and ownership are mature.
What an Effective Dashboard Review Process Looks Like
An effective review process starts with the highest-risk metrics, not with a broad scan of every available chart. Finance leaders should focus first on the items most likely to require action: budget overruns, policy breaches, unusual spend spikes, approval failures, and vendor concentration shifts.
Consistency also matters. Leaders need stable definitions and benchmarks so they can compare results over time without debating what each number means. That means documented KPI logic, agreed filter rules, and a clear owner for each metric.
A good review process typically follows this pattern:
Review the top exception and variance metrics first.
Drill into the categories, teams, or vendors driving the change.
Decide whether the issue is temporary, structural, or policy-related.
Assign owners and follow-up actions.
Document decisions for the next review cycle.
Track whether corrective actions improved the metric.
This is another area where Dora adds practical value. It can support recurring review preparation by generating scheduled summaries, highlighting unusual changes, and packaging meeting-ready insights from FineBI dashboards. Instead of starting each meeting with data gathering, teams can start with decisions.
FineBI + Dora Solution Pitch
Building this manually is complex. FineBI helps teams build trusted dashboards, metrics, and semantic assets. Dora turns those assets into an AI assistant that can answer questions in chat, generate dashboard-style analysis views, push scheduled summaries, monitor anomalies, and follow up with responsible owners.
For a brex spend management intelligence dashboard, this combination is especially useful because finance teams need both control and usability. They need governed KPIs, permission-aware analysis, and consistent definitions. They also need faster access to answers, lower reporting friction, and a practical way to scale routine data work.
FineBI + Dora is not only a BI upgrade; it is a practical fourth-generation Agentic BI path. FineBI provides governed metrics and visual analysis. Dora provides the AI assistant layer for scenario execution, with more controlled Skills, lower token waste, faster execution paths, and more stable workflows than prompt-only agents.
That means finance leaders can build a more mature operating model around spend intelligence:
natural-language access to those assets through Dora
chart-based answers and dashboard-style analysis views
scheduled weekly or monthly finance briefings
anomaly alerts for overspend, compliance risk, or vendor change
follow-up routing to owners for action and review
Get Ready-to-Use Dashboard Templates in Fine Gallery
The strongest Dora pitch is scenario + product + service: FineBI provides the trusted BI foundation, Dora provides the AI digital employee, and implementation service connects data, governance, semantic setup, Skills, and rollout.
If your finance team wants better spend visibility, stronger policy control, and a more scalable way to turn dashboard data into action, FineBI + Dora offers an enterprise-ready path forward.
Start with the highest-impact finance views: total spend, budget versus actual, spend by category, team and vendor, policy exceptions, approval status, and upcoming payment activity. These metrics give leaders a fast view of cost control, compliance, and liquidity risk.
Basic reporting shows what already happened, while spend intelligence helps finance spot variance, policy issues, and vendor exposure early enough to act. That makes it more useful for decision-making, not just month-end review.
They can track budget variance, monitor unusually fast growth in categories or departments, and review vendor concentration before issues become larger. This helps teams intervene during the period instead of cleaning up after close.
FineBI provides governed dashboards and trusted metric definitions, while Dora lets users ask questions in chat and receive chart-based answers or scheduled summaries. Together they make spend insights easier to access and act on.
It can highlight out-of-policy spend, missing approvals, duplicate or concentrated vendors, budget overruns, and payment timing that may affect cash flow. These signals help finance reduce blind spots and respond faster.
Product Trial
FineReport
Pixel-perfect reports · Interactive dashboards · Easy data entry · Digital twins