You make a good revenue cycle KPI dashboard by picking important metrics. You use trusted data and strong tools like FineBI for quick insights. Metrics like clean claim rate, denial rate, and days in accounts receivable help you watch how things are going. They help you find problems early. When you match KPIs with your goals, you help everyone work together. This leads to better choices and shared success. FanRuan’s solutions help you break down data silos and automate reports. This makes your revenue cycle KPI dashboard help your business get better.
Revenue Cycle KPI Dashboard: Challenges in Revenue Cycle Management
Data Fragmentation and Manual Processes
Managing the healthcare revenue cycle is hard. One big problem is data fragmentation. Your group may use many systems that do not connect. This causes data silos. When systems cannot share information, you cannot see everything at once. Old technology and interoperability issues make things worse. Claims can get stuck because you cannot view all data together. Accounts receivable may be late, and unbilled claims can be missed.
Manual processes make things harder. Many teams still use spreadsheets or paper. Staff spend lots of time doing the same tasks again and again. Billing and coding mistakes happen more when you type data by hand. These errors cause claim denials and lost money. Teams with fewer people feel more stress. They must deal with old ways that slow them down.
FanRuan and FineBI help fix these problems. FineBI connects to many data sources and puts your information together. You can automate collecting and reporting data. This cuts down mistakes and saves time. With a revenue cycle dashboard in FineBI, you see all your key metrics in one spot. You do not need to switch systems or update things by hand.
Impact on Financial Performance
Using manual processes and having fragmented data hurts your finances. The cost to collect payments goes up. High costs mean your revenue cycle is not efficient. Most groups should keep collection costs between 2.5% and 3.5%. If your costs are higher, you lose money that could help patients or grow your business.
Data silos also make reporting harder. You may miss things and have more claim denials. Late payments cause lost revenue and more compliance risks. Fragmented systems lead to incomplete or mixed-up data. This makes your reports less correct. Without real-time tracking, you miss important updates. Entering data by hand raises the chance of mistakes and claim rejections.
A strong kpi dashboard helps you watch these problems. With FineBI, you get real-time insights and alerts. You can find issues early and fix them. FanRuan’s solutions let you work on improving your revenue cycle management, not just fixing errors. Your dashboard becomes a tool for better choices and stronger finances.
Revenue Cycle KPI Dashboard: Build with FineBI
When you use FineBI to make a revenue cycle dashboard, you can see your healthcare revenue cycle clearly. You can watch important metrics, find problems early, and make better choices. Follow these steps to build a strong revenue cycle KPI dashboard for your group.
Select and Prioritize KPIs
You must pick the best KPIs for your dashboard. First, look at the main problems in revenue cycle management. Think about where your group loses money or has slowdowns. Use this list to help you choose:
Find the biggest problems in your revenue cycle, like claim denials or slow payments.
Watch KPIs such as clean claim rate, denial rate, days in accounts receivable, and percent of missed appointments.
Use automation and AI tools in FineBI to help manage claims and lower mistakes.
Make sure you talk clearly with patients about what they need to pay.
Use revenue cycle analytics tools to see your KPIs in real time.
Integrate Data Sources Using FineBI
FineBI lets you connect to many data sources. You can bring together data from billing systems, EHRs, and spreadsheets. This helps you make a full medical billing kpi dashboard.
Use FineBI’s connectors to link databases, files, and APIs.
Combine data from different teams for one big view.
Clean and fix your data with FineBI’s ETL tools.
Set up automatic updates to keep your dashboard fresh.
You do not have to switch between systems. FineBI puts all your data in one spot, so your dashboard is more trustworthy.
Design for Clarity and Usability
A good dashboard is easy to read and use. You want people to find key metrics fast and look deeper if needed.
Use visual order to show important KPIs first.
Add white space so the dashboard is not crowded.
Include filters and drill-downs so users can see more details.
Keep the layout simple and neat.
Make sure your dashboard works on phones and tablets.
Real-Time Tracking and Analytics
FineBI gives you real-time tracking for your dashboard. You can see changes as soon as the data updates. This helps you fix problems faster.
Set up alerts for important metrics like denial rate or days in accounts receivable.
Watch inventory levels to stop shortages.
Move from just reacting to being proactive. Fix problems before they get worse.
Managers can act fast. Real-time analytics turn your dashboard into a tool for better decisions and stronger finances.
Continuous Improvement and Review
Your revenue cycle kpi dashboard needs to be updated often. You should check workflows and change things when payer rules or technology change.
Check your processes often to find new slow spots.
Update your dashboard when rules change.
Ask staff who use the dashboard for feedback.
Plan reviews to talk about trends and results.
When you build a revenue cycle dashboard with FanRuan and FineBI, you get a strong tool. You can track KPIs, connect data, design for clarity, watch in real time, and keep getting better. This helps you manage your healthcare revenue cycle and make smart choices.
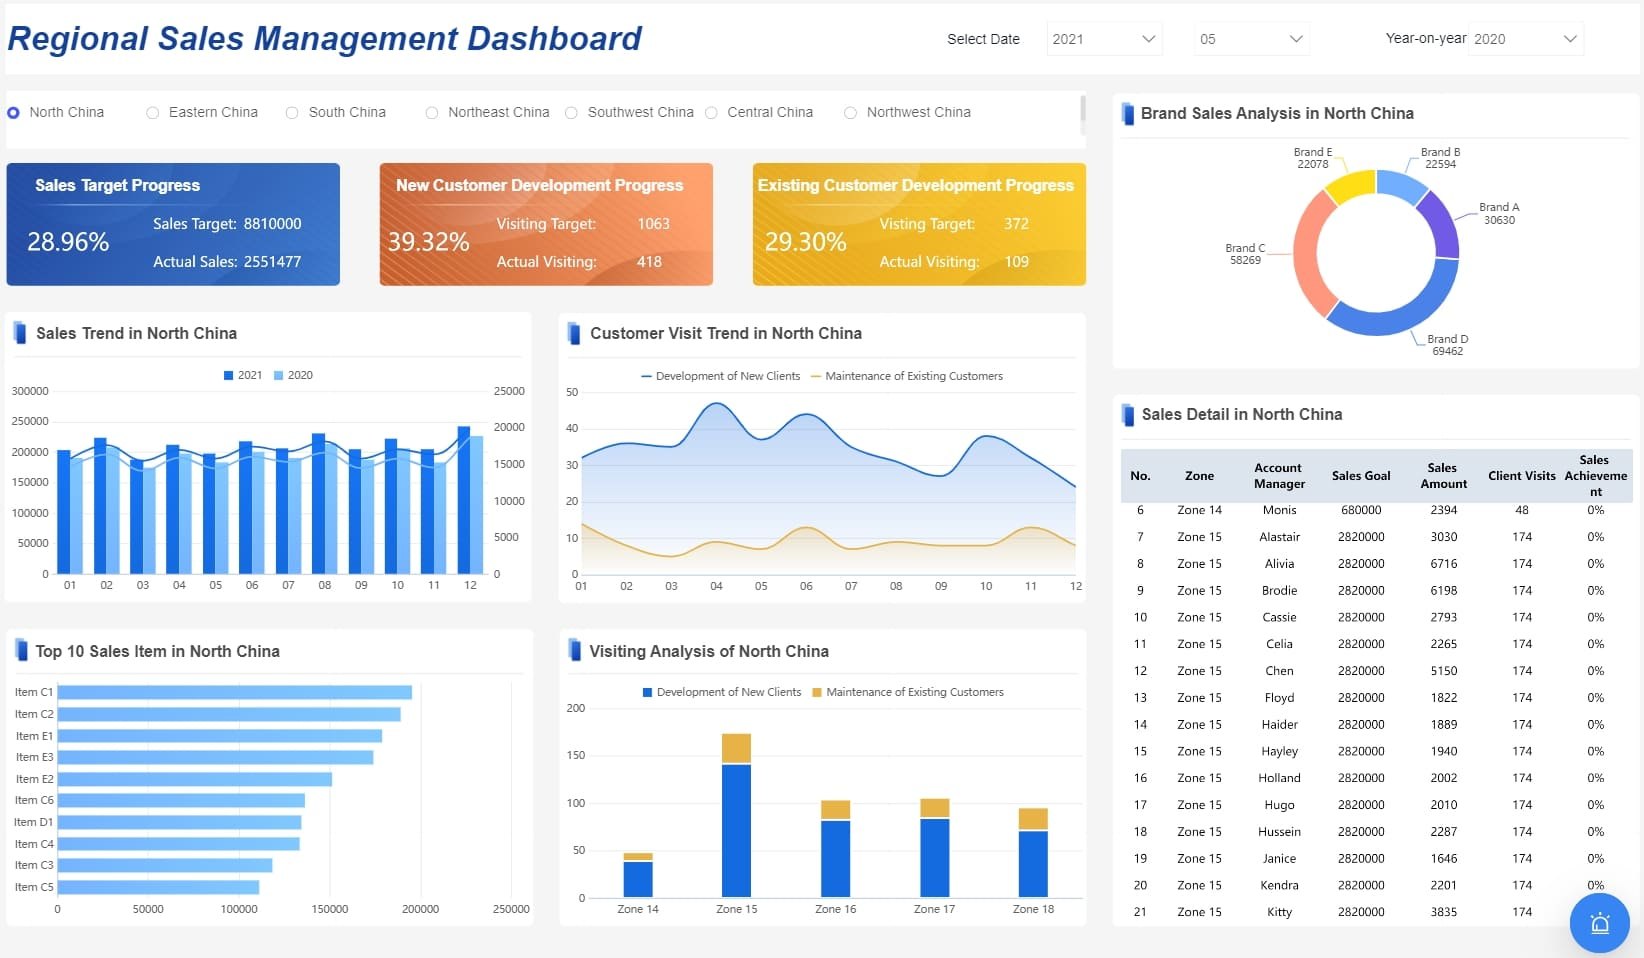
regional sales management dashboard - click to engage
Revenue Cycle KPI Dashboard: Align KPIs and Engage Stakeholders
Link Metrics to Organizational Goals
Your revenue cycle kpi dashboard should match your group’s main goals. When you connect KPIs to what your group wants, everyone knows why each number matters. For example, if you want more profit, you can track gross profit margin. If you want to work faster, you can watch return on investment. If you want to spend less, you can measure cost of goods sold. The table below shows how KPIs link to goals and help people stay involved:
Key Performance Indicators (KPIs)
Organizational Goals
Impact on Stakeholder Engagement
Gross Profit Margin
Improve Profitability
Gives clear expectations and accountability
Return on Investment (ROI)
Enhance Efficiency
Builds a sense of purpose for staff
Cost of Goods Sold (COGS)
Reduce Costs
Encourages teamwork and shared improvement
FanRuan’s collaborative tools help teams work together. These tools let you get and share data easily. You can make reports and dashboards without needing IT help. Teams can share and use data sets again. This makes it easy for everyone to stay together and work toward the same goals.
Foster Stakeholder Buy-In
Getting buy-in from everyone is important for a good kpi dashboard. You should include stakeholders early and treat them as partners. Let them help solve problems and share ideas. This makes people feel important and builds trust. You can also find problems before they get worse and keep everyone focused on the same goals.
Here are some ways to get strong buy-in:
Work together to make choices.
Find and fix problems early.
Make sure everyone’s goals match.
Use different ways to talk with each group.
FineBI’s role-based access control helps you manage who sees what on your dashboard. You can let the right people see the right data. Row-level security keeps private information safe. Single sign-on makes logging in easy for users. Audit logs show who does what, so you can keep everything safe and fair.
When you match your healthcare revenue cycle metrics with your goals and include your team, your dashboard becomes a tool for better revenue cycle management. Everyone can see progress, share ideas, and work together for success.
You get clear results when you use FineBI and FanRuan to make your revenue cycle KPI dashboard. The table below lists the main benefits:
Benefit
Description
Higher Efficiency
All revenue processes work better.
Reduced Cycle Time
Revenue processes finish faster with smart fixes.
Lower Defect Rates
There are fewer mistakes in the revenue cycle.
Increased Throughput
Watching metrics helps revenue operations grow.
First, pick the most important KPIs that fit your goals. Keep checking how you are doing and talk with your team. This way, you can see patterns, help everyone work together, and keep getting better.
Product Trial
FineReport
Pixel-perfect reports · Interactive dashboards · Easy data entry · Digital twins
Access a wealth of case studies, industry insights, and solution guides to accelerate digital transformation.
FAQ
What is a revenue cycle KPI dashboard?
A user-friendly dashboard has clear labels and simple layouts. It is easy to move around and find things. You can filter and change views without getting confused.
How does FineBI help with data integration?
FineBI connects to many data sources like databases, files, and APIs. You can bring all your data together in one place. This makes your dashboard more accurate and saves you time
Can I customize dashboards for different teams?
Yes, you can. FineBI lets you set up dashboards for each team or role. You control who sees what data. This keeps information safe and helps each group focus on their own goals.
What KPIs should I track in my revenue cycle dashboard?
You should track clean claim rate, denial rate, days in accounts receivable, and collection costs. These KPIs help you find slow spots and improve your revenue process.