Digital marketing change faster every year. New cross channel marketing dashboard tools change how you do cross-channel marketing. Industry reports say AI, real-time analytics, and data integration need quick strategies and better data-based choices.
You stay ahead by learning about these trends and changing your marketing. Tools like FanRuan's FineReport help you keep up and make better choices.
Real-Time Trends in Cross Channel Marketing Dashboards
Dynamic Data Visualization
Dashboards are changing from old reports to new, live ones. This lets you see data right away and act fast. You can spot trends as they happen. You do not need to wait for reports every week or month. Real-time analysis shows what is working and what needs fixing.
Dynamic data visualization helps you in different ways:
You can focus on tasks that matter most right now.
You use insights to make changes, like fixing content if engagement drops.
You update dashboards to fit new goals, so your reports stay useful.
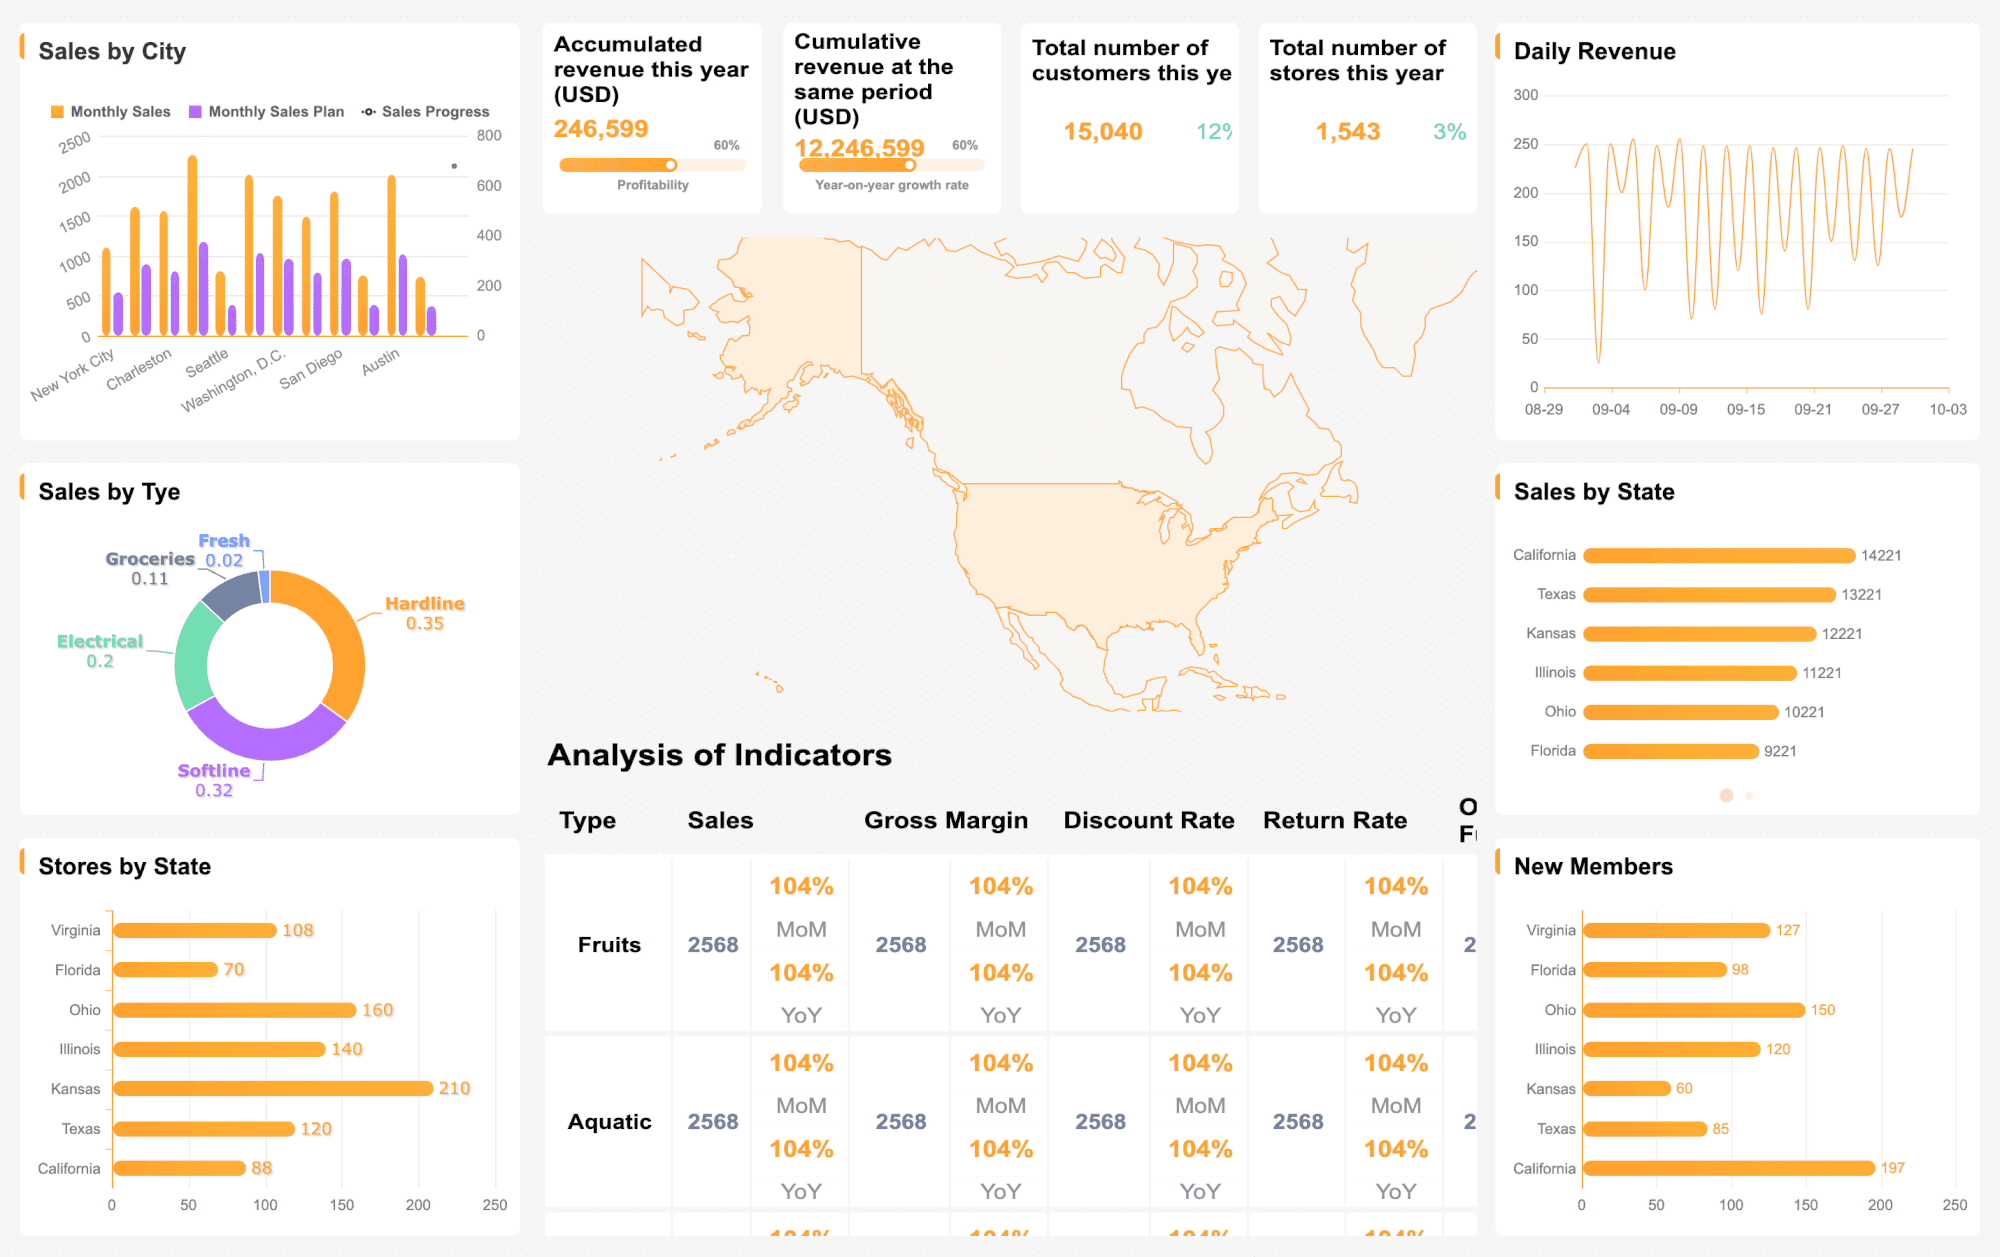
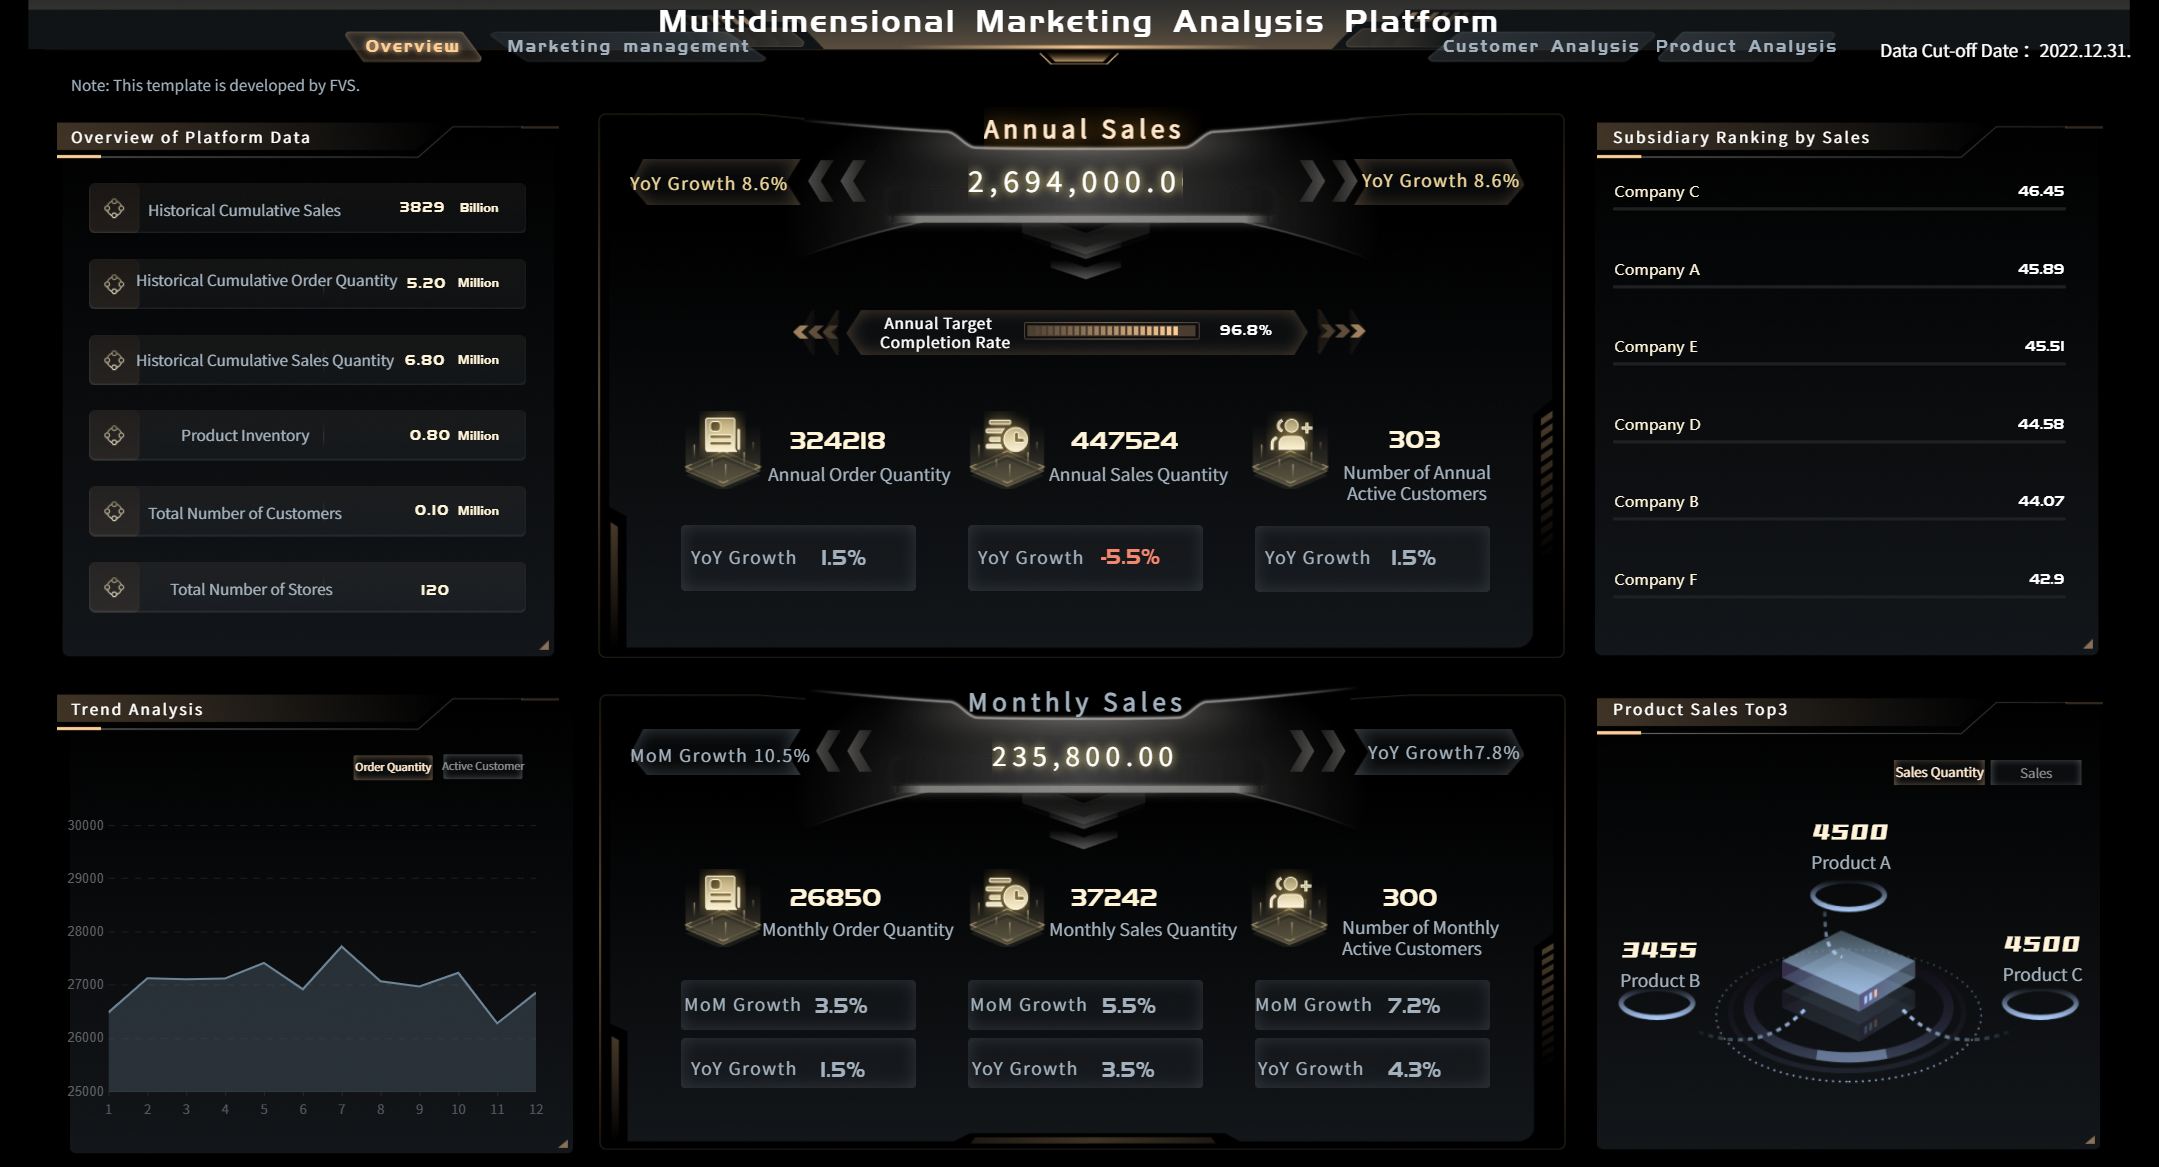
FineReport gives you tools to build these live dashboards. You can connect to many data sources and see all your marketing data together. The drag-and-drop feature makes building dashboards simple. You can use 3D charts, interactive graphs, and mobile dashboards to track campaigns anywhere.
Case studies show dynamic dashboards help you make better choices. You can fix problems fast. If a campaign is not doing well, you can change your plan before losing money. This quick action gives you a big edge in a fast market.
Real-time dashboards do more than show numbers. They help you act fast and feel sure about your choices.
Unified KPI Tracking
You need to watch many metrics to see how your marketing is doing. A unified dashboard puts all your key performance indicators (KPIs) in one place. You do not have to switch between tools or reports. You see everything together, like visibility, conversion, and ROI.
Marketing development funds, sales incentives, program operations costs
Efficiency
Cost per partner-sourced lead, partner pipeline per dollar invested, payback period
You also want to track advanced metrics:
Customer Lifetime Value (CLV): See how much each customer is worth over time.
Attribution Modeling: Find out which channels bring the most conversions.
Multi-Touch Engagement: Look at how users interact with your brand before converting.
FineReport helps you bring all these KPIs together. You can connect data from social media, email, search, and more. The platform lets you build dashboards that show the whole customer journey. You can compare metrics side by side and spot trends you might miss in separate reports.
Unified KPI tracking gives you clear benefits:
Benefit
Description
Holistic ROI Tracking
Lets you see conversions and revenue across all touchpoints, improving performance.
Trend and Correlation Identification
Helps you spot trends that single reports miss, like how social media affects search.
Real-time Optimization
Lets you move your budget to the best channels and campaigns right away.
You get a full view of your marketing data. You can see how each channel works with others to get results. This helps you make smarter choices and get more from your marketing money.
FineReport makes it easy to track, compare, and improve your KPIs. You can set alerts, automate reports, and share dashboards with your team. This keeps everyone informed and working toward the same goals.
Unified KPI tracking helps you boost your marketing and stay ahead of new trends.
cross channel marketing dashboard - click to engage
AI and Automation in Analytics with Cross Channel Marketing Dashboards
Predictive Insights with AI
AI can make your cross channel marketing dashboard smarter. It helps you guess what might happen next. You do not just see what happened before. Predictive analytics lets you spot future trends in how people act. This means you can fix problems before they start. You can also act before your competitors do.
Predictive analytics models help you guess what customers might do. This lets you act early, not late.
Predictive intelligence uses data to guess what people want. This keeps you ahead in your plans.
Predictive analytics gives you tips for better marketing. This makes your marketing work better.
Most marketers now use AI in their dashboards. In fact:
90% of marketers say AI helps them make faster choices.
You can use these guesses to change your campaigns. You can reach the right people and make your analytics better. This way, your marketing stays useful and strong.
Automated Decision Support
Automation in dashboards changes how you work. Automated decision support gives you alerts and tips right away. These systems watch your campaigns on every channel. They tell you if something strange happens or if numbers drop. You do not have to look for problems. The dashboard shows you where to check.
Automated decision support helps you get more from your marketing. It gives you tips before problems grow. You can spot how customers act early. This lets you change your message or give rewards to keep customers. You can also change your plans based on what customers might do next.
These systems help you:
Save time by acting on tips, not searching for problems.
Stop small issues from turning into big ones.
Use cross-channel attribution modeling to see which channels work best. This helps you spend your money better and keep good channels running.
FanRuan-en's FineReport supports AI analytics and automation with strong features:
Feature
Description
Enhanced Collaboration
Advanced data permissions and teamwork tools for safe sharing.
Optimized for Large Datasets
Handles lots of data fast and gives real-time results.
Robust Data Entry
You can add, delete, or change data on computers or phones. Checks help keep data correct.
Excel-like Report Designer
Drag-and-drop tools make reports easy to build.
Diverse Visualization Types
Many chart types, like 3D charts, help you see your data better.
70+ Data Source Connectors
Connects to databases, files, APIs, and more for full data integration.
Scheduled/Automated Report Generation
Lets you set up reports to run and send out automatically.
With FineReport, you can make reports run by themselves. You can bring in data from many places. You can use smart analytics to learn more. This helps you make better choices and stay ahead in marketing.
Personalization and Multichannel Marketing Analytics with Cross Channel Marketing Dashboards
Custom Dashboard Views
You want dashboards that work for your team. Personalized dashboard views show only the data you need. You can make dashboards for sales, marketing, or customer support. Each team gets quick insights and real-time data. This means you do not wait long for reports. You can make choices faster.
Here is a table that lists the benefits of custom dashboard views:
Feature/Benefit
Description
Real-time data integration
Live updates from many platforms help you act quickly.
Instant access to insights
You see performance right away, not days later.
Reduction in ad spend
You can cut wasted ad spend by up to 40% and boost ROI by 15-30%.
Campaign optimization
You adjust campaigns on the fly based on live data.
Custom dashboards help you match reports to business goals. You do not get lost in extra data. You can lead your team to goals like more sales or better brand awareness. FineReport lets you build dashboards with easy sidebars, search, and new layouts. You can ask questions in plain language and get answers fast.
Customer Journey Mapping
You need to know how customers move between channels. Customer journey mapping tools in a cross channel marketing dashboard put all your data together. Centralized data storage makes your analysis clear and complete. You track what customers do on every platform and see their whole journey.
You can use real-time analytics to find trends and boost engagement. Centralized reporting helps you break down walls between teams and improve campaigns. You mix automation with expert help to get the best results.
Here is a table that shows important parts of customer journey mapping:
Aspect
Description
Data Integration
Tools like Google Analytics give you a full view of customer journeys.
Centralized Reporting
You track interactions across platforms in one place.
Real-time Analytics
You make decisions based on current data, not old reports.
FineReport supports multichannel marketing analytics with dashboards you can change. You can watch KPIs, use survey tools, and react fast to changes. Better navigation and settings make your experience easier. You can ask your marketing data questions and get answers right away. Personalized messages are easier when you see the whole customer journey.
Operational Challenges in Cross Channel Marketing Dashboards
Data Privacy and Compliance
You have to follow strict rules when using customer data. Laws like GDPR and CCPA protect people’s privacy. You must obey these laws to avoid getting fined. It also helps you keep your customers’ trust. Many dashboards now have tools to help you follow the rules. You need to control who can see the data. You also need to track how you use customer information.
Here are some common privacy and compliance problems:
You must ask users before you collect their data.
You need to keep customer data safe from leaks or bad use.
You must let users see or delete their own data.
FanRuan-en’s tools help you meet these rules. The Querio platform uses SOC 2 Type II for data safety. It also uses ISO27001 to handle security problems. You can add these tools to your dashboards to make following the rules easier. This keeps your marketing data safe. It also helps your customers trust you.
Overcoming Implementation Barriers
It can be hard to bring data together from many places. Data silos make it tough to see everything at once. If you do not have a plan, your brand may send mixed messages. The cross-channel attribution paradox can make it hard to know which campaigns work best.
Here are some ways to fix these problems:
Use automation to collect data from all platforms. This saves time and cuts down on mistakes.
Build dashboards that turn raw data into insights. You can look at data right away.
Check automated reports often to make sure they are right.
Use a central data pipeline or ETL tool to combine your marketing data.
Make a first-party data plan and use identity resolution to link actions on different devices.
Use a customer data platform to help with integration. ETL tools help match data for better results.
FanRuan-en’s dashboards are easy to use and connect with your systems. You can link many data sources and manage your marketing data in one place. This makes things simpler and helps you make better choices.
You can solve these problems and get the most out of your dashboards.
You will see new trends change how you use dashboards in 2026. Real-time data, AI, and automation help you make choices faster and smarter. Predictive analytics helps you plan for the future. To keep your strategy strong, experts say you should do these things: 1. Track data that matches your goals. 2. Watch the most important metrics for good insights. 3. Use machine learning to find patterns in your data.
If you pick advanced tools like FineReport, you can build reports easily, get real-time insights, and work better with your team. You should upgrade your dashboards to automate tasks, link data sources, and spend more time on creative ideas. Check if your system does all these things. If it does not, think about moving to a better, AI-powered platform.
Product Trial
FineReport
Pixel-perfect reports · Interactive dashboards · Easy data entry · Digital twins
Access a wealth of case studies, industry insights, and solution guides to accelerate digital transformation.
FAQ
What is a cross channel marketing dashboard?
A cross channel marketing dashboard shows data from many marketing channels in one place. You can see how your campaigns perform. This helps you make better decisions fast.
Can I customize a cross channel marketing dashboard for different stakeholders?
Yes! You can build custom views for sales, marketing, or support. Each team sees only the data they need. This makes work easier and faster.
How does FineReport help with real-time analytics in a cross channel marketing dashboard?
FineReport connects to many data sources. You see live updates on your dashboard. You can track changes as they happen and respond quickly.
Is my data safe in a cross channel marketing dashboard with FineReport?
FineReport uses strong security tools. You control who sees your data. The platform follows top standards like SOC 2 Type II and ISO27001.