When you work with data tables, you often see rows and columns, but what do they really mean? In every data table, a column runs vertically and contains all the information for a specific field, while a row runs horizontally and holds a single record. You can see this structure in spreadsheets or tools like FineReport. Understanding columns vs rows helps you organize, view, and analyze your data more effectively.
Columns vs Rows in Data Tables
What Are Columns?
Columns form the backbone of every data table. You see them running vertically from top to bottom. Each column represents a specific attribute or field, such as "customer name," "order date," or "total amount." In FineReport, columns organize your data in a way that makes it easy to compare values across different records. The interface feels familiar if you have used Excel, where columns are labeled with letters like A, B, and C.
Naming conventions for columns help you keep your data organized and understandable. For example, you might see names like customer_id, created_dt, or total_amt. These names follow patterns that make it clear what kind of data each column holds. Using clear and consistent names, such as first_name instead of fn, helps you avoid confusion and maintain your tables easily.
Tip: Always use specific and contextual names for columns. Avoid generic names like "data" or "info" because they make large tables hard to navigate.
| Suffix | Meaning | Example |
|---|---|---|
| _id | Identifier | customer_id |
| _dt | Date | created_dt |
| _amt | Amount | total_amt |
| _flg | Boolean flag | active_flg |
| _cd | Code or Enum | status_cd |
| _txt | Text field | description_txt |
Columns vs rows play different roles in your data analysis. Columns let you focus on one attribute at a time, making it easy to spot patterns or outliers. In FineReport, you can use columns to filter, sort, and visualize data with built-in charts and dashboards.
What Are Rows?
Rows run horizontally across your data table. Each row contains a single record, such as one customer, one transaction, or one product. In FineReport and Excel, you enter and modify data row by row, ensuring a consistent structure for every record. You can add, delete, or batch remove rows as needed. This flexibility helps you manage your data efficiently.
| Feature | Description |
|---|---|
| Row-based Data Entry | Enter and modify data with a consistent structure. |
| Insert and Delete Rows | Add or remove rows as needed. |
| Batch Delete | Delete multiple rows at once. |
| Single-row Submission | Submit data for individual rows. |
| Auto Calculation | Use formulas for automatic calculations. |
| Data Validation | Ensure data meets specific criteria. |
Rows and columns work together to create a grid that holds all your information. For example, in a customer list, each row might include a customer's name, address, and phone number. In a sales record, each row could show the transaction ID, product, quantity, and date.
| Industry | Table Name | Attributes |
|---|---|---|
| Retail | Products | Product ID, name, description, category, price |
| Healthcare | Patients | Patient ID, name, birthdate, address, phone |
| Finance | Account Management | Customer data, account numbers, transactions |
| E-commerce | Product Catalog | Product name, description, images, price |
| Social Media | User Management | User accounts, relationships, events, posts |
You use rows and columns in FineReport to organize data for different industries. Finance teams track transactions and customer info. Healthcare professionals manage patient records and treatment histories. E-commerce businesses analyze inventory and sales. The clarity of columns vs rows in your tables directly affects how easily you can read, compare, and analyze your data.
FineReport makes it simple to design tables with clear rows and columns. The drag-and-drop designer lets you build interactive dashboards and reports. You control what users see with cell-level security and multi-dimensional user management. This structure ensures your data remains accurate and easy to analyze.
If you want to learn more about working with columns vs rows, you can explore resources like W3Schools, SQLZOO, and Codecademy. Practicing with SQL queries and FineReport's designer will help you master these concepts and improve your data analysis skills.
Difference Between Columns vs Rows
Structure and Orientation
When you look at a data table in FineReport, you see a clear grid made up of rows and columns. The arrangement of these elements shapes how you read and use your data. A column runs vertically from top to bottom. Each column holds information about a specific attribute, such as "Product Name" or "Order Date." A row runs horizontally from left to right. Each row contains a single record, like one customer's order or one employee's details.
FineReport's report designer makes this structure easy to understand. You drag fields into columns to define what attributes you want to track. You enter data into rows to create new records. This vertical and horizontal layout helps you scan, compare, and analyze information quickly.
Proper alignment and logical flow in rows and columns enhance clarity and make it easier for you to interpret data. When you left-align text and right-align numbers, you improve readability and make comparisons more intuitive.
- You can streamline your data by:
- Aligning text and numbers for easy scanning.
- Designing the layout with a logical flow.
- Showing only essential columns to avoid overwhelming users.
When you use FineReport, you can sort and filter columns and rows to find the information you need. Sorting by a column, such as "Order Date," lets you see trends over time. Filtering rows helps you focus on specific records, like orders from a certain region. These features reduce cognitive load and make your data tables more usable.

Attributes vs Records
The difference between rows and columns goes beyond their orientation. Each column represents an attribute, which means it defines a specific type of information. For example, in a sales table, columns might include "Product ID," "Quantity," and "Price." Each row, on the other hand, represents a record. A row brings together all the attributes for one item, such as a single sale or a single customer.
| Type | Description |
|---|---|
| Row | Represents individual records in a database, structured horizontally. |
| Column | Holds data about a specific attribute, structured vertically. |
You see this distinction clearly in FineReport's data entry forms. When you create a form, you set up columns for each attribute you want to collect. As users fill out the form, each submission becomes a new row in your table. This structure keeps your data organized and makes it easy to analyze.
- Rows and columns work together to:
- Highlight significant patterns in your data.
- Improve comprehension by creating a logical flow.
- Allow for sorting and filtering, so you can retrieve information quickly.
| Type | Description |
|---|---|
| Row | Represents records (tuples) in a table. |
| Column | Represents attributes (data fields) in a table. |
Understanding the difference between rows and columns helps you design better reports and dashboards in FineReport. You can choose which columns to display, making sure you show only the most important attributes. You can organize rows to highlight key records, such as top-performing products or recent transactions. This approach improves data readability and usability, making your analysis more effective.
When you master the structure and meaning of rows and columns, you unlock the full potential of reporting tools like FineReport. You can create tables that are easy to read, analyze, and share. The difference between rows and columns forms the foundation of every data table, and knowing how to use them helps you make smarter decisions.
Examples of Columns vs Rows in FineReport
Table Reports
When you create a table report in FineReport, you work directly with columns and rows to organize your data. Each column stands for a specific attribute, such as "Product Name" or "Sales Amount." Each row represents a single record, like one transaction or one customer. FineReport lets you expand cells, split columns, and group rows, which helps you display complex data in a clear and readable way. For example, you can use cell expansion to build cross-tab reports, where you compare sales across different regions and time periods. You can also use parent-child cells to create grouped reports, showing how each department's sales break down by product. This structure makes it easy for you to spot trends and patterns.
| Feature | Description |
|---|---|
| Cell Expansion | Build row-style and cross-tab reports using columns and rows effectively. |
| Parent-child Cell | Create grouped reports with hierarchical rows and columns. |
| Data Display Mode | Choose list, grouping, or summary to organize data in rows and columns. |
FineReport's approach to columns vs rows ensures that your reports use space efficiently. You avoid blank areas and present your data in a way that supports quick understanding.
Data Entry Forms
In FineReport, data entry forms rely on the structure of columns and rows to collect and store information. Each column in a form matches a field you want to capture, such as "Employee ID" or "Project Name." Each new submission creates a new row in your database. You can add, edit, or delete rows as needed, keeping your records up to date. FineReport supports importing Excel files, so you can quickly fill many rows at once. The clear separation between each column and row helps you validate data and reduce errors. When you use grouping or summary display modes, you can organize your entries for easier review.
Dashboards
Dashboards in FineReport bring together data from multiple reports, showing key metrics in real time. You often see tables, charts, and graphs that use columns and rows to present information. For example, a sales dashboard might show a table where each column displays a metric like "Revenue" or "Units Sold," and each row lists a different region or product. You can split columns and rows to highlight important data points, making your dashboard easy to scan. This structured approach helps you compare results and make informed decisions quickly.
FineReport simplifies the process of working with columns vs rows. You use drag-and-drop tools to design reports, forms, and dashboards. The software ensures that your data stays organized, readable, and ready for analysis. By mastering the use of columns and rows, you unlock the full power of FineReport for your business needs.
Importance of Columns vs Rows for Analysis
Data Organization
Understanding what columns vs rows means in data tables helps you organize information in FineReport with precision. When you structure your data correctly, you make it easier to find, compare, and analyze important details. Each column represents a specific field, such as "Employee Name" or "Order Date." Each row holds a single record, like one employee or one transaction. This clear separation allows you to manage large datasets without confusion.
FineReport’s decision-making platform relies on accurate data organization. If you misinterpret a column or a row, you risk placing information in the wrong field. This mistake can lead to misclassified data, inflated counts, incomplete reports, and poor decision-making. You avoid these problems by keeping each column focused on one variable and each row dedicated to one record.
| Aspect | Rows | Columns |
|---|---|---|
| Definition | Individual records | Specific fields or variables |
| Ideal Use Case | Transactional data | Analytical data |
| Impact on Data Org. | Helps in record operations | Aids in variable comparisons |
You use rows and columns to build reports that show trends, highlight outliers, and support business decisions. FineReport's automated reporting features depend on this structure to deliver accurate insights.
Workflow Efficiency
When you understand the difference between a column and a row, you improve your workflow in FineReport. You process data faster because you know where each piece of information belongs. The correct use of columns and rows reduces the volume of data you need to handle, which boosts performance and saves time.
- You optimize data processing speed by structuring information into the right columns and rows.
- You minimize errors and avoid unnecessary data transformations.
- You enhance report optimization, making it easier to generate and distribute reports automatically.
FineReport’s automated scheduling and distribution features work best when your data tables use columns and rows correctly. You can set up reports to run at specific times, send results to managers, and ensure everyone receives accurate information. This efficiency supports better decision-making and keeps your business running smoothly.

Understanding the difference between columns and rows in data tables is essential for effective data management. Columns organize data vertically by attribute, while rows store individual records horizontally.
| Characteristics | Columns | Rows |
|---|---|---|
| Data Organization | Vertical | Horizontal |
| Use Cases | Aggregated data, data warehousing | Transactional data, OLTP systems |
| Advantages | Fast querying, easy aggregation | Easy insertion, flexible retrieval |
- Proper structuring of columns and rows in FineReport ensures accurate analysis, efficient data manipulation, and reliable results.
- Apply these concepts to organize your data for better insights and streamlined workflows.

Continue Reading About Columns vs Rows
Bar Chart Race: A Complete Guide
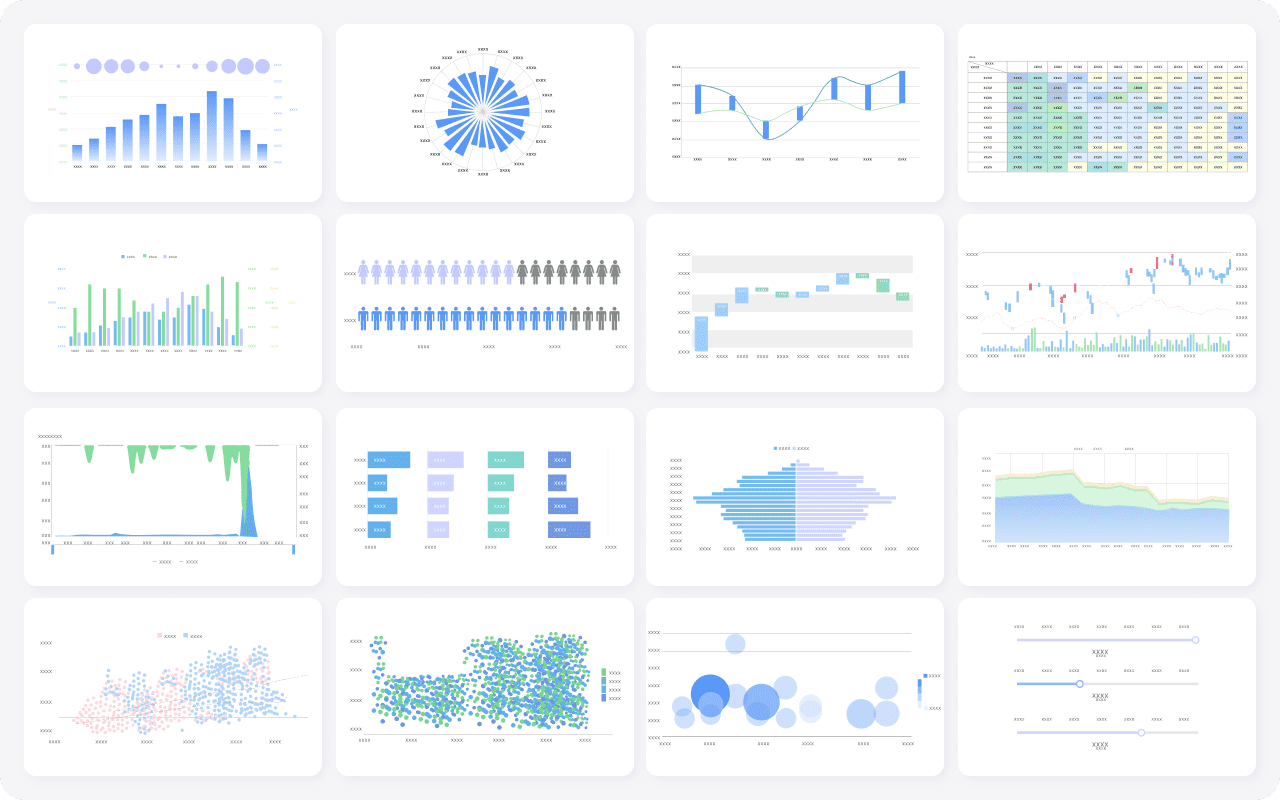
16 Types of Chart for Effective Data Visualization
22 Different Types of Graphs in Data Visualization: A Practical Guide


FAQ

The Author
Lewis
Senior Data Analyst at FanRuan
Related Articles

7 White Label Reporting Tool Options Compared: What Agencies and SaaS Teams Should Evaluate Before Buying
A white label $1 is software that lets you deliver dashboards, reports, or analytics experiences under your own brand instead of the vendor’s. If you are a marketing agency, consultancy, SaaS company, or product team, yo
Yida Yin
Jul 01, 2026

Automated Reporting for Clients: How to Keep KPI Definitions and Permissions Under Control
$1 for clients only works when two things stay stable as reporting volume grows: metric meaning and access control . Without those controls, teams may send reports faster, but they also scale inconsistency, confusion, an
Yida Yin
Jun 28, 2026

ESG Reporting Framework Explained: How to Choose Between GRI, ISSB, ESRS, SASB, and CDP
Choosing the right $1 framework is no longer a side task for sustainability teams. It affects regulatory readiness, investor communication, customer trust, internal decision making, and how efficiently your organization
Yida Yin
Jun 28, 2026