A data quality dashboard gives you a clear, interactive view of your organization’s most important data metrics, helping you spot issues and improve accuracy in real time. Data quality matters because your business relies on accurate, complete, and timely information to make smart decisions. Tools like FineReport help you track these metrics, so you can quickly identify problems and take action.
A data quality dashboard is a visual tool that lets you monitor, analyze, and improve the reliability of your organization’s data by tracking key metrics in real time. You use it to spot problems quickly, make better decisions, and ensure your data stays accurate and complete.
When you use a data quality dashboard, you focus on several important metrics. These metrics help you understand how trustworthy and useful your data is. Here is a table showing the most commonly tracked metrics and what they mean:
| Metric | Description |
|---|---|
| Accuracy | Measures if the data is correct and free from errors. |
| Completeness | Checks if all required data is present, with no missing values. |
| Consistency | Ensures data matches across different records and systems. |
| Timeliness | Shows if data is updated and available when needed. |
| Validity | Confirms that data follows rules and standards. |
| Uniqueness | Identifies duplicate records and ensures each entry is unique. |
| Relevance | Assesses if the data fits the purpose you need. |
| Data downtime (DDT) | Tracks periods when data is inaccurate or unavailable. |
| Table uptime | Measures how often data tables are accessible to users. |
| Table health | Counts incidents affecting data tables over time. |
| Table coverage | Shows the percentage of tables monitored by your dashboard. |
| Custom monitors | Counts custom checks set up for important tables. |
| Unused tables | Highlights tables and dashboards that are not being used. |
| Deteriorating queries | Finds queries that are slowing down, which may signal data issues. |
| Status update rate | Tracks how often data quality status changes, affecting response times. |
| Importance score | Ranks data issues based on how critical the affected tables are. |
You can use these metrics to check the health of your data. For example, accuracy and completeness help you avoid mistakes and missing information. Consistency and validity make sure your data matches across systems and follows rules. Timeliness and relevance keep your data useful for decision-making.
Tip: Tracking these metrics daily or in real time helps you catch problems early and keep your data trustworthy.
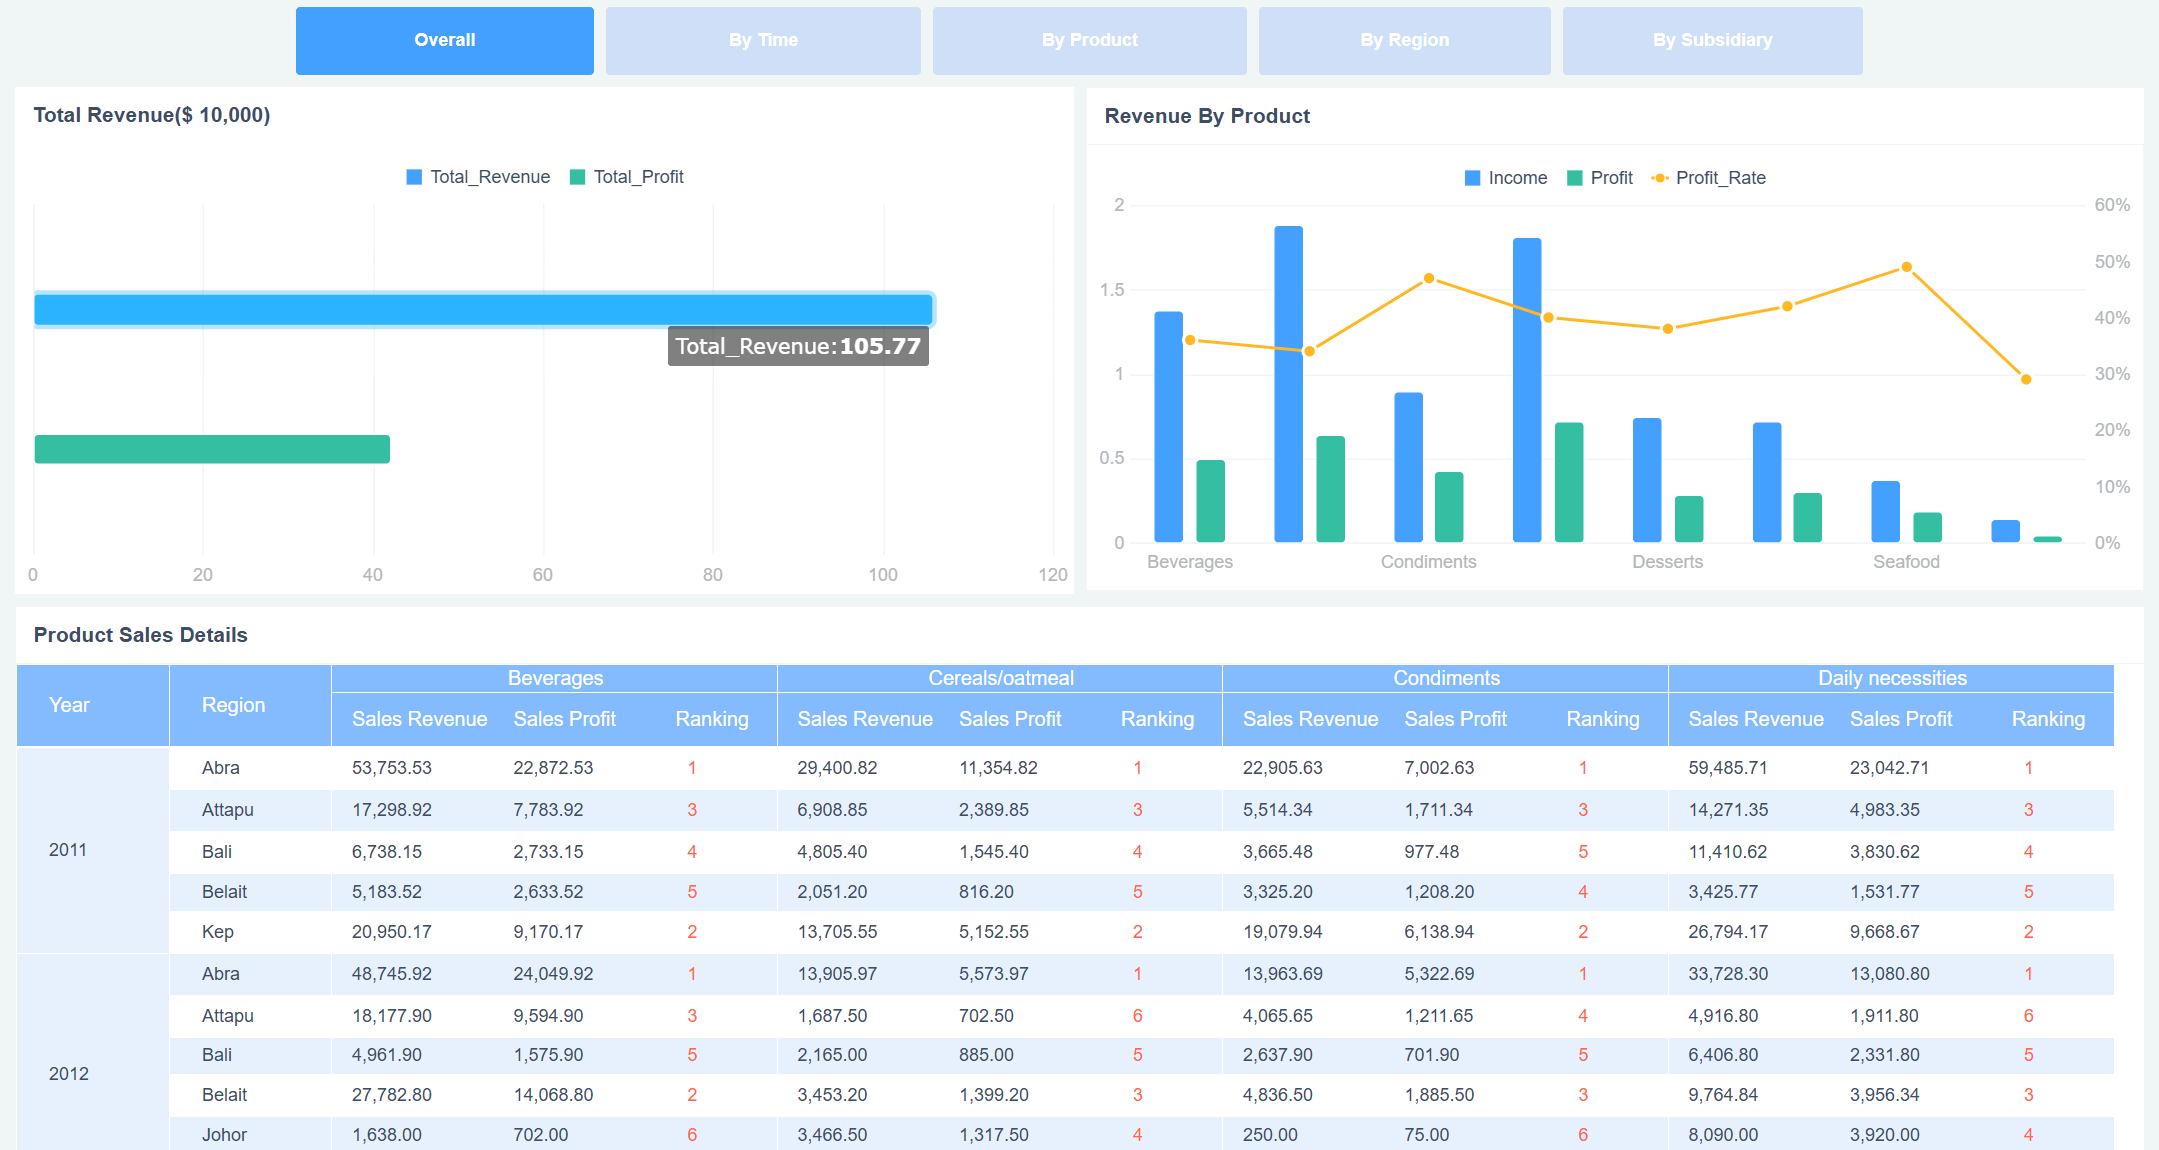
A data quality dashboard works by connecting to your data sources and displaying key metrics in charts, tables, and graphs. You get a clear view of your data’s health and can drill down into specific tables or records to find issues. FineReport makes this process simple with its drag-and-drop interface and real-time monitoring features.

You can set up automated alerts for anomalies, so you respond quickly when something goes wrong. For example, if a table’s accuracy drops or duplicate records appear, the dashboard notifies you right away. You can also create custom monitors for important tables, making sure you track the dimensions that matter most to your business.
Here are some main functions you get with a data quality dashboard:
You benefit from dashboards by improving data completeness and consistency. Reliable data lets you make better decisions and reduces the risk of costly mistakes. Measuring discrepancies across systems helps you fix integration issues and keep your data aligned.
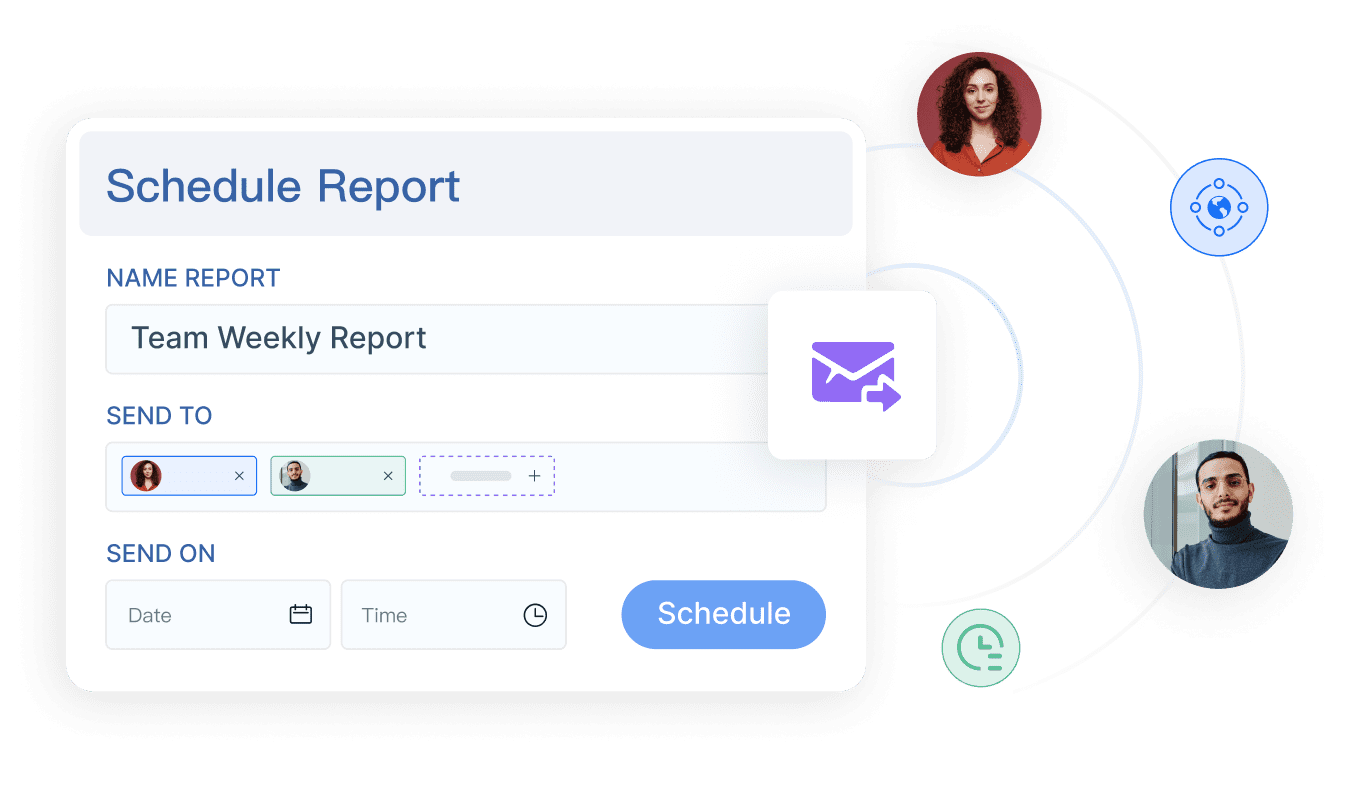
FineReport stands out as a leading tool for building interactive data quality dashboards. You can connect to multiple data sources, customize your dashboard layout, and access insights on any device. FineReport’s features support automated report generation, scheduled distribution, and advanced visualization, making it easier for you to manage data quality across your organization.
Note: Organizations now treat data quality as a strategic asset. Business leaders and data teams share responsibility for maintaining high standards. The rise of Chief Data Officers and the adoption of continuous monitoring show how important data quality dashboards have become.
You can measure the return on investment by tracking reductions in data downtime, fewer incidents, and improved business outcomes. When you use a data quality dashboard, you help your organization save time, reduce costs, and build trust in your data.
You rely on accurate data to make smart choices every day. A data quality dashboard gives you real-time insights into your data’s health, so you can trust the information you use. When you see issues like missing values or inconsistencies, you can act quickly to fix them. This reduces the risk of making decisions based on bad data.
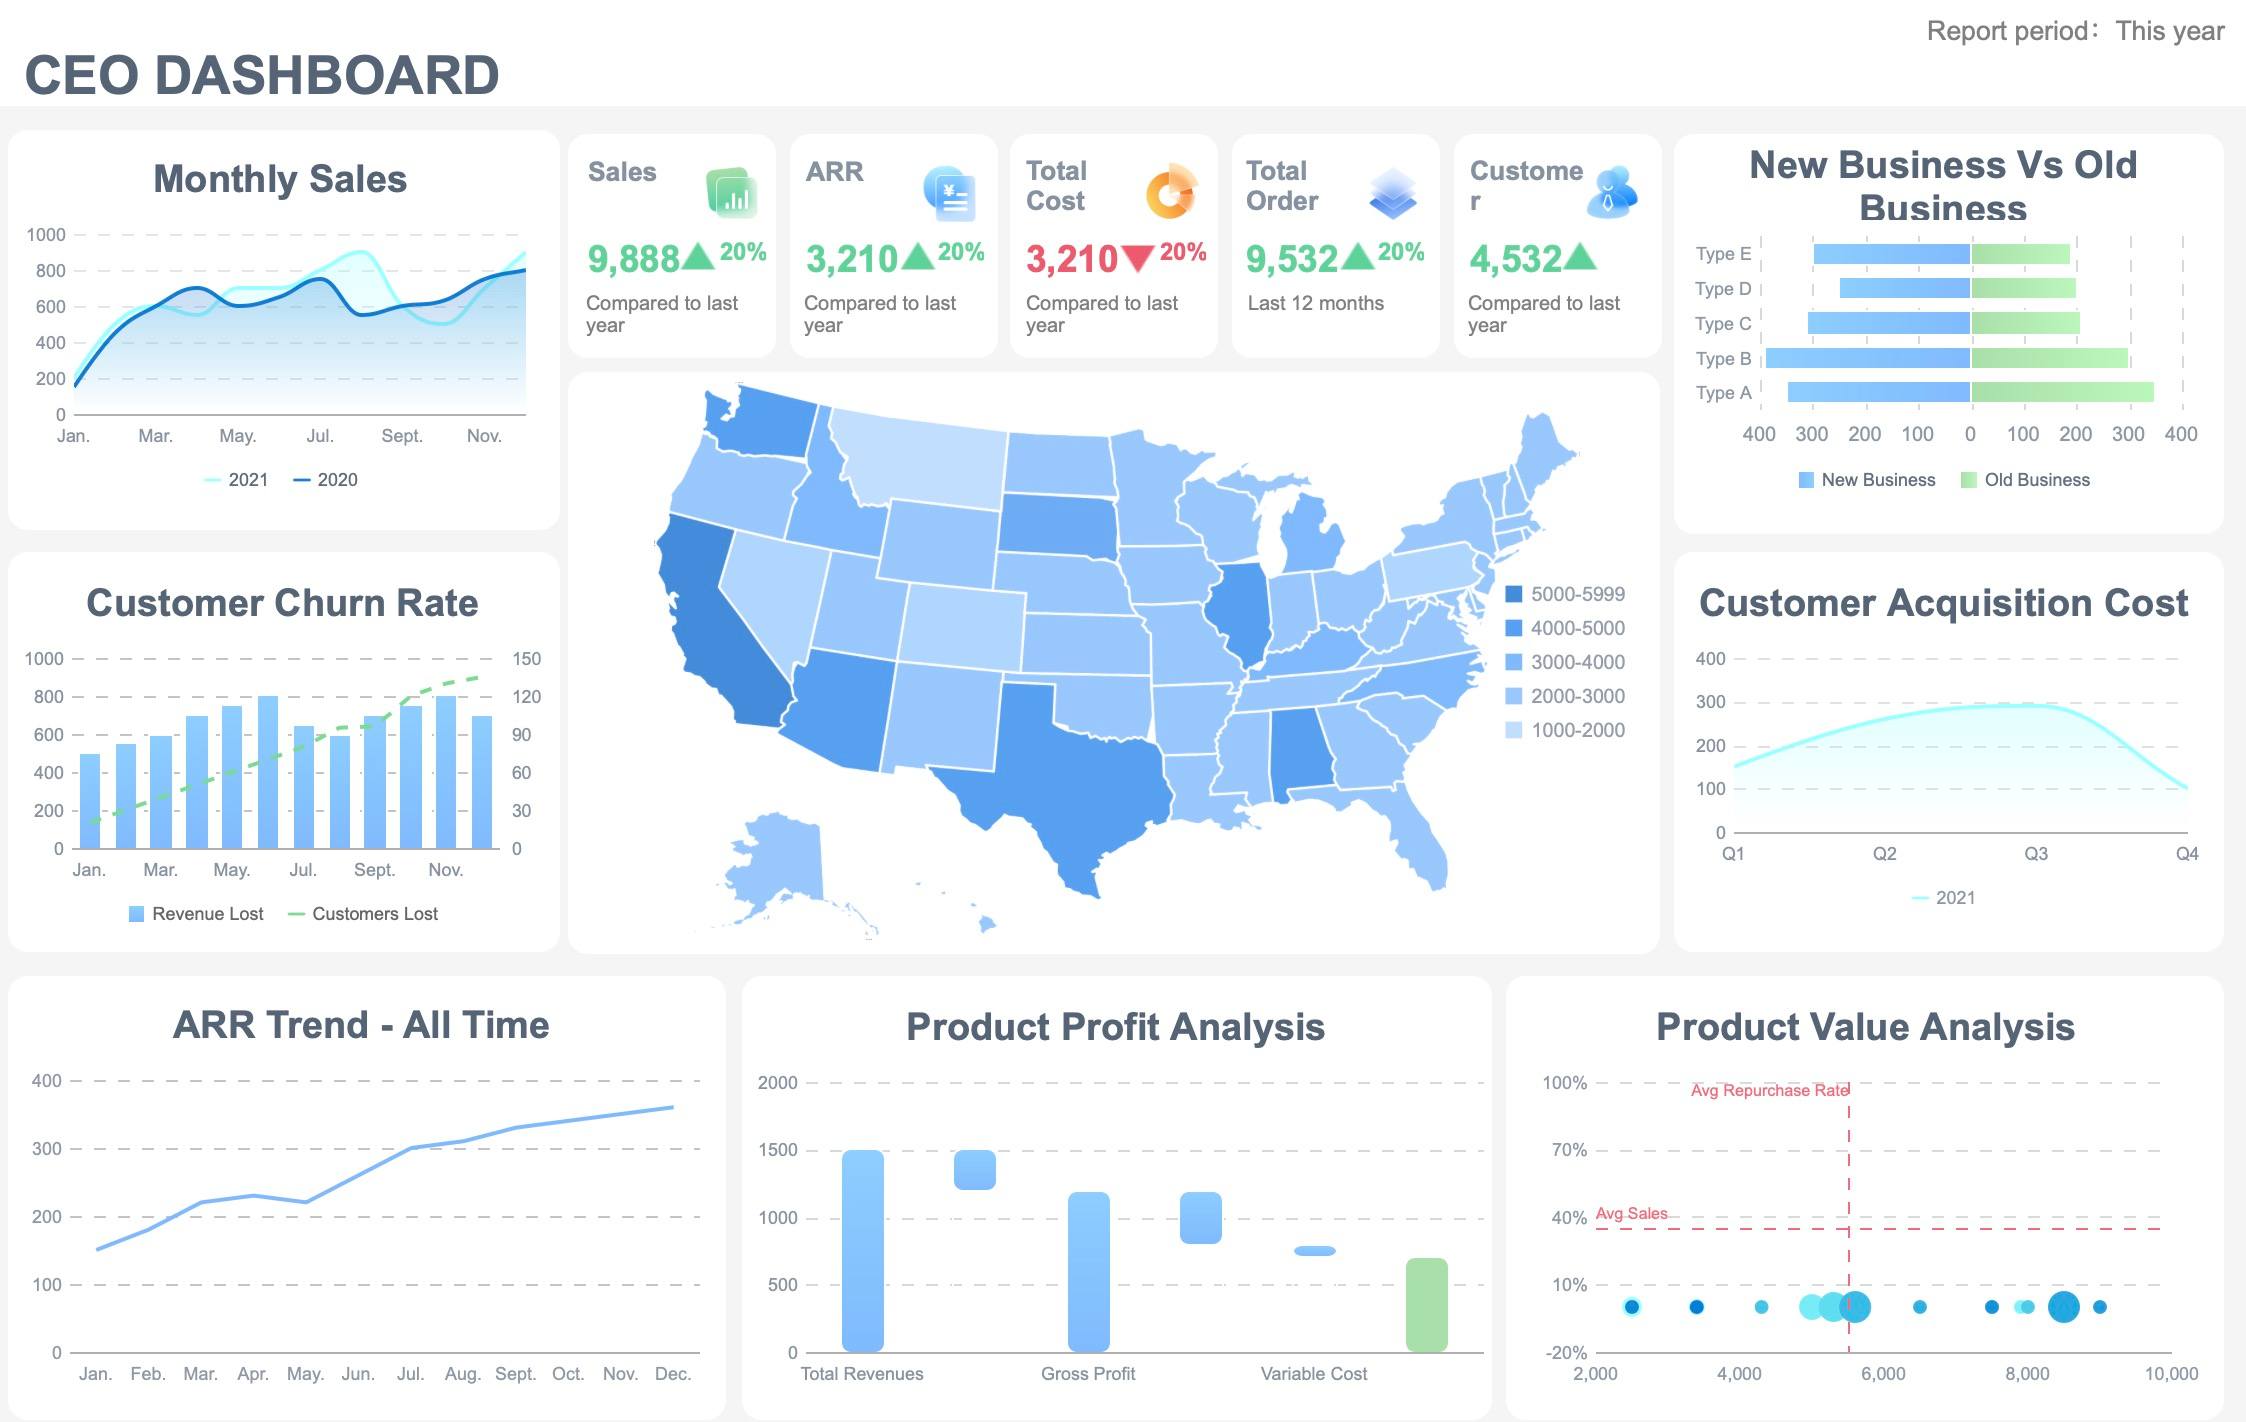
Many organizations use a data quality dashboard to track key metrics tied to their strategic plans. For example, you might share an overall data quality score with your leadership team each quarter. This shows how your data supports your business goals. Research from McKinsey shows that companies using performance dashboards see better customer satisfaction, higher employee engagement, and improved operations. A CEO dashboard acts as a command center, giving you real-time access to critical metrics and helping you align your team’s efforts with your company’s strategy.
Note: Some people think dashboards are just static tools, but a data quality dashboard supports dynamic inquiry and helps you explore new questions as your business grows.

A data quality dashboard also helps you work more efficiently and stay compliant with regulations. In many industries, you must follow strict rules about how you collect, store, and use data. Dashboards help you monitor compliance standards like GDPR, HIPAA, SOX, CCPA, and Good Manufacturing Practices (GMP). You can track data accuracy, audit trails, and readiness for inspections.
FineReport’s real-time monitoring and automation features make compliance easier. You can visualize critical metrics, analyze trends, and set up secure access controls. FineReport integrates with your existing systems, so you can streamline your workflows and reduce manual errors.

| Key Feature | Contribution to Compliance and Efficiency |
|---|---|
| Real-time Data Visualization | Enables monitoring of critical metrics and performance indicators dynamically. |
| Comprehensive Analysis | Facilitates deep dives into portfolios and risk assessments. |
| Actionable Insights | Provides insights for proactive risk management and decision-making. |
| Secure Access Controls | Protects sensitive data and restricts access to authorized personnel. |
| Seamless Integration | Integrates with existing systems for streamlined supervision workflows. |
You can also connect your data quality dashboard to your business intelligence systems. This ensures everyone works from the same, trusted data. Real-time integration helps you respond quickly to market changes and improves your operational efficiency. Automation reduces the time you spend preparing data, so you can focus on strategic tasks.
Tip: When you use a data quality dashboard, you build trust in your data, improve your team’s productivity, and make it easier to meet industry regulations.
A data quality dashboard is a tool that lets you see the health of your data at a glance.
You use it to track accuracy, completeness, and other key metrics, helping you spot problems early and make better decisions. This dashboard gives you real-time updates, so you always know if your data is reliable.
You can use FineReport to improve quality control in manufacturing. FineReport helps you build dashboards that monitor defect rates and scrap rates across your production lines. You see trends in product quality and can quickly find the root causes of defects. For example, you might use bar charts to compare qualification rates at each stage of production. Line charts help you track changes in defect rates over time. Pie charts show you the main reasons for scrap. With these tools, you can reduce waste and improve product quality. FineReport also supports real-time alerts, so you can act fast when a problem appears.
Tip: FineReport’s dashboards let you customize charts and set up alerts for your most important quality indicators.
Many companies have seen big improvements with FineReport. BOE, a global leader in display technology, used FineReport to solve problems with scattered data and inconsistent metrics. By building a unified data platform and using KPI dashboards, BOE reduced inventory costs by 5% and increased operational efficiency by 50%. You can use FineReport in other industries too. In finance, you track compliance and risk. In retail, you monitor sales and inventory. In healthcare, you ensure data accuracy for patient records. FineReport adapts to your needs, making it a smart choice for any business that values data quality.


A data quality dashboard is a visual tool that lets you monitor, analyze, and improve the reliability of your organization’s data in real time.
You use it to track key metrics, spot issues, and make sure your data stays accurate and useful for decision-making.
To implement a data quality dashboard with FineReport, follow these steps:

Tip: Start with a small pilot dashboard. Test it with a few users before rolling it out across your organization.
You can maximize the value of your dashboard by following these best practices:
| Best Practice | Description |
|---|---|
| Define Clear Objectives and KPIs | Set goals that align with your business needs. |
| Focus on Simplicity and Clarity | Keep dashboards easy to use and avoid too many metrics. |
| Use Visuals Wisely | Choose charts and graphs that make data easy to understand. |
| Automate Data Collection and Alerts | Ensure timely, accurate data and get notified about issues quickly. |
| Prioritize Actionable Insights | Highlight areas that need attention and support decision-making. |
| Make Data Accessible | Allow stakeholders to access dashboards and drill down for details. |
| Ensure Regular Updates | Update dashboards to reflect changes in business and data quality. |
| Gather Feedback and Iterate | Collect user feedback and improve dashboards over time. |
User training plays a key role in adoption. When you train users, they understand how to use dashboards and see their value. This leads to higher engagement and better data handling. For ongoing success, use automated data quality management, conduct regular data profiling, and assign data stewards to oversee standards. Continuous improvement keeps your data trustworthy and your dashboards effective.
A data quality dashboard is a tool that helps you track and improve the reliability of your organization’s data in real time.
You need this tool because it gives you clear visibility, builds trust, and supports proactive data governance.
| Key Reasons for Prioritizing Data Quality Dashboards | Description |
|---|---|
| Proactive Data Governance | You shift governance closer to where data actions happen. |
| Visibility into Data Quality Issues | You spot and fix problems faster. |
| Building Trust in Data | You create confidence in your data. |
FineReport empowers you to achieve high data quality and operational excellence with real-time monitoring, automation, and flexible dashboards.
If you want to learn more, explore resources like optimizing report access, writing efficient SQL, and using the cloud operation maintenance dashboard for better performance.
10 Best Data Quality Software Solutions for Modern Business
Top 10 Data Quality Monitoring Tools You Should Know in 2025
Comparing Data Quality Tools for Features and Pricing
Understanding the Work of a Data Quality Analyst
Why AI Data Quality Is the Next Big Thing in Analytics (2025 Edition)

The Author
Lewis
Senior Data Analyst at FanRuan
Related Articles
Executive Summary Dashboard for Enterprise Leaders: 9 Steps to Design KPIs, Layout, and Governance
Learn 9 steps to design an executive summary dashboard for enterprise leaders. Define KPIs, layout, and governance for better strategic decision-making.
Lewis Chou
May 04, 2026

Executive Dashboard Template: What Enterprise Leaders Should Include Before They Build
Learn what to include in an executive dashboard template for better decision-making. Focus on KPIs, risk signals, and strategic alignment for leadership teams.
Lewis Chou
May 04, 2026

How to Build a Teams Call Queue Dashboard: Turn Raw Queue Data Into Actionable Insights
Learn how to transform raw Teams call queue data into a dashboard for real-time monitoring, trend analysis, and proactive service level management.
Lewis Chou
May 04, 2026


