FineReport is an enterprise reporting and dashboard platform built for complex, highly formatted, data-driven reporting on top of modern data warehouse environments.
What to look for in data warehouse reporting tools for complex enterprise needs
When enterprises evaluate data warehouse reporting tools, the decision should go far beyond chart libraries or dashboard aesthetics. At scale, the real question is whether the platform can reliably turn warehouse data into governed, performant, and business-ready reporting for different user groups.
Core evaluation criteria
For complex enterprise needs, the most important criteria usually include the following:
- Scalability: Can the platform support large data volumes, many concurrent users, and scheduled distribution across departments?
- Semantic modeling: Does it provide a reliable way to define business metrics, dimensions, and reusable logic so teams work from consistent definitions?
- Governance: Can IT and data teams control access, standardize reports, audit usage, and reduce version sprawl?
- Security: Does it support row-level permissions, role-based access control, SSO integration, and deployment policies suitable for regulated environments?
- Performance: Can it handle live queries, optimized extracts, caching, and high-load reporting without degrading the user experience?
- Total cost of ownership: Beyond license price, what will it cost to administer, scale, train users, and maintain long-term reporting reliability?
In enterprise buying cycles, these factors usually matter more than whether a tool is popular among analysts. The best platform is the one that fits reporting depth, architecture, and operational demands over time.
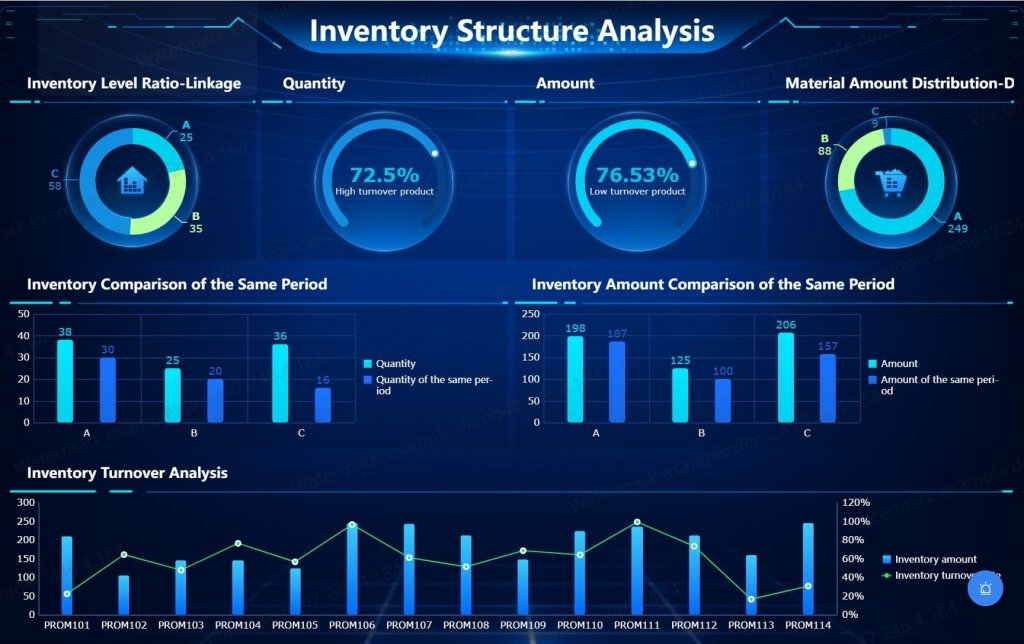
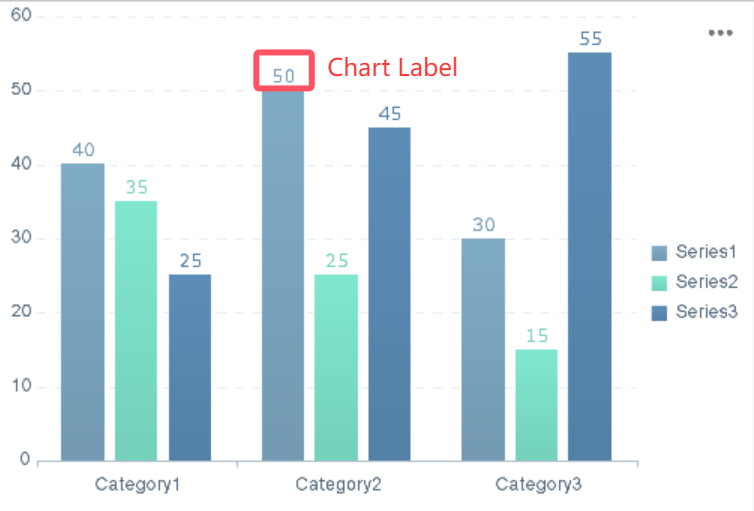
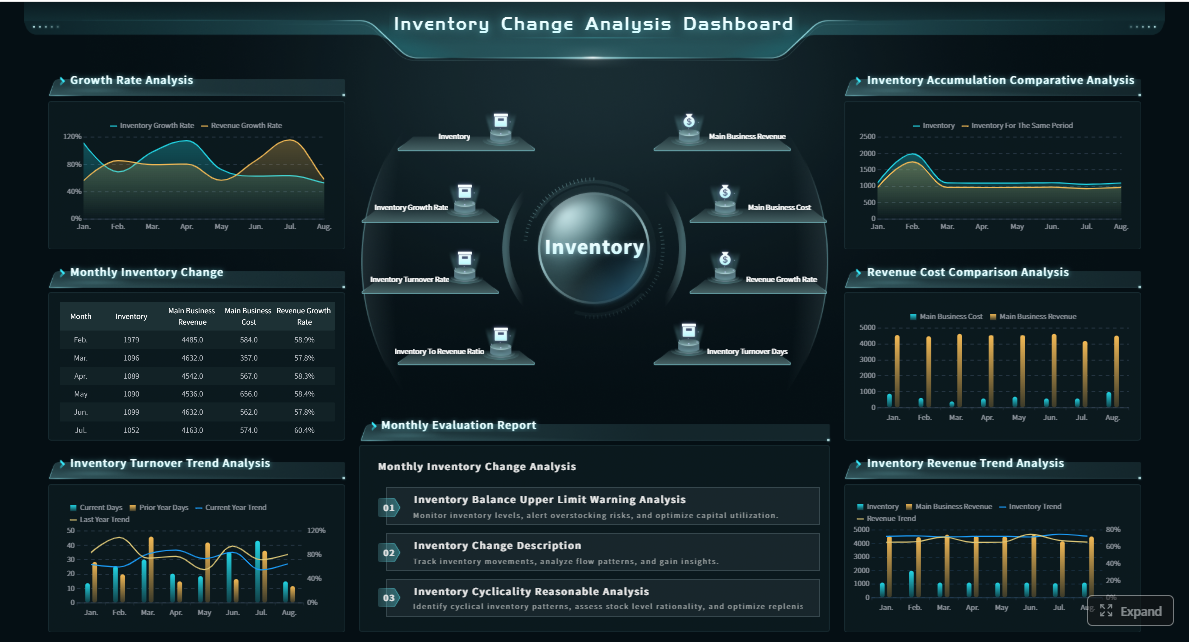 Click To Try The Dashboard
Different reporting requirements by use case
Not all reporting workloads are the same, and that is where many comparison guides oversimplify the market.
Executive dashboards
Executive dashboards prioritize:
- Fast loading
- KPI clarity
- High-level trend visibility
- Mobile or browser accessibility
- Presentation-ready visuals
These dashboards are typically interactive, but not deeply operational. Leaders want quick answers, not complex report navigation.
Operational reporting
Operational reporting usually requires:
- Near-real-time or frequent refreshes
- Department-specific detail
- Filterable drill-downs
- Repetitive daily use
- Strong access control
This use case is common in supply chain, customer service, manufacturing, finance operations, and sales management.
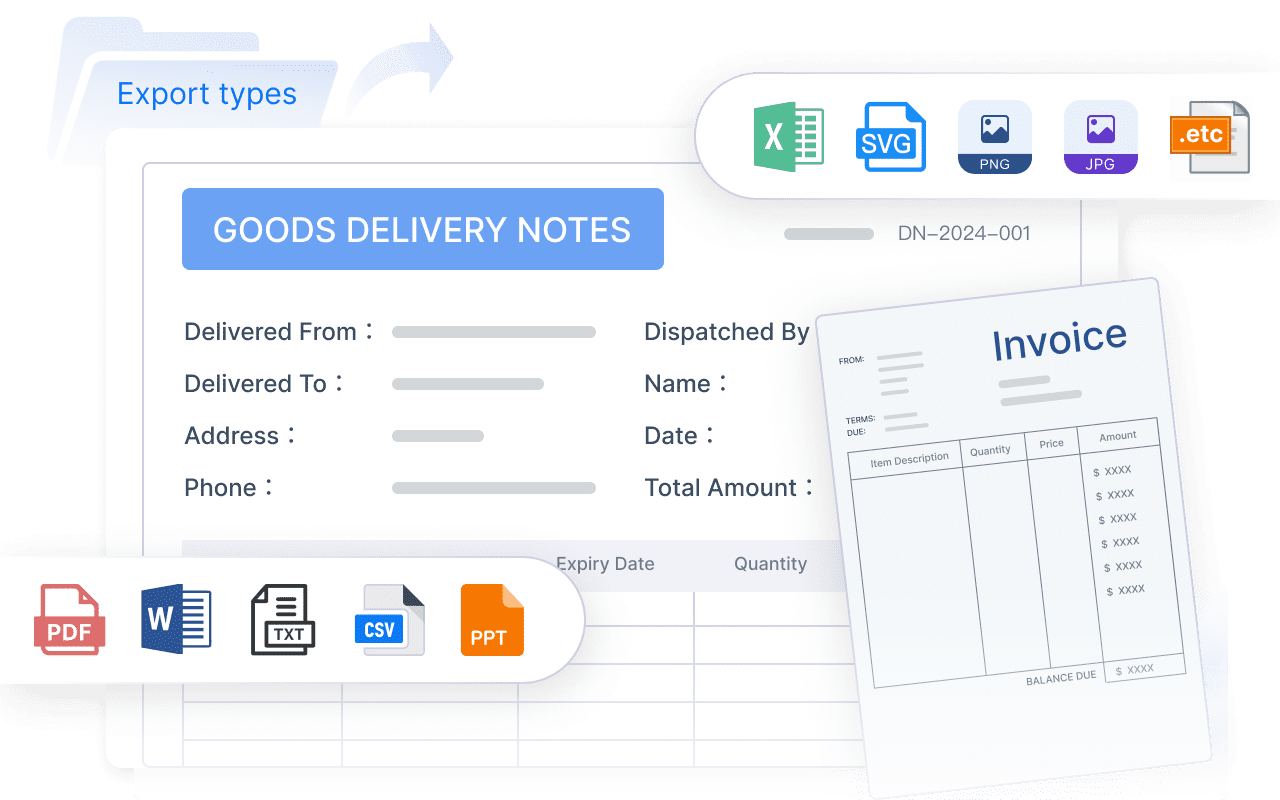
Pixel-perfect scheduled documents
Some business functions still depend on highly structured reports such as:
- Financial statements
- Invoices
- Batch statements
- Compliance submissions
- Regulatory summaries
- Print-ready operational documents
These need precise formatting, page control, headers, footers, merged cells, print logic, and large-scale scheduled delivery. This is where many dashboard-first BI tools become less comfortable.
Constraints that matter most in large organizations
In large enterprises, the challenge is rarely just data visualization. It is operational standardization across systems, teams, and regions.
Key constraints include:
- Multi-source integration: Reports often need to combine warehouse data with ERP, CRM, MES, HR, or legacy operational systems.
- Role-based access: Different users must see different slices of the same report without creating separate copies.
- Cross-team standardization: Central teams need shared templates, metric definitions, and controlled distribution.
- Hybrid architecture support: Many organizations still run a mix of cloud warehouses, on-prem databases, and line-of-business systems.
- Administration at scale: Hundreds of reports and thousands of users require manageable permissions, update workflows, and monitoring.
- Change management: The tool must be practical for both IT-led reporting and broader business consumption.
For enterprises with strict reporting requirements, the strongest data warehouse reporting tools are the ones that balance governance with usability, rather than optimizing only for ad hoc analytics.
FineReport vs Power BI vs Tableau at a glance
Before diving into detailed comparison points, it helps to understand how these three platforms are positioned in practice.
FineReport

- One-sentence overview: FineReport is an enterprise reporting platform designed for complex formatted reports, dashboard delivery, and large-scale operational reporting tied to data warehouses and business systems.
- Key Features:
- Pixel-perfect report design
- Dashboard development
- Scheduled batch distribution
- Broad database and warehouse connectivity
- Role-based permissions and enterprise deployment options
- Pros & Cons:
- Pros: Strong for fixed-format reporting, print-ready outputs, and operational distribution; good fit for organizations needing strict layout control
- Cons: Less universally familiar than some Western BI brands; analyst communities may be smaller depending on region
- Best For: Enterprises that need standardized reporting, finance-grade layouts, regulatory outputs, and high-volume recurring distribution
Power BI
- One-sentence overview: Power BI is Microsoft’s BI platform focused on self-service analytics, semantic modeling, and enterprise dashboarding within the Microsoft ecosystem.
- Key Features:
- Strong Microsoft integration
- Semantic models and DAX
- Interactive dashboards
- Cloud service distribution
- Excel, Teams, and Azure compatibility
- Pros & Cons:
- Pros: Broad adoption, strong ecosystem fit, good self-service potential, cost-effective entry point in many Microsoft environments
- Cons: Print-perfect reporting is less central to the platform; licensing and governance can become more complex at scale
- Best For: Organizations standardized on Microsoft 365, Azure, Excel, and Teams that want broad business adoption of self-service BI
Tableau

- One-sentence overview: Tableau is a visual analytics platform known for rich exploratory analysis, data storytelling, and interactive dashboards for business users and analysts.
- Key Features:
- Advanced visual exploration
- Interactive dashboards
- Flexible data connectivity
- Strong presentation-oriented design
- Analyst-friendly discovery workflows
- Pros & Cons:
- Pros: Excellent visual experience, strong exploratory analytics, high-quality dashboard storytelling
- Cons: Can be expensive at enterprise scale; may require additional effort for highly structured reporting governance
- Best For: Enterprises prioritizing analyst-led discovery, executive storytelling, and presentation-quality interactive dashboards
Positioning and deployment fit
At a high level:
- FineReport is strongest where enterprise reporting is document-heavy, operational, repeatable, and format-sensitive.
- Power BI is strongest where semantic modeling and self-service adoption are central, especially in Microsoft-centered organizations.
- Tableau is strongest where business value comes from visual exploration and analytical storytelling.
Biggest trade-offs decision-makers should expect
The main trade-offs are straightforward:
- If you need pixel-perfect and scheduled enterprise reporting, FineReport often has an advantage.
- If you need broad self-service BI in a Microsoft environment, Power BI is often the practical frontrunner.
- If you need high-quality visual exploration and executive-facing dashboards, Tableau often stands out.
Few enterprises need only one reporting style. That is why the real selection process should map platform strengths to actual workload mix rather than vendor positioning alone.
Feature-by-feature comparison across enterprise reporting priorities
# Data connectivity and warehouse integration
All three tools connect to modern data platforms, but the depth of enterprise reporting support depends on how they handle warehouse scale, schema complexity, and mixed environments.
FineReport
- One-sentence overview: FineReport is designed to connect warehouse and operational data sources for enterprise report production, especially where formatted outputs depend on multiple systems.
- Key Features:
- Connectivity to common relational databases and warehouse environments
- Support for hybrid enterprise architectures
- Ability to build reports across multiple business systems
- Data preparation and parameter-driven reporting logic
- Pros & Cons:
- Pros: Practical for organizations that need warehouse reporting plus integration with operational systems; useful for cross-source enterprise reporting
- Cons: The semantic modeling layer is usually less discussed than in self-service BI-focused platforms
- Best For: Teams building standardized reports from warehouses plus ERP, finance, manufacturing, or other enterprise systems
Power BI
- One-sentence overview: Power BI offers strong warehouse connectivity, especially for Microsoft-native and cloud-centric environments, with flexible support for import, DirectQuery, and composite models.
- Key Features:
- Connectors for major cloud and on-prem sources
- Strong Azure and Microsoft Fabric alignment
- Import mode, DirectQuery, and hybrid modeling options
- Shared semantic models
- Pros & Cons:
- Pros: Strong ecosystem compatibility, reusable modeling, and broad support for enterprise warehouse scenarios
- Cons: Performance and model design can become complex with large, highly detailed, or loosely governed deployments
- Best For: Organizations centralizing reporting on Azure, SQL Server, Synapse, Fabric, or mixed Microsoft-centric environments
Tableau
- One-sentence overview: Tableau supports a wide range of warehouse connections and is effective for analysts who need flexible access to large datasets for visual analysis.
- Key Features:
- Live and extract-based connectivity
- Broad source coverage
- Visual-first exploration on warehouse data
- Cross-source analytical workflows
- Pros & Cons:
- Pros: Good flexibility for analysts and strong support for interactive data exploration
- Cons: Enterprise standardization can require more governance discipline, especially across many workbooks and teams
- Best For: Analyst-heavy environments using warehouses for exploration and dashboard storytelling
How they handle complex schemas and large datasets
For star schemas, fact tables, and dimensional reporting:
- Power BI tends to be strong where curated semantic models can be centrally managed.
- Tableau often works well for analyst exploration, but consistency depends more on workbook and data source governance.
- FineReport is especially relevant when the goal is not just exploring warehouse data, but turning it into formal operational or formatted report outputs.
If the warehouse is the analytical backbone but the business still needs recurring operational documents, this distinction becomes important.
Dashboard design, pixel-perfect reporting, and distribution
This is one of the clearest separation points among these tools.
FineReport
- One-sentence overview: FineReport is particularly strong in producing pixel-perfect reports, formatted dashboards, and scheduled distribution for enterprise operations.
- Key Features:
- Precise layout control
- Print-ready and paginated reports
- Parameterized templates
- Batch export and scheduled delivery
- Dashboard support for operational monitoring
- Pros & Cons:
- Pros: Excellent for finance, compliance, statements, forms, and recurring document-style reporting
- Cons: Less centered on open-ended visual storytelling than Tableau
- Best For: Enterprises needing consistent operational and regulatory reporting at scale
Power BI
- One-sentence overview: Power BI is strongest in interactive dashboards and KPI-driven reporting, with structured formatted reporting typically handled through adjacent Microsoft capabilities or design compromises.
- Key Features:
- Rich dashboard visuals
- Drill-through and filtering
- Cloud sharing and app distribution
- Integration with Microsoft collaboration tools
- Pros & Cons:
- Pros: Strong dashboarding for broad internal consumption; effective for management and departmental analytics
- Cons: Not naturally optimized for highly customized print-style enterprise documents within the core experience
- Best For: Teams prioritizing interactive dashboards over heavily formatted output
Tableau
- One-sentence overview: Tableau excels at polished, interactive dashboards and storytelling experiences, but it is less oriented toward pixel-perfect batch reporting.
- Key Features:
- Advanced visualization design
- Storytelling-oriented layouts
- Interactive filtering and navigation
- Strong executive presentation value
- Pros & Cons:
- Pros: Excellent for presentation-quality analytics and executive exploration
- Cons: Structured document-style reporting is not the platform’s main strength
- Best For: Organizations where visual communication and exploratory insight matter more than formal print-ready reporting
Support for finance, operations, and compliance formats
For finance and compliance teams, the reporting need is often less about visual discovery and more about consistency, reproducibility, and audit-friendly presentation.
In these scenarios:
- FineReport typically aligns best with fixed-format reporting requirements.
- Power BI can support operational dashboards well, but may not be the most natural fit for highly formatted scheduled documents.
- Tableau is strongest when the output is interactive and presentation-oriented rather than document-centric.
Governance, security, and administration
Enterprise reporting tools must protect data while enabling access across many teams.
FineReport
- One-sentence overview: FineReport provides enterprise administration and permission controls suitable for centralized reporting environments with strict output management.
- Key Features:
- Role-based access control
- Centralized report management
- Scheduled task administration
- Controlled template distribution
- Pros & Cons:
- Pros: Well-suited for standardized enterprise reporting governance and controlled distribution
- Cons: Broader self-service governance patterns may depend on how the organization structures report development roles
- Best For: Central BI or IT teams managing formal reporting across multiple departments
Power BI
- One-sentence overview: Power BI offers mature governance options, especially when paired with Microsoft identity, compliance, and workspace administration capabilities.
- Key Features:
- Row-level security
- Workspace governance
- Microsoft Entra integration
- Auditability and admin controls
- Shared semantic model management
- Pros & Cons:
- Pros: Strong identity integration, scalable governance options, and good fit for enterprise access control
- Cons: Governance can become fragmented if workspaces, datasets, and reports proliferate without strong operating standards
- Best For: Large Microsoft-centered organizations with existing identity and compliance frameworks
Tableau
- One-sentence overview: Tableau supports enterprise security and administration, but governance discipline is especially important when scaling distributed analytics use.
- Key Features:
- Permission management
- Server and cloud administration
- Data source governance
- User and content auditing
- Pros & Cons:
- Pros: Solid enterprise controls with flexible deployment options
- Cons: Governance overhead may increase as decentralized analytics publishing expands
- Best For: Organizations with experienced analytics teams and formal governance processes
Governance without blocking business users
A successful reporting platform should not force enterprises to choose between control and usability.
- Power BI often handles this balance well through shared semantic models and Microsoft admin controls.
- Tableau can support it effectively, but usually requires strong governance operating models.
- FineReport is especially effective when the enterprise wants high control over official reporting outputs rather than a broad publish-anything self-service culture.
Performance, scalability, and maintenance
At enterprise scale, performance is not only technical. It affects trust, support burden, and adoption.
FineReport
- One-sentence overview: FineReport is built for reliable large-scale report generation, especially where scheduled jobs, formatted documents, and enterprise distribution are central.
- Key Features:
- Enterprise report scheduling
- Batch generation
- Multi-user delivery
- Architecture suited for recurring formal reporting
- Pros & Cons:
- Pros: Strong fit for operational reliability and recurring report workloads
- Cons: Interactive exploratory workloads are not its core differentiator compared with Tableau
- Best For: High-volume recurring reporting environments
Power BI
- One-sentence overview: Power BI can scale effectively in enterprise settings, but performance depends heavily on model design, capacity planning, and query strategy.
- Key Features:
- In-memory modeling
- DirectQuery and composite approaches
- Capacity-based scaling options
- Performance optimization tooling
- Pros & Cons:
- Pros: Strong scalability when well governed and properly architected
- Cons: Tuning efforts can rise significantly for complex models and mixed workload patterns
- Best For: Enterprises willing to invest in semantic model discipline and platform administration
Tableau
- One-sentence overview: Tableau delivers strong dashboard performance and analytical responsiveness, with scalability shaped by extract strategy, server design, and governance maturity.
- Key Features:
- Extract acceleration
- Live connectivity options
- Scalable server or cloud deployments
- Flexible workload support
- Pros & Cons:
- Pros: Strong interactive user experience and effective support for visual analytics at scale
- Cons: Maintenance can grow with workbook complexity and content sprawl
- Best For: Large analytics communities focused on dashboard exploration
Practical impact on support costs
Performance issues in enterprise reporting usually create hidden costs:
- More support tickets
- Duplicate extracts and reports
- User distrust in numbers
- Longer release cycles
- Greater admin overhead
That is why data warehouse reporting tools should be evaluated not only on benchmark speed, but also on how maintainable they remain after adoption expands.
Pros and cons of FineReport, Power BI, and Tableau
# FineReport: strengths and limitations
- One-sentence overview: FineReport stands out as a strong enterprise reporting option for organizations that need highly controlled, formatted, and large-scale report distribution.
- Key Features:
- Pixel-perfect report design
- High-volume scheduled delivery
- Enterprise-oriented layout control
- Dashboard and reporting combination
- Multi-source reporting support
- Pros & Cons:
- Pros:
- Excellent for standardized operational and regulatory reporting
- Strong layout precision for print-ready or document-style outputs
- Good fit for enterprises that need strict consistency across teams
- Useful when dashboards and formatted reports must coexist
- Cons:
- Less familiar to some analyst communities than Power BI or Tableau
- Learning curve may be higher for teams expecting a pure drag-and-drop self-service BI model
- Regional adoption and talent availability may vary by market
- Pros:
- Best For: Enterprises that prioritize formal reporting depth over broad exploratory self-service
For companies comparing data warehouse reporting tools primarily for compliance, operations, finance, or high-volume report distribution, FineReport deserves serious consideration. It fills a gap that many dashboard-led platforms do not fully address.
# Power BI: strengths and limitations
- One-sentence overview: Power BI is a strong choice for enterprises seeking scalable self-service BI, shared semantic models, and close alignment with Microsoft technologies.
- Key Features:
- Microsoft ecosystem integration
- Interactive dashboards
- DAX-based modeling
- Cloud service distribution
- Governance options for enterprise deployment
- Pros & Cons:
- Pros:
- Strong adoption potential across business teams
- Excellent fit for Excel, Teams, Azure, and Microsoft 365 users
- Good balance of dashboarding and governed analytics
- Robust semantic modeling capabilities
- Cons:
- Highly customized print reporting is not its strongest area
- Licensing and capacity planning can become complicated in large deployments
- Governance challenges can emerge if self-service expands faster than standards
- Pros:
- Best For: Large organizations that want broad BI usage with strong Microsoft alignment
# Tableau: strengths and limitations
- One-sentence overview: Tableau remains one of the strongest platforms for visual exploration, interactive storytelling, and analyst-led discovery on warehouse data.
- Key Features:
- Rich visual design
- Analyst-friendly exploration
- Interactive dashboards
- Strong storytelling capabilities
- Flexible data connectivity
- Pros & Cons:
- Pros:
- Excellent for executive-facing visuals and exploration
- Strong analytical flexibility for experienced users
- High-quality dashboard presentation
- Cons:
- Enterprise cost can be significant
- Governance overhead can increase with scale
- Less ideal for highly structured, document-style reporting
- Pros:
- Best For: Enterprises that value interactive analysis and visual communication over formal report formatting
Which tool fits specific enterprise scenarios best
Choosing among these platforms becomes easier when tied to actual reporting scenarios rather than generic feature lists.
# Best choice for standardized operational and regulatory reporting
When the requirement is fixed-format outputs, scheduled delivery, and strict consistency, FineReport is often the strongest fit.
- One-sentence overview: FineReport is the best match when enterprise reporting must follow exact structure, repeatable layout rules, and controlled large-scale distribution.
- Key Features:
- Pixel-perfect templates
- Batch scheduling
- Formal document output
- Operational and compliance-friendly report design
- Pros & Cons:
- Pros: Strong control over formatting and recurring distribution; suitable for regulated workflows
- Cons: Less focused on free-form exploration than Tableau or broad self-service culture than Power BI
- Best For: Finance, operations, government, manufacturing, and regulated enterprise reporting teams
If the organization’s reporting success depends on precision and repeatability, FineReport has a meaningful advantage over more dashboard-centric alternatives.
# Best choice for self-service BI in Microsoft ecosystems
When Microsoft integration becomes the deciding factor, Power BI is usually the practical choice.
- One-sentence overview: Power BI is the best fit for enterprises that want governed self-service analytics integrated with Microsoft productivity and cloud services.
- Key Features:
- Integration with Excel, Teams, Azure, and Microsoft security services
- Shared semantic models
- Broad business-user adoption patterns
- Interactive dashboard delivery
- Pros & Cons:
- Pros: Efficient fit for existing Microsoft investments; strong adoption pathway for business users
- Cons: Complex formatted reporting needs may require workaround thinking or adjacent tooling
- Best For: Microsoft-centered enterprises building broad internal BI adoption
# Best choice for advanced visual analytics and executive exploration
When the emphasis is interactive analysis and presentation-quality dashboards, Tableau often leads.
- One-sentence overview: Tableau is the strongest option when executives and analysts need highly visual, exploratory, and story-driven analytics experiences.
- Key Features:
- Rich visual design
- Flexible dashboard interaction
- Strong storytelling workflows
- Effective exploratory analytics
- Pros & Cons:
- Pros: Exceptional visual communication and exploration capability
- Cons: Less aligned to strict formatted enterprise reporting requirements
- Best For: Strategy teams, analytics centers of excellence, and executive dashboard programs
# How to choose based on architecture, team skills, and budget
A practical shortlist should be based on four factors:
1. Data warehouse setup
Ask:
- Are you primarily on Azure, SQL Server, or Microsoft Fabric?
- Do you run hybrid cloud and on-prem systems?
- Do reports require joins across operational and analytical systems?
- Are live queries, extracts, or scheduled snapshots more realistic?
Power BI often aligns naturally with Microsoft-heavy architecture.
FineReport often fits mixed enterprise application reporting with strong output control.
Tableau often suits analytics-led warehouse exploration.
2. Team skills and operating model
Ask:
- Are reports centrally built by IT or BI developers?
- Do business users need broad self-service?
- Is the organization strong in semantic modeling and governance?
- Do analysts prioritize visual exploration?
If reporting is centralized and controlled, FineReport becomes more attractive.
If self-service is a strategic objective, Power BI has an advantage.
If analysts and executives drive visual analytics demand, Tableau may be strongest.
3. Budget and licensing posture
Look beyond entry pricing and consider:
- Capacity or server costs
- Viewer scale
- Admin overhead
- Training burden
- Content maintenance
- Need for additional tools for paginated or formatted reporting
A lower initial cost does not always produce a lower long-term cost if reporting complexity forces architectural workarounds.
4. Long-term ownership costs
The best data warehouse reporting tools are not simply the cheapest to buy. They are the easiest to scale responsibly.
Review:
- How many report types the platform can realistically support
- Whether governance prevents duplication
- How often IT must intervene
- Whether formatting requirements can be met natively
- How performance tuning affects staffing needs
Final decision framework for enterprise buyers
For enterprise buyers, the comparison comes down to reporting depth, analytics flexibility, governance style, and total ownership cost.
The most important differences
- FineReport is strongest for complex formatted reporting, operational standardization, and scheduled distribution.
- Power BI is strongest for Microsoft-aligned self-service BI, semantic modeling, and broad business adoption.
- Tableau is strongest for visual analytics, dashboard storytelling, and analyst-driven exploration.
Simple selection checklist
Procurement, IT, and business stakeholders can use this short checklist:
- Do we need pixel-perfect, print-ready, or regulatory reports?
- Do we need broad self-service analytics across many business users?
- Are we deeply invested in the Microsoft ecosystem?
- Do executives prioritize interactive visual storytelling?
- How important are governance and standardized metric definitions?
- Will the platform need to support multi-source enterprise reporting beyond the warehouse?
- Can our team manage the administration and tuning effort required at scale?
- What is the true five-year cost of ownership, including training and maintenance?
Why a proof of concept matters
No enterprise should choose among data warehouse reporting tools based only on demos.
Run a proof of concept using:
- Real warehouse schemas
- Actual concurrency expectations
- Representative security rules
- A mix of executive dashboards, operational reports, and scheduled formatted documents
- Existing infrastructure and identity controls
This will quickly reveal whether the platform’s strengths match your reporting reality.
Final recommendation
If your enterprise needs strict, repeatable, document-style reporting with high layout control and scheduled distribution, FineReport should be on the shortlist and is often the better fit than dashboard-first tools. If your top priority is governed self-service BI in a Microsoft environment, choose Power BI. If visual exploration and executive storytelling drive the project, Tableau remains a strong option.
For many large organizations, the right answer is the platform that best supports the reporting workload that matters most. In that discussion, FineReport stands out as a serious enterprise contender rather than just an alternative.
FAQs
FineReport is usually the stronger fit when you need highly formatted, print-ready, or compliance-style documents with strict page layouts. Power BI and Tableau are typically better known for interactive dashboards than complex scheduled document output.
Both are strong for dashboarding, but the better choice often depends on your ecosystem, governance needs, and user skills. Power BI is often attractive in Microsoft environments, while Tableau is widely chosen for visual exploration and analyst-friendly interactivity.
Focus on scalability, semantic modeling, governance, security, performance, and long-term administration. In large organizations, these factors usually matter more than chart variety alone.
Yes, enterprise reporting platforms generally connect to warehouses, databases, and business systems across cloud and on-prem environments. The main difference is how well they handle governance, permissions, and operational reporting across those mixed sources.
Match the tool to the reporting workload rather than buying on popularity alone. FineReport suits structured operational and scheduled reporting, while Power BI and Tableau are often stronger choices for interactive BI and self-service analysis.


The Author
Yida Yin
FanRuan Industry Solutions Expert
Related Articles

ERP Reporting Explained: What It Is, How It Works, and Why Enterprise Teams Rely on It
ERP reporting is the process of turning data inside your enterprise resource planning system into usable business insight. For finance leaders, operations directors, supply chain managers, and IT teams, that matters beca
Yida Yin
Jun 25, 2026
8 Best Restaurant Reporting Software Tools for 2026: Compare FineReport, Toast, SpotOn & More
$1 is a highly customizable business intelligence and reporting platform that helps restaurants turn POS, labor, inventory, finance, and multi location data into real time dashboards and decision ready reports. 8 Best Re
Yida Yin
Jun 24, 2026

Database Reporting Architecture: When to Use a Reporting Database vs Your Operational System
$1 is not just about pulling data into a dashboard. It is an architecture decision that affects application performance, reporting speed, data trust, and how confidently your teams can make decisions. If you are an IT ma
Yida Yin
Jun 24, 2026