Marketing automation reporting gives enterprise marketing teams a repeatable way to prove impact, spot bottlenecks, and act faster without waiting for analysts to rebuild the same report every week. If you manage demand generation, marketing operations, RevOps, or executive reporting, the pain is familiar: disconnected campaign data, inconsistent KPI definitions, stale dashboards, and too much manual effort spent assembling updates instead of improving performance. A strong framework solves that by standardizing what gets measured, how it is visualized, who owns it, and how insights move into action.
 Click To Try The Dashboard
All reports in this article are built with FineReport
What a marketing automation reporting framework should include
Enterprise marketing teams do not need more charts. They need a reporting system that connects activity to business outcomes and removes ambiguity from decision-making. The purpose of marketing automation reporting is to help teams monitor lead flow, campaign quality, operational efficiency, and revenue impact in one governed structure.
Manual performance tracking usually depends on exports, spreadsheet stitching, and one-off definitions that change by stakeholder. Automated reporting is different. It continuously collects data from core systems, applies shared business logic, refreshes dashboards on schedule, and distributes the same trusted view to leadership, operations, and campaign teams. That reduces reporting lag and improves accountability.
A practical reporting framework should include five core building blocks:
- KPIs: The agreed measures of marketing performance, funnel health, and operational execution.
- Dashboards: Role-based visual views for executives, channel owners, and operations teams.
- Data sources: CRM, marketing automation platform, web analytics, ad platforms, event tools, and revenue systems.
- Governance: Standard definitions, naming conventions, access rules, and validation processes.
- Workflows: The routines for data refresh, exception handling, review meetings, and optimization follow-up.
Core elements of an enterprise marketing automation reporting framework
For large teams, reporting must support three outcomes:
- Faster decisions: Leaders can see trends, exceptions, and risks early.
- Cross-team visibility: Marketing, sales, content, and operations work from the same definitions.
- Campaign optimization: Teams can identify where automation improves conversion and where workflows create friction.
Key Metrics (KPIs)
Below is a structured KPI set that supports most enterprise marketing automation reporting programs:
- Inquiry Volume: Total new inbound responses, contacts, or raw leads entering the funnel.
- MQL Conversion Rate: Percentage of inquiries that meet marketing qualification criteria.
- SQL Conversion Rate: Percentage of MQLs accepted or advanced by sales.
- Opportunity Conversion Rate: Percentage of qualified leads that become pipeline opportunities.
- Customer Conversion Rate: Percentage of opportunities that close into customers.
- Email Open Rate: Share of delivered emails that were opened; useful for subject-line and audience resonance.
- Click-Through Rate (CTR): Share of recipients or viewers who clicked; indicates engagement depth.
- Form Submission Rate: Percentage of landing page visitors who complete a form.
- Landing Page Conversion Rate: Share of visitors who take the intended conversion action.
- Content Engagement Rate: Interactions with assets such as downloads, webinar views, or repeat visits.
- Sourced Pipeline: Pipeline directly created from marketing-originated programs.
- Influenced Pipeline: Pipeline touched by marketing during the buying journey.
- Closed-Won Revenue Influence: Revenue associated with marketing-assisted opportunities.
- Lead Response Time: Time between lead creation and first follow-up or routing action.
- Campaign Launch Velocity: Time required to build, approve, and activate campaigns.
- Reporting Accuracy Rate: Degree to which dashboard values match validated source data.
- Dashboard Freshness: Time since the latest successful refresh.
- SLA Adherence: Percentage of records or tasks handled within agreed service timelines.
The 7 KPIs that matter most in marketing automation reporting
Not every metric belongs on the first page of an executive dashboard. These seven KPIs are the most useful because they connect automation activity to funnel progression, engagement quality, pipeline creation, and operational reliability.
Funnel conversion and lead progression
Automation should move prospects forward, not just generate activity. That is why funnel progression metrics are foundational.
The most important KPI here is:
-
Inquiry-to-MQL conversion rate
This shows how effectively top-of-funnel demand becomes qualified interest. If it drops, the issue may be targeting, form quality, scoring rules, or campaign-message mismatch. -
MQL-to-SQL conversion rate
This reveals whether sales sees value in the leads marketing automation is producing. A gap here often points to lead scoring problems, weak qualification thresholds, or routing delays. -
SQL-to-opportunity conversion rate
This helps identify whether automated nurture and qualification programs are feeding real buying intent or just increasing lead volume.
Track movement from inquiry to MQL, SQL, opportunity, and customer to identify where automation improves lead flow and where it slows down.
Campaign engagement and response quality
Engagement metrics matter only when interpreted in context. High opens with low conversions can mean curiosity without buying intent. High clicks with poor pipeline may indicate low-quality traffic or weak post-click experience.
The most useful engagement KPI in marketing automation reporting is:
- Engagement quality score
This combines email clicks, form completions, landing page conversion, and meaningful content interaction into a more business-relevant view than surface metrics alone.
Use supporting signals such as:
- Email opens
- Click-through rate
- Form submissions
- Landing page conversion
- Asset downloads
- Webinar attendance
- Repeat engagement from target accounts
The key is to compare high-volume engagement against stronger buying signals. Enterprise teams should avoid over-optimizing vanity metrics when downstream conversion tells a different story.
Pipeline contribution and revenue influence
Marketing automation reporting must reach beyond campaign execution. Leaders want to know what automation contributes to pipeline and revenue.
The central KPI here is:
- Marketing-sourced and influenced pipeline
This measures pipeline created directly by automated programs and pipeline affected by them across the journey.
This KPI should be split carefully:
- Channel performance: Which acquisition channels bring qualified leads
- Workflow performance: Which nurture, scoring, routing, and follow-up automations improve conversion
- Revenue influence: Which programs appear consistently in closed-won journeys
Separating channel performance from workflow performance is critical. Paid search may create demand, but nurture automation may be what turns that demand into pipeline.
Speed, efficiency, and reporting reliability
Good reporting frameworks also track how quickly and reliably the system operates. If the process is slow or untrusted, teams stop using it.
The final must-have KPIs are:
-
Lead response time
Slow routing or delayed follow-up lowers conversion before sales even engages. -
Dashboard freshness and reporting accuracy
If dashboards are stale or inconsistent with source systems, confidence drops and teams revert to manual reporting.
You can also monitor:
- Campaign launch velocity
- Sync failure rates
- SLA adherence
- Data completeness
- Attribution coverage
These operational KPIs reduce delays, improve trust, and keep the reporting layer usable for the business.
How to structure dashboards for enterprise teams
The best marketing automation reporting dashboards are not generic. They are designed around decisions. Each audience should see what it needs to act, without losing consistency in definitions.
Executive dashboard
An executive dashboard should summarize business impact in seconds. It should focus on outcomes, trend shifts, and areas requiring intervention.
Include:
- Pipeline sourced and influenced by marketing
- Funnel conversion rates by stage
- Revenue contribution trends
- Top-performing programs
- Underperforming segments or regions
- Month-over-month and quarter-over-quarter changes
Executives do not need channel-level noise first. They need strategic exceptions and a fast path to drill-down analysis.
Channel and campaign dashboard
This dashboard helps demand generation and campaign teams explain changes in results. It should break down performance by channel and campaign type.
Include views for:
- Paid media
- Organic and web
- Events and webinars
- Nurture tracks
- ABM programs
Key fields should cover spend, response, conversions, MQLs, influenced opportunities, and performance by audience segment.
This is where teams connect campaign activity to the mid-funnel impact that executives care about.
Operations and workflow dashboard
Marketing operations teams need a dashboard built for diagnosis, not presentation. This view should surface process failures before they distort executive reports.
Track:
- Data quality issues
- CRM sync failures
- Duplicate records
- Missing attribution fields
- Routing delays
- SLA adherence
- Refresh failures
- Manual override frequency
A well-designed operations dashboard shortens time to resolution and protects trust in the reporting system.
Team-specific reporting views
Different teams use the same data differently. Leadership, content, sales operations, and regional teams all need role-based relevance without changing KPI definitions.
Useful team-specific views include:
- Leadership: outcomes, trends, risk indicators
- Demand generation: campaign and segment performance
- Content team: asset engagement, conversion support, content-to-pipeline influence
- Sales operations: lead routing, acceptance, follow-up timing
- Regional teams: geo-level performance with standardized benchmarks
The goal is simple: standardize definitions centrally, then tailor views locally.
Workflow steps to automate marketing reports from setup to review
A strong dashboard is only the visible layer. Real reporting maturity comes from the workflow behind it. Below is the implementation path I recommend for enterprise teams.
Align goals, questions, and reporting owners
Start with business questions, not tool features. Ask:
- Which decisions should this reporting improve?
- Which teams will use it weekly versus monthly?
- Which KPIs are decision-driving versus informational?
- Who owns each metric, source, and review process?
Assign ownership for:
- Data inputs
- KPI definitions
- Validation checks
- Dashboard maintenance
- Review cadence
- Follow-up actions
Without clear ownership, automated reporting becomes unmanaged reporting.
Connect data sources and standardize definitions
Next, map the systems that feed your reports:
- CRM
- Marketing automation platform
- Web analytics
- Ad platforms
- Event systems
- Revenue or ERP data where needed
Then standardize:
- Campaign naming conventions
- Funnel stage definitions
- Attribution rules
- Time windows
- Regional rollups
- Revenue logic
This is where many projects fail. If teams disagree on what counts as an MQL or influenced opportunity, the dashboard will never become a trusted source of truth.
Build templates, automate delivery, and validate outputs
Once the model is stable, build repeatable dashboard templates for each stakeholder group. This avoids redesigning reports every cycle.
Best practices:
-
Create standard layouts by audience
Executive, channel, operations, and team-specific templates should follow the same visual logic. -
Schedule refresh and distribution
Set daily, weekly, or monthly delivery depending on decision needs. -
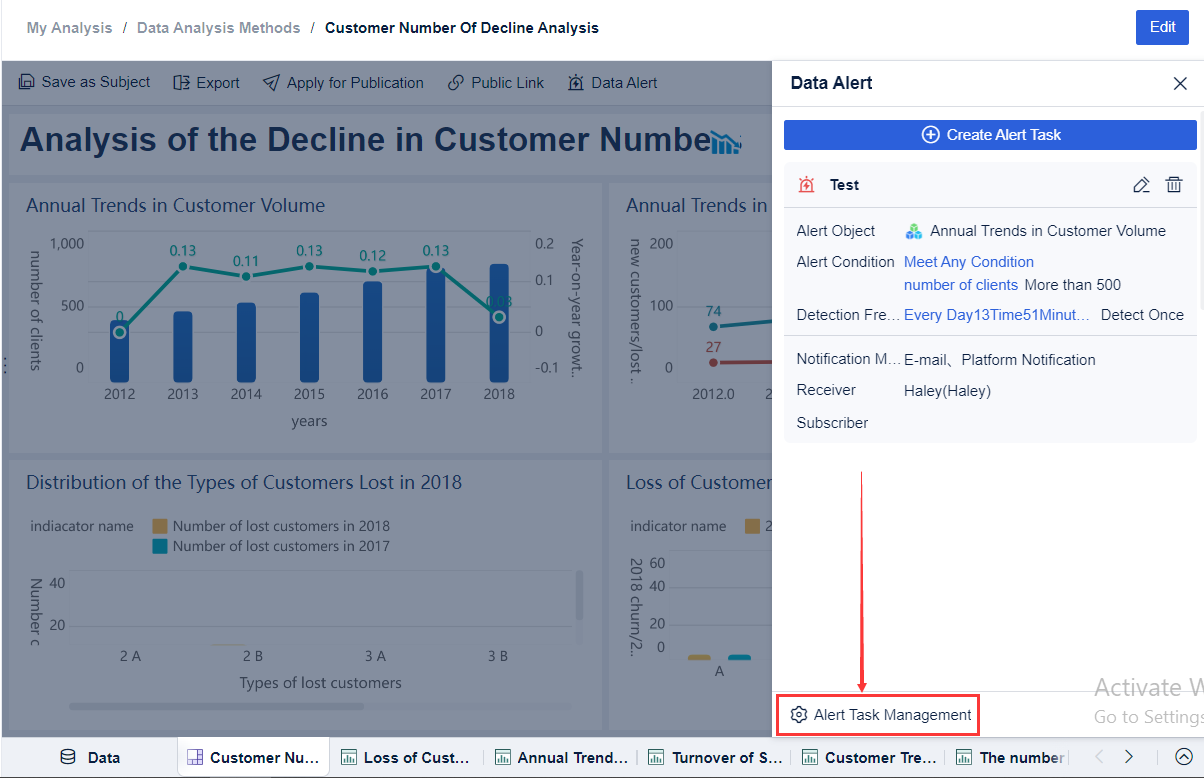
Use alerts for anomalies
Flag drops in conversion, stale refreshes, sync failures, or abnormal traffic spikes. -
Validate against source systems regularly
Even automated reports need periodic reconciliation. -
Version-control KPI definitions
When business logic changes, update documentation and dashboard labels together.
These steps reduce rework, improve consistency, and make marketing automation reporting scalable.
Review insights and improve the system over time
The final step is where reporting creates business value. Reports should not end in inboxes. They should trigger action.
Use a regular review cadence to answer:
- What changed?
- Why did it change?
- What action should we take?
- What should we test next?
- Which workflow rules need adjustment?
Audit your framework quarterly:
- Are KPIs still tied to business decisions?
- Are any dashboards underused?
- Are attribution assumptions still fit for purpose?
- Do teams trust the data?
- Are alerts generating useful intervention?
This closes the loop between reporting and optimization.
Tools, templates, and practical ways to get started
Choosing the right tooling matters because enterprise reporting complexity grows quickly. Data connectors, governance, permissions, refresh reliability, and role-based dashboards are no longer optional once you scale across channels and regions.
What to look for in automated marketing reporting tools
Evaluate tools against four priorities:
- Integration depth: Can the platform connect to CRM, marketing automation, analytics, and ad systems cleanly?
- Customization: Can teams build executive and operational dashboards without forcing one rigid layout?
- Governance controls: Are permissions, definitions, and refresh monitoring manageable at scale?
- Ease of use: Can business users maintain and consume dashboards without relying on technical teams for every change?
Also match the platform to enterprise realities such as reporting frequency, number of stakeholders, regional complexity, and in-house data skills.
Sample dashboard templates and reporting cadences
A practical rollout usually starts with three templates:
- Weekly performance snapshot: Fast review of lead flow, campaign engagement, response times, and key exceptions
- Monthly executive summary: Pipeline impact, major trends, conversion movement, and strategic risks
- Quarterly trend review: Cross-period funnel analysis, attribution insights, and operational maturity improvements
These templates reduce rework and keep stakeholders aligned on format and expectations.

Common challenges and how teams solve them
Most enterprise teams hit the same roadblocks:
-
Fragmented data
Fix with a shared data model and connector strategy. -
Inconsistent attribution
Fix with explicit attribution rules, visible assumptions, and stakeholder training. -
Unclear ownership
Fix with a reporting RACI and review calendar. -
Low dashboard adoption
Fix by designing role-specific views and showing decisions, not just data. -
Trust issues in reporting
Fix with refresh timestamps, audit checks, and source-to-dashboard validation routines.
Building this manually is complex; use FineReport to utilize ready-made templates and automate this entire workflow.
If your team is still combining spreadsheets, exporting platform reports, and manually formatting executive decks, you are paying a hidden tax in time, inconsistency, and decision delay. FineReport helps enterprise teams centralize marketing automation reporting, build governed dashboards faster, and deploy repeatable templates across leadership, campaign, and operations use cases.
It is especially valuable when you need:
- Multi-source dashboard integration
- Enterprise-grade permissions and governance
- Flexible template design
- Scheduled distribution and refresh
- Cross-team reporting standardization

Get Ready-to-Use Dashboard Templates in Fine Gallery
Instead of building every reporting layer from scratch, you can use FineReport to accelerate deployment, improve trust in data, and turn reporting into an operational advantage.
For enterprise decision-makers, that means less time managing report production and more time improving pipeline performance.
FAQs
It is a structured system for tracking marketing performance with standardized KPIs, dashboards, data sources, governance rules, and review workflows. Its purpose is to reduce manual reporting and help teams make faster, more consistent decisions.
The most useful KPIs are the ones that connect automation activity to funnel movement, engagement, pipeline, and operational reliability. Common priorities include inquiry-to-MQL conversion, MQL-to-SQL conversion, sourced pipeline, revenue influence, lead response time, SLA adherence, and dashboard freshness.
Refresh frequency depends on campaign speed and stakeholder needs, but most enterprise teams use daily or near-real-time updates for operational views and scheduled summaries for executives. The key is to keep dashboards current enough for action without creating unnecessary noise.
Start by connecting CRM, marketing automation, analytics, ad, and revenue systems into one governed reporting model. Then align KPI definitions, naming conventions, and validation checks so every dashboard reflects the same trusted logic.
Reports usually break down because of disconnected data sources, inconsistent metric definitions, weak governance, or failed refresh processes. Manual spreadsheet work and unclear ownership also make errors more likely and slow down decision-making.


The Author
Yida Yin
FanRuan Industry Solutions Expert
Related Articles

Financial Reporting Valuation Explained: A Practical Guide to ASC 820, ASC 805, ASC 350, and ASC 718
$1 valuation is the process companies use to measure assets, liabilities, equity instruments, and reporting units for compliant $1. For CFOs, controllers, finance directors, and audit facing accounting teams, the challen
Yida Yin
Jun 25, 2026

Best Ad Reporting Tool in 2026: 8 Options Compared for Marketers and Analysts
$1 is an $1 and dashboard platform that helps teams unify ad data, build highly customized reports, and automate distribution at scale. 8 ad reporting tool options compared 1. DashThis One sentence overview: DashThis is
Yida YIn
Jun 25, 2026
Office 365 Reporting Tool Guide: Track Usage, Security, and License Waste in One Dashboard
An office 365 $1 should do more than generate static usage charts. For IT managers, operations leaders, and Microsoft 365 administrators, the real value is operational visibility: who is actually using the platform, wher
Yida Yin
Jun 25, 2026