What is an ecommerce analytics dashboard? An ecommerce analytics dashboard is a digital tool that brings together your sales, customer, and inventory data into one visual display. You can track performance, spot trends, and gain actionable insights to make better business decisions.
Understanding and using an ecommerce analytics dashboard helps you respond quickly to changes in your store. For example, you can identify sales trends, adjust inventory, and improve customer satisfaction. Studies show that businesses using dashboards see greater efficiency, save time, avoid negative outcomes, and achieve higher profitability.
Benefit
Description
Greater efficiency
Dashboards let you interpret complex data quickly.
Saved time
You view all your data in one place, reducing manual effort.
Avoiding negative outcomes
Monitoring key metrics helps prevent issues that could harm customer satisfaction.
Higher profitability
Focusing on the right KPIs helps you find ways to boost profits.
You may wonder what an ecommerce analytics dashboard is, why it matters, and how it can help you make smarter decisions. This guide will answer your questions and show you the value it can bring to your ecommerce business.
Ecommerce Analytics Dashboard Overview
What is an Ecommerce Analytics Dashboard
What is anecommerce analytics dashboard? An ecommerce analytics dashboard is a centralized digital platform that collects, organizes, and visualizes your ecommerce data in real time. You can use it to monitor sales, track customer behavior, and manage inventory, all from one place. This tool helps you turn raw data into actionable insights, making it easier to understand your business performance and make informed decisions.
You will find that anecommerce analytics dashboard brings together information from multiple sources, such as your online store, marketing channels, and customer databases. This unified view allows you to see the big picture and quickly identify trends or issues. You can track key metrics, compare results over time, and respond to changes in your business environment with confidence.
Online retailers use different types of ecommerce dashboard to focus on specific business needs. The most common types include:
Dashboard Type
Purpose
Marketing Dashboard
Monitor ad performance, channel attribution, campaign ROAS, cost per click (CPC), and CAC.
Sales Dashboard
Track sales performance, revenue trends, and conversion rates.
Customer Analytics
Analyze customer behavior, retention rates, and lifetime value (LTV).
Each ecommerce dashboard type provides a unique perspective, helping you optimize marketing, sales, and customer engagement strategies.
An ecommerce dashboard offers a range of features that help you manage your business more effectively. You can expect the following core components in a standard ecommerce dashboard:
You can connect your ecommerce dashboard to platforms like Shopify, Amazon, social media, and Google Analytics. This integration allows you to aggregate data from different sources and display key performance indicators (KPIs) in one place. You can diagnose problems, spot opportunities, and save time by avoiding manual data collection.
Advanced ecommerce dashboard solutions stand out with features that go beyond basic reporting. The table below highlights what you can expect from a modern e-commerce dashboard:
Feature
Description
Real-time analytics
Provides immediate insights into current performance, allowing for timely decision-making.
Comprehensive insights
Offers a holistic view of various metrics, enabling deeper analysis of business performance.
Advanced tracking capabilities
Tracks user behavior and sales trends in detail, facilitating targeted marketing and inventory management.
Predictive analytics
Uses historical data to forecast future trends, aiding in strategic planning and inventory control.
Fraud detection
Identifies patterns of fraudulent activity, helping to mitigate risks and protect financial assets.
Enhanced reporting capabilities
Allows for detailed reporting over time, helping businesses to analyze trends and make informed decisions.
Customizable functions in your ecommerce dashboard let you tailor the display and analysis to your unique needs. You can set up interactive features, filter data, and create reports that match your business goals. Real-time data integration ensures you always have the latest information, so you can make decisions quickly and confidently.
Recent trends in ecommerce dashboard technology include AI integration for forecasting, real-time data access, and user-friendly interfaces. You can also benefit from mobile-first dashboards, which let you monitor your business from any device. Personalized experiences and social commerce features are becoming more important, as buyers expect tailored recommendations and seamless shopping across platforms.
An ecommerce analytics dashboard gives you a unified view of your fragmented data, real-time insights, and minimal manual effort. You can track ROI daily and link marketing campaigns directly to revenue. This makes your ecommerce dashboard an essential tool for driving growth and staying competitive in the fast-changing world of online retail.
Why Ecommerce Analytics Dashboard Matters
What is anecommerce analytics dashboard? An ecommerce analytics dashboard is a digital platform that collects, organizes, and displays your e-commerce business data in real time. You use it to monitor sales, customer behavior, and inventory, helping you make informed decisions and drive growth.
You rely on an ecommerce analytics dashboard to bring together information from multiple sources. This tool gives you a unified view of your e-commerce business, allowing you to track key metrics, spot trends, and respond quickly to changes in the market.
Business impact and benefits
An ecommerce analytics dashboard transforms how you manage your e-commerce business. You gain a clear understanding of your operations, which leads to better performance and higher profitability. You can see how your marketing efforts connect to sales and identify areas for improvement.
You useecommerce analytics to measure important KPIs that drive your business forward. The table below shows how these dashboards help you increase revenue and reduce costs:
KPI Category
Description
Acquisition
Metrics that assess how effectively new customers are being attracted and the associated costs.
Engagement
Measures user interaction with content and brand after they arrive on the site.
Revenue
Metrics that link marketing efforts directly to sales and profitability.
You can track conversion rate, customer acquisition cost, and engagement levels. These metrics help you understand what works and what needs adjustment. When you monitor these KPIs, you make data-driven decisions that improve your e-commerce business.
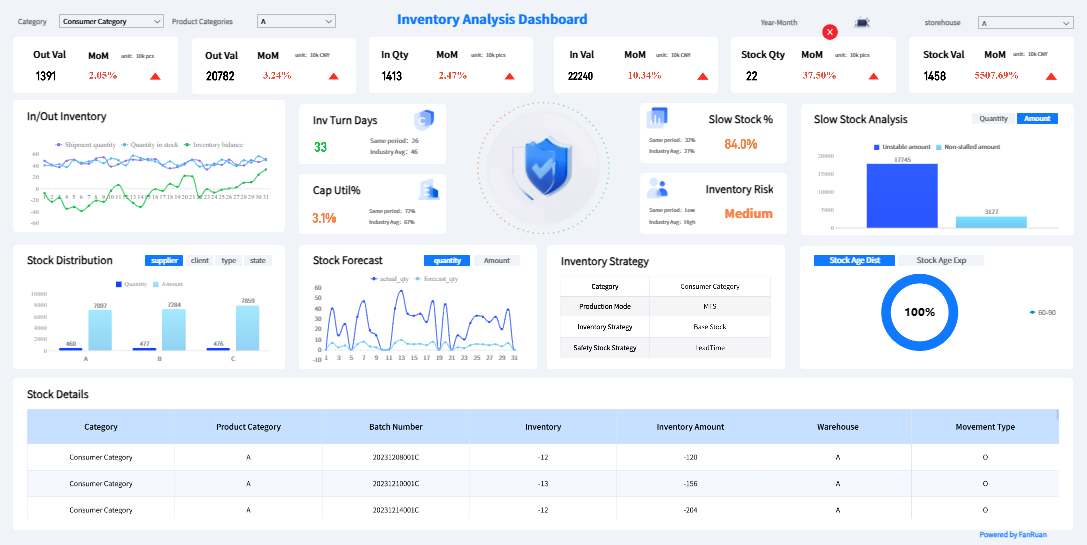
Ecommerce analytics dashboards also help you identify and address operational inefficiencies. You can use the following metrics to optimize your processes:
Metric
Benefit
Inventory Turnover Rate
Optimizes logistics and supply chain efficiency
Order Fulfillment Rate
Enhances customer satisfaction and reduces delays
Return Rate
Identifies product issues and improves quality control
You can see where delays happen, which products have high return rates, and how well your supply chain performs. This insight allows you to take action quickly and improve your overall efficiency.
Many e-commerce businesses have seen strong results from using analytics dashboards. For example, companies have achieved 20% year-over-year growth and increased unassisted revenue by 75%. They also use custom pages of website analytics to track performance and make better decisions.
You can achieve similar results by focusing on the right metrics and using your dashboard to guide your strategy.
Real-time Insights For Ecommerce
Real-time insights play a critical role in the success of your e-commerce business. You need to react quickly to changes in customer behavior, market trends, and operational challenges. An ecommerce analytics dashboard gives you up-to-the-minute data, so you never miss an opportunity.
A multinational consumer goods company used a centralized dashboard to monitor sales, inventory, and financial data. This approach allowed them to respond quickly to market changes, which led to increased revenue and improved efficiency. You can apply the same strategy to your e-commerce business.
Real-time insights from your dashboard help you in several ways:
You make decisions quickly, minimizing delays.
You enable smarter, data-driven decision-making at the right time.
You monitor workflows and performance metrics, allowing your team to identify issues and act fast.
You reduce costs by streamlining operations.
You track customer interactions and respond to problems, which leads to higher satisfaction.
You personalize services and predict future buying behavior.
You monitor ecommerce trends almost instantly and optimize the checkout process by analyzing metrics like conversion rate and cart abandonment.
When you convert complex data sets into clear visuals, you gain valuable insights into customer behavior and product performance. This enables you to optimize your operations and improve your conversion rate. Real-time analytics also allow you to refine your marketing strategies and personalize customer interactions, which increases loyalty and sales.
You rely on ecommerce analytics dashboards to support data-driven decision-making. These tools give you the power to act on insights as soon as they appear, keeping your e-commerce business agile and competitive.
Essential Metrics in Ecommerce Analytics Dashboard
What is an ecommerce analytics dashboard? An ecommerce analytics dashboard is a digital platform that brings together your sales, customer, and inventory data into one visual interface. You use this tool to track performance, analyze trends, and gain insights that help you make better business decisions. With an ecommerce analytics dashboard, you can see all your important metrics in real time and respond quickly to changes in your business.
You need to understand the relevant metrics that drive your e-commerce dashboard. These metrics give you a clear view of your store’s health and help you set goals for growth. By focusing on the right data, you can improve your ecommerce analytics strategy and make smarter choices.
Sales, Customers, and Inventory
You track several sales metrics in your e-commerce dashboard to measure performance and guide your strategy. Common sales metrics include:
Marketing Qualified Leads (MQLs)
Sales Qualified Leads (SQLs)
Conversion Rate
Customer Acquisition Cost (CAC)
Sales by Referrer
Average Order Value (AOV)
You also monitor customer and inventory metrics to shape your business strategy. The table below shows how these metrics influence your decisions:
Metric Type
Influence on Business Strategy
Customer Metrics
Enable data-driven decision-making, optimize marketing efforts, and improve customer experience.
Inventory Metrics
Enhance operational efficiency and help identify trends and anomalies for proactive issue resolution.
A strong e-commerce dashboard should be part of your daily operations. Assign clear ownership of metrics to ensure accountability. Regular reviews of these metrics can lead to actionable insights and experiments that drive growth.
You rely on your e-commerce dashboard to track essential KPIsthat measure your store’s success. These KPIs include:
Sales Growth
Conversion Rate
Average Order Value (AOV)
Customer Lifetime Value (CLV)
Customer Acquisition Cost (CAC)
Cart Abandonment Rate
Customer Retention Rate
You use these KPIs to set and track performance goals. For example, you might aim to boost sales by 10% in the next quarter or increase your conversion rate by 2% over the next year. The table below shows how you can align goals with relevant metrics:
Goal
KPI Examples
Boost sales 10% in the next quarter
Daily sales, Conversion rate, Site traffic
Increase conversion rate 2% in the next year
Conversion rate, Cart abandonment rate, Pricing
Grow site traffic 20% in the next year
Site traffic, Traffic sources, Click-through rates
Reduce customer service calls by half
Service call classification, Pages visited before call
You gain valuable insights from your e-commerce dashboard by tracking these KPIs. This approach helps you refine your ecommerce analytics strategy and make data-driven decisions that support long-term growth.
Implementing an Ecommerce Analytics Dashboard With FineReport
What is an ecommerce analytics dashboard? An ecommerce analytics dashboard is a digital platform that brings together your sales, customer, and inventory data into one interactive view. You use this tool to monitor business performance, analyze trends, and gain insights that help you make informed decisions. With an ecommerce analytics dashboard, you can track key metrics in real time and respond quickly to changes in your e-commerce environment.
You rely on an ecommerce dashboard to unify fragmented data from multiple sources. This tool helps you visualize sales, customer behavior, and inventory levels in a single place. You gain actionable insights that drive better business outcomes. An ecommerce dashboard also supports your analytics strategy by making complex data easy to understand and use.
Integration and Customization
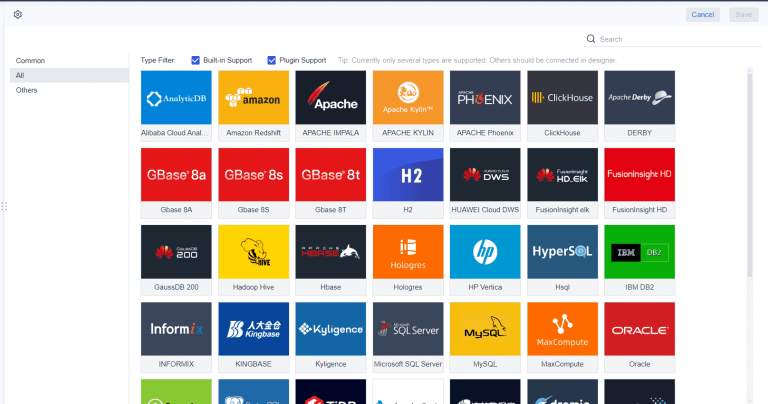
When you implement an e-commerce dashboard, integration and customization are essential. You need a solution that connects to your sales platforms, marketing tools, and inventory systems. FineReportoffers robust integration capabilities, allowing you to connect data from various sources such as databases, spreadsheets, and cloud services. You can use its drag-and-drop interface to design your ecommerce dashboard without coding. This flexibility lets you customize layouts, charts, and reports to match your business needs.
FineReport supports multi-source integration, so you can combine data from your e-commerce store, CRM, and ERP systems. You can also access your ecommerce dashboard on any device, including mobile phones and tablets. This mobile accessibility ensures you always have real-time insights at your fingertips. With FineReport, you can tailor your dashboard to display the analytics and metrics that matter most to your business.
To get the most value from your e-commerce dashboard, follow best practices for analytics and insights. Start by defining clear goals and selecting relevant metrics. Assign responsibility for each metric to ensure accountability. Regularly review your ecommerce dashboard to identify trends and take action.
You may face challenges such as data silos, inconsistent metrics, or integration issues. FineReport helps you overcome these obstacles with its centralized platform and customizable features. You can standardize KPIs, automate data updates, and ensure data accuracy. Use interactive filters and drill-down options to explore your analytics in depth. By following these best practices, you turn your ecommerce dashboard into a powerful tool for driving growth and improving decision-making.
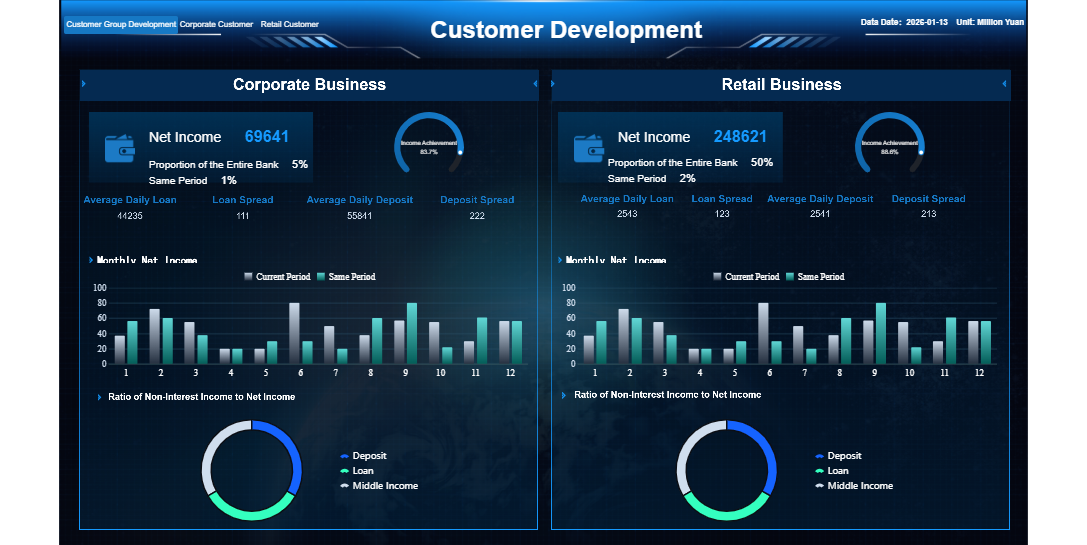
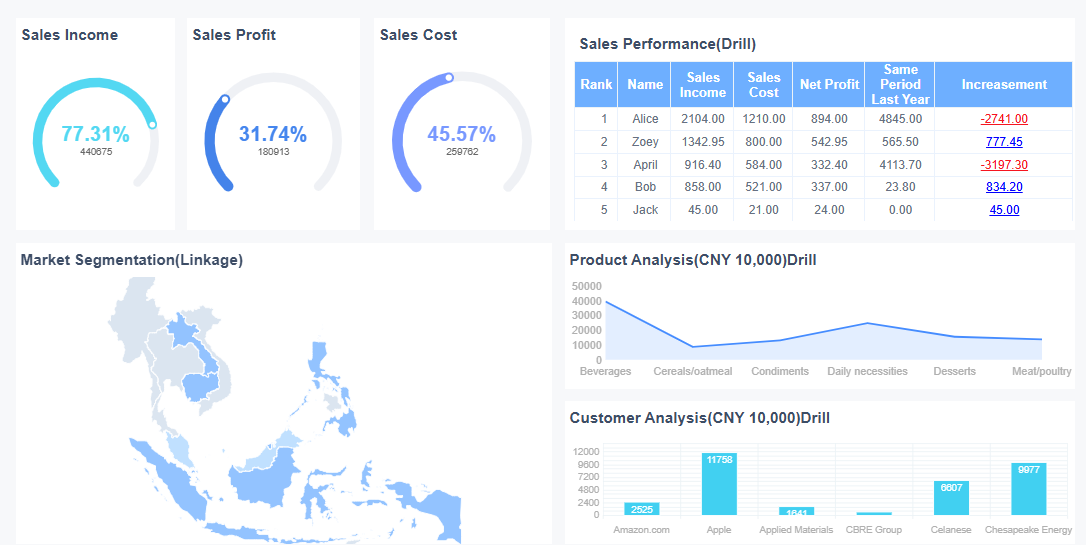
FineReport'sMultiple Built-in Charts For Visualization
Ecommerce analytics dashboards play a crucial role in your business success. You gain a unified view of performance metrics, optimize marketing, and improve customer retention. These dashboards help you analyze customer journeys, identify friction points, and enhance conversion rates. You also benefit from real-time data, predictive analytics, and better inventory management. Consider exploring solutions like FineReportto streamline your analytics and drive smarter decisions. Start by evaluating your current dashboard tools and look for ways to improve your data strategy.
Continue Reading About Ecommerce Analytics Dashboard
Access a wealth of case studies, industry insights, and solution guides to accelerate digital transformation.
FAQ
What is an ecommerce analytics dashboard?
An ecommerce analytics dashboard is a digital platform that displays your sales, customer, and inventory data in one place. You use it to track performance, analyze trends, and make informed decisions for your online store.
How do you connect your data sources to an ecommerce analytics dashboard?
You link your ecommerce analytics dashboard to platforms like Shopify, Amazon, or Google Analytics. Most dashboards offer built-in connectors or simple setup guides to help you integrate your sales, marketing, and inventory data.
Can you customize the metrics shown on your ecommerce analytics dashboard?
You can customize your ecommerce analytics dashboard to display the metrics that matter most to your business. You choose which KPIs, charts, and reports appear, making the dashboard fit your unique needs.
Why should you use an ecommerce analytics dashboard for your business?
You use an ecommerce analytics dashboard to gain real-time insights, improve decision-making, and boost efficiency. The dashboard helps you spot trends, optimize marketing, and manage inventory, leading to better business outcomes.