What is a project portfolio dashboard? You use it to centralize all your project data in one place. This powerful tool gives you real-time visibility into project status, resource allocation, and strategic alignment. Organizations rely on project portfolio dashboards to make better decisions and improve transparency. Leaders can act faster and spot problems quickly with dynamic visuals and integrated cost data. The table below shows how these dashboards enhance business outcomes:
Feature
Impact on Decision-Making
Real-time visibility
Leaders access up-to-date information
Dynamic decision systems
Executives make quicker choices
Integrated costs and resources
Blind spots disappear
Visual cues
Problems become easy to identify
FineReportleads the way in building customizable dashboards for effective project portfolio management.
Project Portfolio Dashboard Overview
What Is a Project Portfolio Dashboard
What is aproject portfolio dashboard? A project portfolio dashboard is a centralized, visual reporting tool that brings together real-time information from all your projects. You use it to see the status, progress, and performance of your entire project portfolio in one place. This dashboard helps you monitor key metrics, track budgets, and manage resources efficiently.
You can think of a project portfolio dashboard as your command center. It gives you a bird’s-eye view of all active and planned work. Leading project management authorities describe it as a single interface that consolidates information from various projects, allowing you to monitor progress and budgets at a glance.
Source
Definition
Birdview PSA
A project portfolio dashboard is a centralized, visual reporting tool that displays real-time information across multiple projects. It provides a bird's-eye view of all active and planned work.
Priofy
A project portfolio dashboard is a visual representation that consolidates information from various projects into a single interface, allowing project managers to monitor key metrics like progress and budgets at a glance.
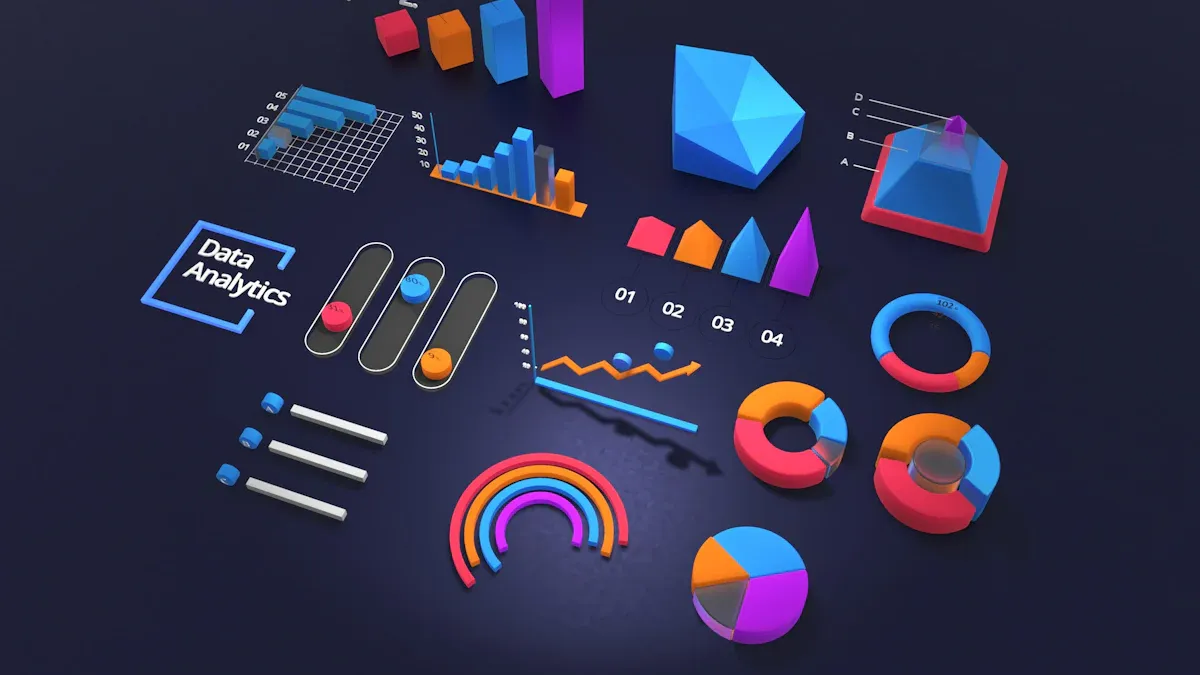
A typical project portfolio dashboard includes several important components. You will find timelines, status markers, charts, and graphical reports. It also displays budget information, resource management details, task trackers, and risk overviews. These features help you keep track of every aspect of your project portfolio.
Project Portfolio Overview
Timelines
Status Markers
Charts and Graphical Reports
Budget Information
Resource Management
Task Trackers
Risk Overview
Core Purpose in Project Portfolio Management
The core purpose of a project portfolio dashboard is to help you manage your project portfolio more effectively. You gain enhanced visibility, better communication, andimproved decision-making. The dashboard allows you to monitor project health and spot areas that need attention right away.
You can use a project portfolio dashboard to see real-time insights into timelines, budgets, and performance metrics. This helps you manage risks before they become problems. You also optimize resource allocation by identifying teams that are underutilized or overworked.
A project portfolio dashboard connects your portfolio data with your organization’s strategic goals. You get real-time visibility, which lets you monitor critical signals and make informed decisions. Automated reports and alerts help you identify issues early, so your projects stay aligned with your strategy. Tailored views for different leadership roles ensure that everyone focuses on the data that matters most to them.
Note: A project portfolio dashboard does more than just display data. It acts as a bridge between your project portfolio and your business strategy, ensuring that every project supports your organization’s objectives.
What is aproject portfolio dashboard? This visual tool gives you a centralized platform to track progress, monitor resources, and analyze performance across your entire project portfolio. You use it to bring together real-time data from multiple projects, making it easier to manage, report, and align with strategic goals.
A project portfolio dashboard acts as your control center for project portfolio management. You see all your projects in one place, which helps you make faster decisions and spot issues before they escalate. You gain enhanced visibility into timelines, budgets, and KPIs, supporting modern portfolio management practices.
Enhancing Decision-Making
You need accurate information to make smart choices in project portfolio management. A project portfolio dashboard delivers up-to-date data, allowing you to respond quickly to changes and challenges. Research shows that automation and real-time dashboards can save up to $157,500 per year in reporting costs for a capital program with ten projects. You also benefit from improved decision-making because you access current information, not outdated reports.
According to PMI's Pulse of the Profession report, 75% of projects run late or over budget due to late identification of issues. Real-time dashboards serve as early-warning systems, helping you detect delays and overruns before they become major problems.
You use dashboards to monitor project health, resource allocation, and financial performance. For example, project health dashboards use traffic light indicators to show status, so you can intervene before problems grow. Resource allocation dashboards help you balance workloads and prevent burnout. Financial dashboards highlight budget metrics, letting you spot financial issues quickly.
Benefit
Description
Time and Cost Savings
Automation can save up to $157,500 per year in reporting costs for a capital program of 10 projects.
Access to up-to-date information enables better decision-making for project managers and stakeholders.
Increased Transparency and Accountability
Dashboards allow for easy access to data, enhancing transparency and accountability in project management.
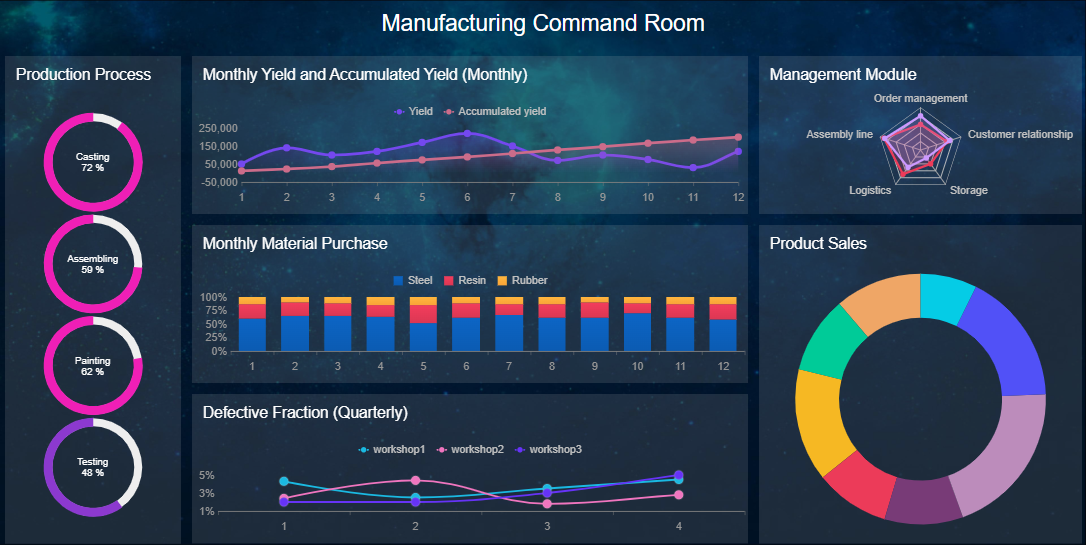
FineReport empowers you to build dashboards that support evidence-backed decision-making. You can monitor real-time progress, identify trends, and align initiatives with corporate goals and KPIs. In manufacturing, companies use FineReportto optimize production schedules and improve quality control, leading to better outcomes and reduced costs.
Transparency is essential in project portfolio management. You need to see what is happening across your project portfolio at all times. A project portfolio dashboard provides real-time monitoring of KPIs, milestones, and deliverables. You communicate progress clearly to teams and leadership, which improves accountability.
You identify risks early and take corrective action before issues escalate. Stakeholders stay engaged because they can access live data without waiting for lengthy reports. This improved visibility leads to better governance and oversight.
Real-time monitoring of project progress across portfolios
Early identification of trends and anomalies to prevent escalation
Alignment of initiatives with corporate goals and KPIs
Evidence-backed decision-making for high-impact outcomes
Case studies show the impact of dashboards on organizational transparency. For example, a pharmaceuticals company reduced meeting preparation time by 75% after centralizing data management. The Viessmann Group improved resource planning and collaboration, increasing acceptance of project goals. Life sciences firms gained complete visibility and streamlined governance by integrating portfolio management tools.
Case Study
Impact on Organizational Transparency
Pharmaceuticals Company
Centralized data management reduced meeting preparation time by 75%, improving governance and accountability.
Viessmann Group
Enhanced visibility across projects allowed for better resource planning and collaboration, increasing acceptance of project goals.
Life Sciences Firm
Integrated portfolio management tools provided complete visibility and transparency to leaders, streamlining governance and reporting functions.
FineReport supports transparency by integrating data from multiple sources and providing customizable dashboards. In the public sector, ADPIC used FineReportto create a CXO dashboard for government capital projects. This solution improved oversight and operational insights, ensuring projects met safety, quality, and sustainability standards.
Strategic project portfolio management requires you to align projects with organizational goals. A project portfolio dashboard helps you track progress, manage risks, and optimize resource allocation. You see which teams are underutilized or overworked, so you can adjust assignments and improve efficiency.
You use dashboards to summarize key metrics and performance indicators. This enhanced visibility supports informed decision-making and helps you prioritize projects for maximum impact. Dashboards also facilitate communication across departments, making it easier to collaborate and share information.
Project portfolio dashboards enhance visibility and communication across projects.
They facilitate informed decision-making by summarizing key metrics and performance indicators.
Dashboards help in tracking and managing project risks effectively.
They optimize resource allocation by identifying underutilized or overworked teams.
FineReport enables you to customize dashboards for different management levels. You can create executive dashboards for senior leaders, operational dashboards for managers, and query reports for frontline staff. In manufacturing, FineReport’s lean production solution integrates real-time analytics, helping companies reduce costs and improve product quality. In the public sector, ADPIC’s CXO dashboard provided strategic insights for large-scale infrastructure projects.
You achieve improved decision-making, enhanced visibility, and better alignment with strategic objectives when you use a project portfolio dashboard. This visual tool transforms project portfolio management, making your organization more agile and successful.
Key Features of Project Portfolio Dashboard
What is a project portfolio dashboard? This visual tool gives you a centralized interface to track progress, monitor resources, and analyze performance across your entire project portfolio. You use it to bring together real-time data from multiple projects, making it easier to manage, report, and align with strategic goals.
A project portfolio dashboard acts as your control center for project management. You see all your projects in one place, which helps you make faster decisions and spot issues before they escalate. You gain enhanced visibility into timelines, budgets, and KPIs, supporting modern portfolio management practices.
Essential Metrics and Visualization
You need to track the right metrics to manage your project portfolio effectively. The most commonly tracked metrics include:
Project Portfolio Overview: Basic details such as project name, goal, objective, and team members.
Timelines: Schedules for each project with delivery dates.
Status Markers: Overall status for each project and the portfolio.
Charts and Graphical Reports: Visuals like Gantt charts and line charts.
Budget Information: Financial data showing if projects are under or over budget.
Resource Management: Allocation and utilization of resources.
Task Trackers: Status of key tasks.
Risk Overview: Current risks to the portfolio.
Visualization techniques help you understand complex information quickly. The table below shows how visuals improve data comprehension for stakeholders:
Benefit
Description
Clarifies Complex Information
Turns large data sets into clear stories, making insights easy to grasp.
Identifies Trends and Patterns
Reveals trends not obvious in raw data, supporting proactive decisions.
Improves Communication
Makes sharing and understanding information easier, boosting collaboration.
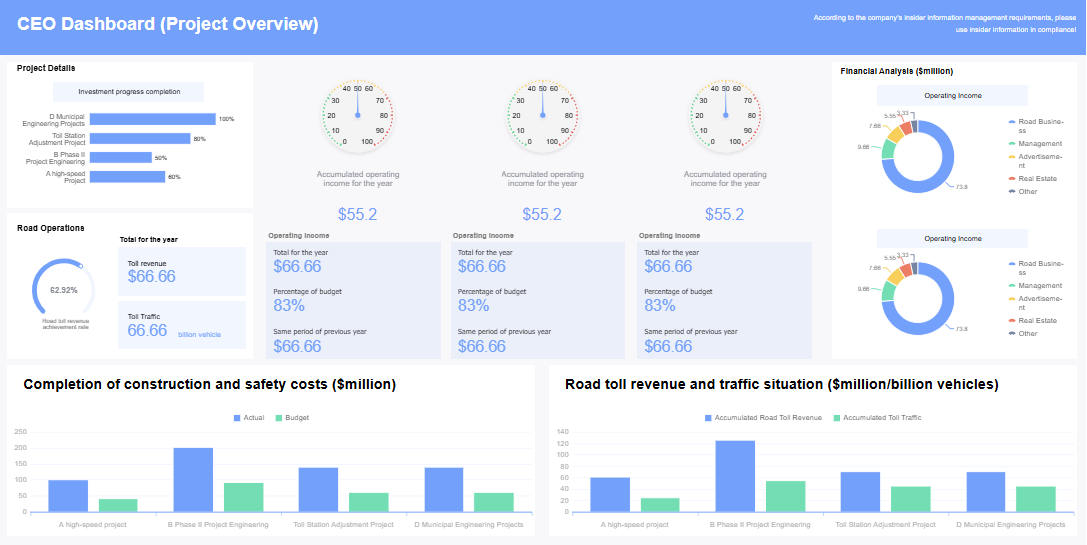
FineReport'sMultiple Built-in Charts For Visualization
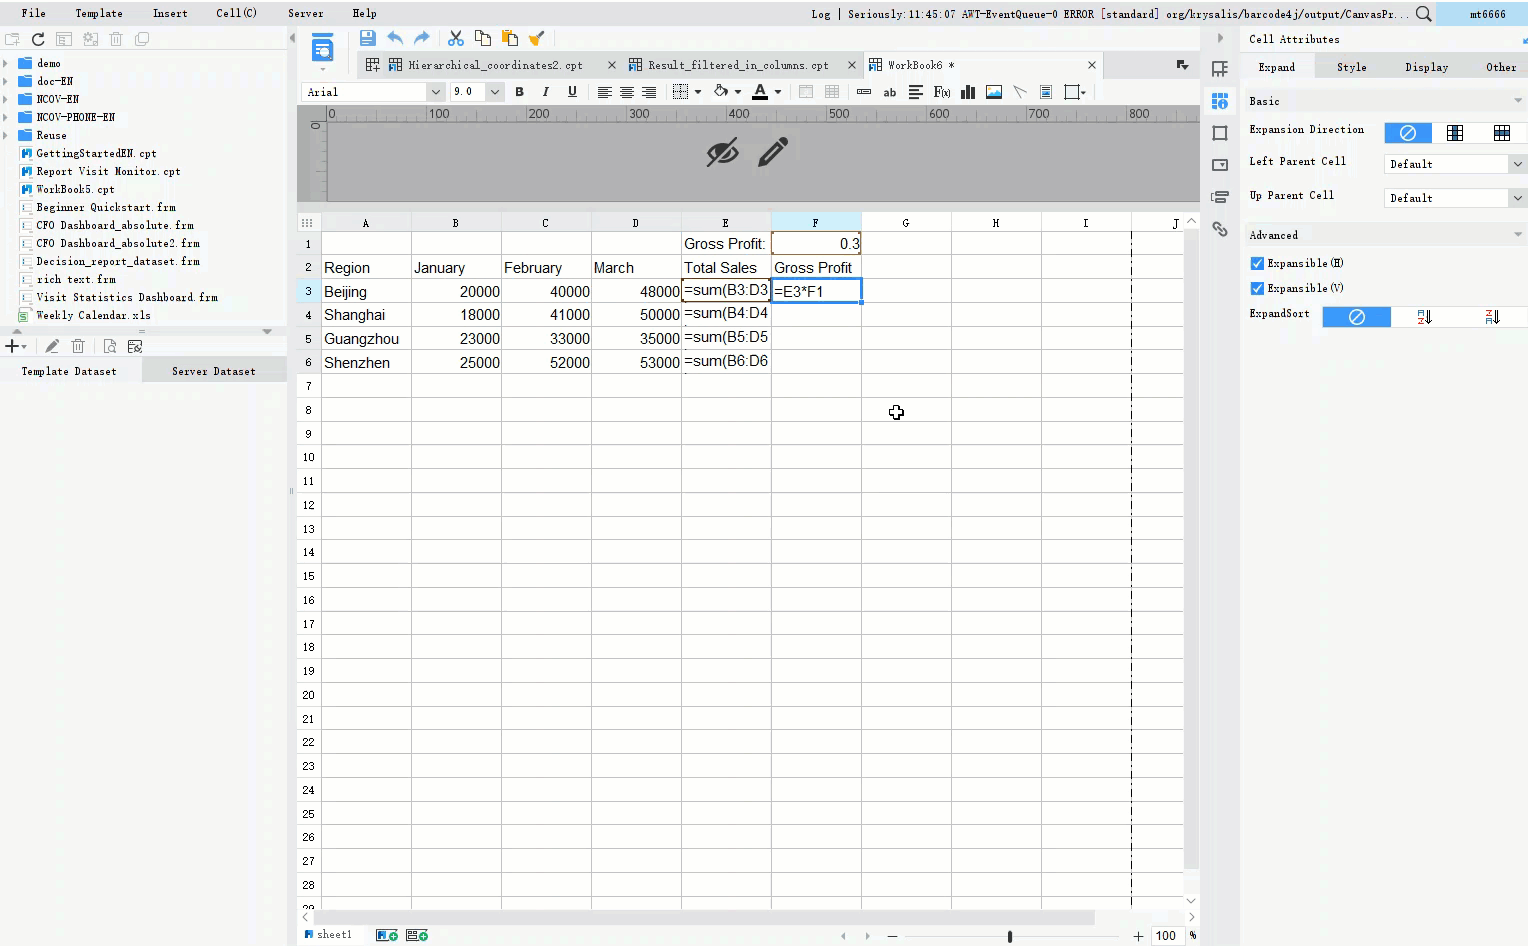
FineReportlets you build project portfolio dashboards with a drag-and-drop designer. You can integrate data from multiple sources, including databases and spreadsheets. The platform supports advanced features such as 3D dashboards, scheduled reporting, and permission management. You customize dashboards to fit your organization’s needs, ensuring each team member sees relevant data.
You stay connected to your project portfolio with mobile dashboard access. FineReport’s mobile capabilities allow you to view dashboards on smartphones and tablets. Real-time updates provide continuous visibility into key metrics, improving tracking and reporting accuracy. Automated reporting reduces manual work and enables timely decision-making. Organizations using real-time dashboards see efficiency gains and faster issue resolution.
What is aproject portfolio dashboard? This visual tool gives you a single place to see all your projects, their progress, and how they connect to your business goals. You use it to track progress, manage resources, and make sure every project supports your strategy. In project portfolio management, this dashboard helps you make better decisions and keep your organization moving forward.
Project portfolio management means you oversee many projects at once. You need to know which projects are on track, which need help, and how resources are used. A project portfolio dashboard brings all this information together. You see real-time updates, spot risks early, and keep everyone informed. This approach supports modern portfolio management by making your work more efficient and transparent.
Streamlined Communication and Collaboration
You improve communication and teamwork when you use a project portfolio dashboard. Everyone works from the same platform, so team members stay updated and aligned. You avoid confusion and reduce delays. The table below shows how key features support collaboration:
Feature
Benefit
Centralized platform
Keeps all team members on the same page, enhancing overall project outcomes and timely completion.
Improved visibility of project statuses
Provides a complete overview of projects, including budgets, risks, and timelines, allowing for early identification of potential roadblocks.
You also benefit from integrated communication tools, document sharing, and automated alerts. These features help you manage files, discuss tasks, and keep everyone informed about changes or risks.
Risk Management and Resource Allocation
A project portfolio dashboard helps you manage risks and resources more effectively. You see project health, timelines, and budgets in one place. You can track risks, monitor delays, and use risk matrices to plan responses. This proactive approach helps you avoid costly problems.
You track and monitor risks for each project, such as delays or cost overruns.
You use risk dashboards to see compliance and integration risks in real time.
You view resource allocation and adjust assignments to keep projects on schedule and within budget.
You make informed decisions because you always know where resources are needed most.
Real-World Use Cases and Customer Success
FineReport adds value to project portfolio management by improving efficiency, reducing costs, and supporting continuous improvement. Organizations like ADPIC use FineReportto build CXO dashboards for government projects. This solution gives leaders real-time insights and better oversight. In manufacturing, companies use FineReport’s lean production solution to optimize schedules, improve quality, and lower costs.
Key Benefit
Description
Enhanced Collaboration
Advanced data permissions and collaborative features for secure teamwork.
Optimized for Large Datasets
Efficient handling of extensive datasets with superior real-time analysis capabilities.
Dedicated Local Support
Responsive local support tailored to your specific needs.
Robust Data Entry
Easily add, delete, or modify data on PCs or mobile devices, ensuring data accuracy with validation checks.
You see these benefits in real-world results. FineReport helps you streamline communication, manage risks, and allocate resources more effectively across your project portfolio.
What is a project portfolio dashboard? This tool gives you a single, visual interface to monitor all your projects, track progress, and align activities with business goals. You use a project portfolio dashboard to centralize data, making it easier to manage resources, timelines, and risks across your entire portfolio.
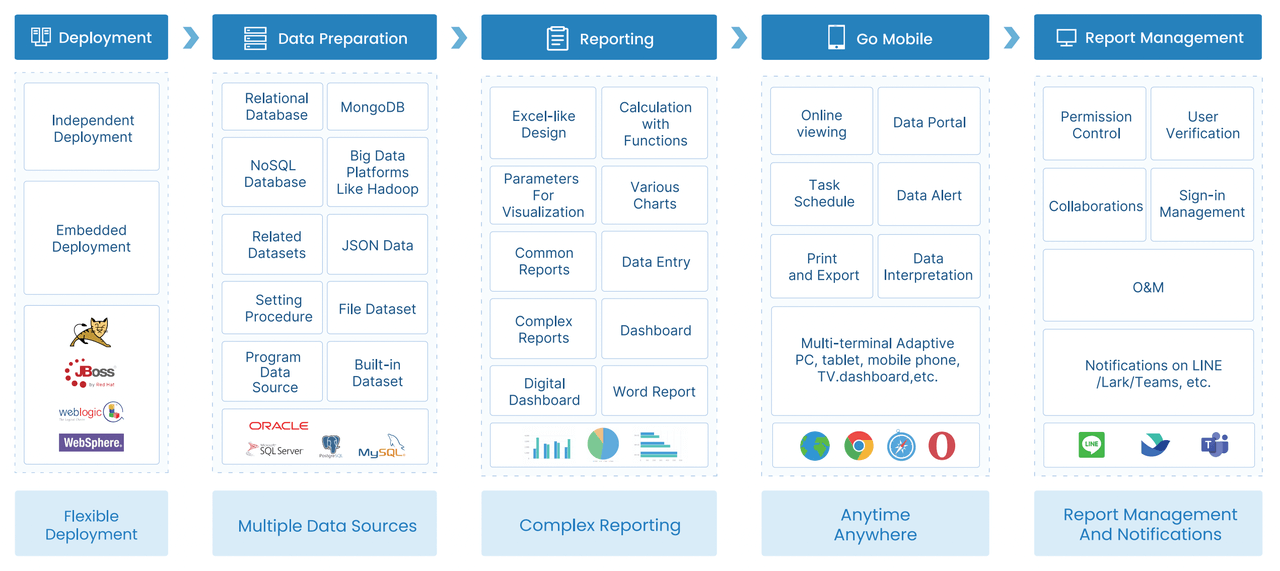
Steps to Create and Deploy with FineReport
You can follow a structured approach to build and launch your project portfolio dashboard:
Identify the insights that will help you manage your portfolio more effectively.
List your requirements, including key metrics and data sources.
Select the right platform for dashboarding.
Connect your data from various systems.
Secure your data to protect sensitive information.
Build the dashboard using intuitive tools.
Review and revise your implementation for accuracy.
Expand and iterate as your needs evolve.
FineReport supports each step with its drag-and-drop designer, multi-source integration, and customizable layouts.
You need seamless integration to ensure your project portfolio dashboard reflects real-time data. FineReportconnects to databases, spreadsheets, and other business systems, allowing you to unify information from multiple sources. This integration supports accurate reporting and helps you avoid data silos. You can automate data updates, reducing manual work and ensuring your dashboard always displays current information.
Best Practices and Common Pitfalls
To get the most value from your project portfolio dashboard, follow these best practices:
Limit KPIsto those that answer critical questions about project status, budget, and alignment.
Design your dashboard to guide viewers through the most important information.
Monitor performance in real time and analyze trends for continuous improvement.
Automate dashboard updates to keep information fresh.
Common pitfalls include using irrelevant metrics, letting dashboards become outdated, providing too much or too little detail, and relying on manual updates. You can avoid these issues by focusing on actionable data and leveraging automation.
Tip: Ongoing support and regular updates help maintain optimal performance and ensure your dashboard continues to meet your project management needs.
A project portfolio dashboard gives you a clear view of all your projects in one place. You use it to track progress, manage resources, and make better decisions. The table below shows how a project portfolio dashboard drives efficiency and business success:
Benefit
Description
Efficient Resource Use
See and balance workloads easily
Increased Productivity
Save time with automated updates
Real-time Tracking
Respond quickly to project changes
Better Decisions
Access key data for fast insights
Improved Risk Management
Spot and address risks early
Strategic Collaboration
Support teamwork and informed choices
FineReporthelps you build dashboards that fit your needs. Start by listing your goals, connect your data, and keep improving your dashboard for the best results.
Continue Reading About Project Portfolio Dashboard
Access a wealth of case studies, industry insights, and solution guides to accelerate digital transformation.
FAQ
What is a project portfolio dashboard?
A project portfolio dashboard is a visual tool that lets you track, analyze, and manage multiple projects in one place. You see real-time updates on progress, resources, and risks. This dashboard helps you align projects with your business goals.
How does a project portfolio dashboard improve decision-making?
You get instant access to key metrics and project statuses. This visibility helps you spot issues early and make informed choices. You can adjust resources or timelines quickly, which keeps your projects on track.
Can you customize a project portfolio dashboard for different users?
Yes, you can customize views and reports for executives, managers, or team members. Each user sees the information most relevant to their role. This flexibility ensures everyone stays focused on their priorities.
What data sources can you connect to a project portfolio dashboard?
You can connect databases, spreadsheets, and business systems. FineReport supports integration with many data sources, so your dashboard always shows current and accurate information.
Is a project portfolio dashboard accessible on mobile devices?
Yes, you can access your project portfolio dashboard on smartphones and tablets. Mobile access lets you monitor projects and make decisions from anywhere, keeping you connected at all times.