Artificial Intelligence
Data Analysis Using AI for Non-Technical Teams: 7 Tools, Real Use Cases, and Key Limits
Saber Chen
May 29, 2026
For non-technical teams, data analysis using AI means turning business questions into usable answers without waiting in line for SQL queries, dashboard builds, or analyst bandwidth. Marketing managers want campaign answers today, sales leaders need pipeline risk visibility before forecast calls, and operations teams cannot afford to make decisions from stale spreadsheets. AI-assisted analysis helps teams move faster by using natural-language prompts, automated summaries, and guided visualizations to reduce the manual work between raw data and action.
 FineBI's AI Data Analysis - DORA
What data analysis using AI means for non-technical teams
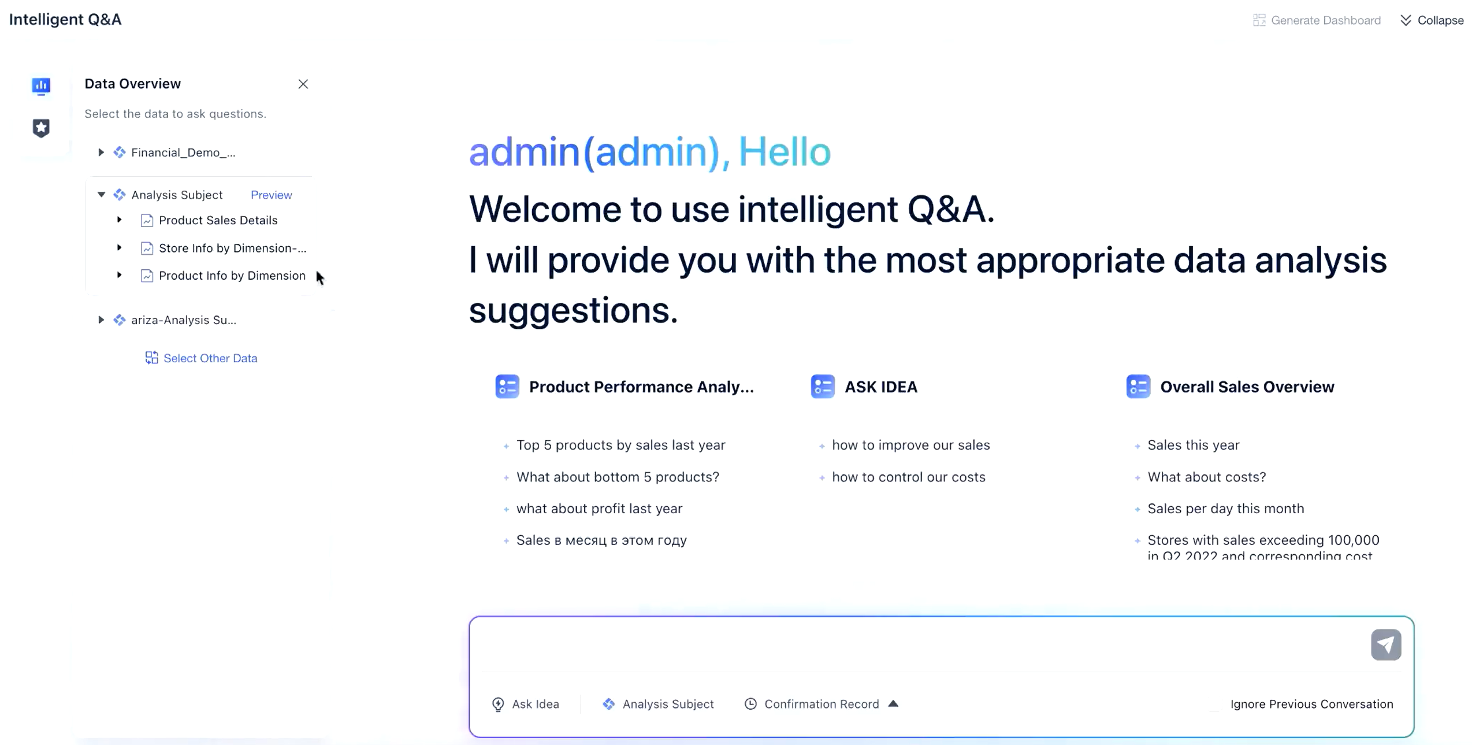
AI-assisted data analysis allows business users to ask questions in plain language, generate summaries automatically, and explore metrics without needing deep technical skills. Instead of building every report through a traditional BI workflow that depends on data teams for extraction, modeling, and visualization, AI tools can help non-technical users get to a first answer much faster.
In a traditional setup, a user might ask for weekly lead-to-opportunity conversion by channel, wait for an analyst to define the logic, query the data, and publish a report. With AI-assisted workflows, a manager may type a question such as, “Which paid channels produced the highest conversion rate in the last 30 days, and how does that compare to the previous month?” The system can return a chart, summary, or draft dashboard in minutes.
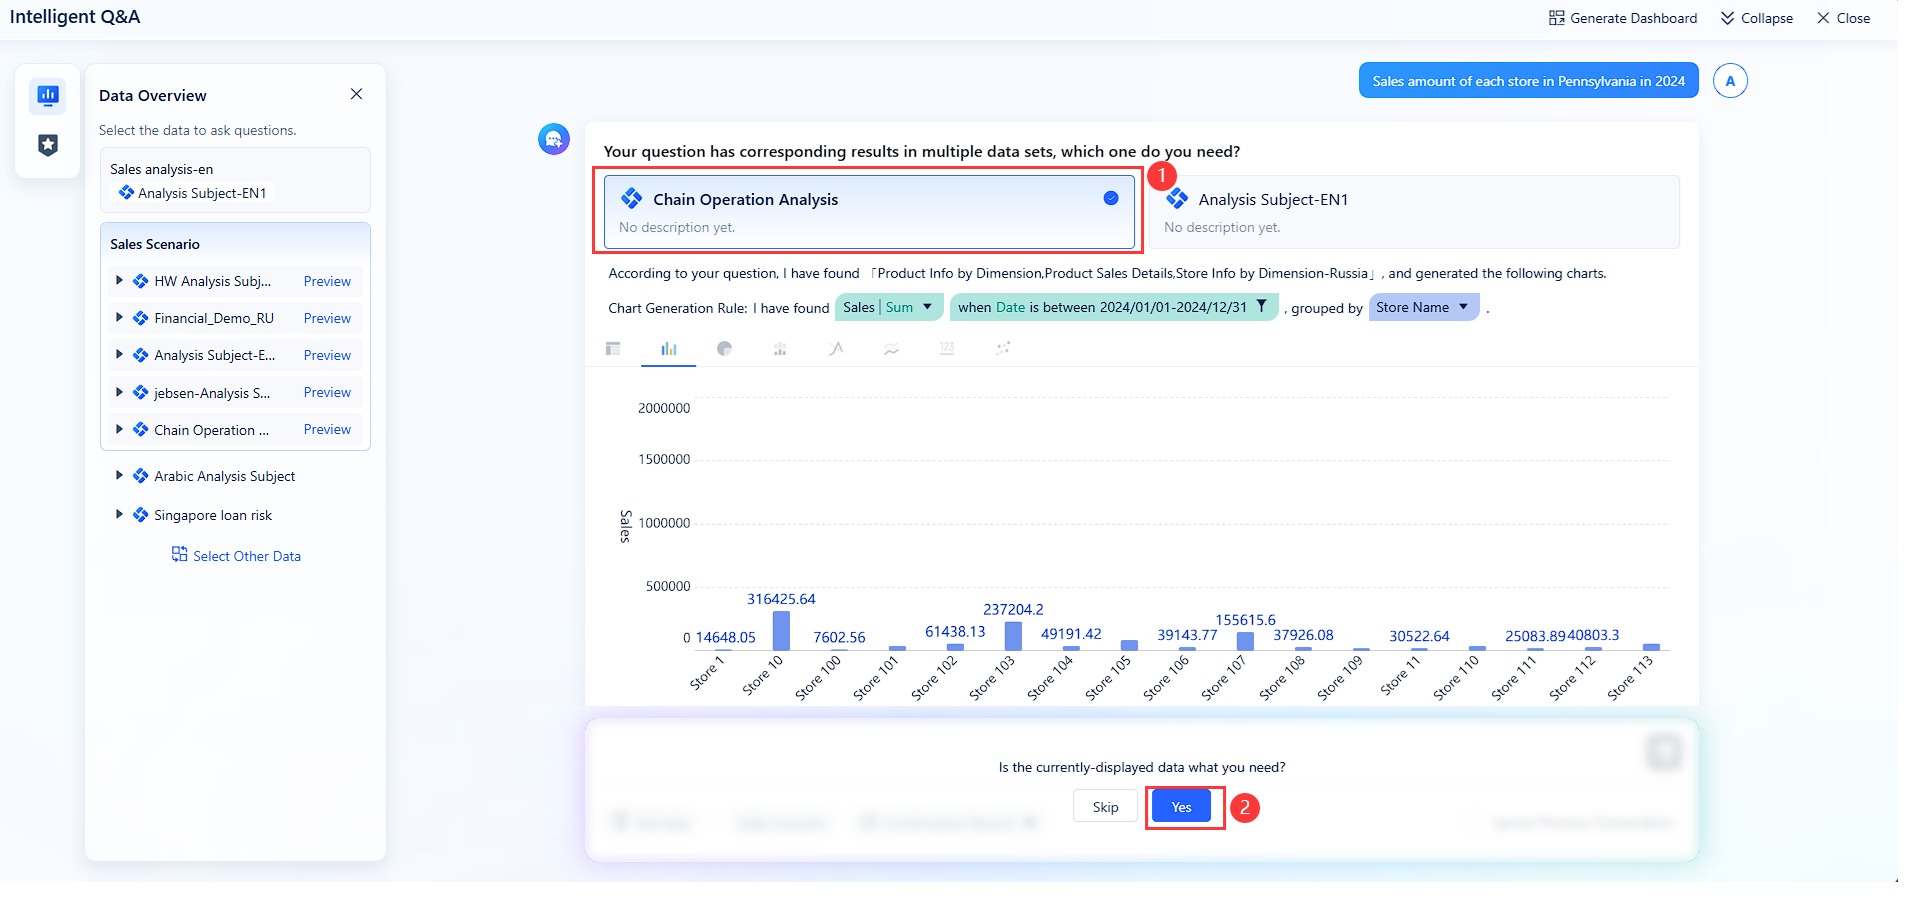 Natural-language Query
This approach is especially valuable for questions like:
- Which campaigns underperformed this week?
- What changed in churn rate by customer segment?
- Which regions missed sales targets?
- What are the top reasons for support ticket escalation?
- Where did costs spike compared with last month?
How AI-assisted analysis differs from traditional BI workflows
Traditional BI is structured, controlled, and often highly reliable for recurring reporting. AI-assisted analysis is faster and more accessible for exploration, but it depends heavily on the quality of the underlying data, definitions, and permissions.
Key differences include:
- User interaction: Traditional BI often requires prebuilt dashboards; AI tools accept natural-language prompts.
- Speed to first insight: AI can generate draft outputs quickly.
- Technical dependency: AI reduces reliance on analysts for routine questions.
- Governance needs: AI still requires strict controls around metrics, access, and validation.
- Analytical depth: Traditional BI and data science workflows remain stronger for advanced modeling and precision analysis.
What non-technical teams can answer faster
Non-technical teams can use AI to accelerate routine and semi-structured analysis, especially when they need fast visibility rather than perfect analytical depth.
Examples include:
- Marketing: Which content themes generated the most qualified leads?
- Sales: Where are deals stalling in the pipeline?
- Customer success: Which customer segments show declining engagement?
- Operations: Which location has the highest variance in delivery time?
- Finance: Which expense categories rose unexpectedly this quarter?
Where human review still matters
AI can speed up reporting and exploration, but it should not replace judgment. Human review is still essential when:
- Metrics have multiple valid definitions
- Source data is incomplete or inconsistent
- The decision has financial, legal, or compliance implications
- The analysis requires causal reasoning, forecasting logic, or statistical rigor
- Teams must explain recommendations to executives or auditors
Why teams are adopting AI for data analysis
Organizations are adopting AI-powered data analysis because it removes friction from day-to-day decision-making. Most business teams are not trying to become data scientists. They want faster answers, fewer reporting bottlenecks, and more confidence in operational decisions.
Reduce dependence on technical specialists
One of the biggest drivers is the backlog problem. Analysts and BI teams are often overloaded with repetitive requests: weekly reports, simple comparisons, segment breakdowns, and executive summaries. AI tools help offload routine reporting so business users can self-serve basic analysis.
Shorten the path from raw data to summaries and charts
AI reduces the number of manual steps required to prepare business-ready outputs. Instead of exporting CSVs, cleaning columns, building pivot tables, and formatting slides, users can generate first-pass summaries and visualizations directly from connected data.
Help teams make quicker decisions
Speed matters when decisions are tied to ad spend, sales coverage, support queues, or inventory flow. AI can help marketing, sales, customer, and operations teams identify trends sooner and act before small issues become expensive problems.
Clarify the convenience-versus-depth trade-off
The real value is not that AI replaces rigorous analytics. It is that AI improves accessibility. Teams gain convenience and speed, but they may sacrifice precision if they rely on unvalidated outputs. Enterprise adoption works best when teams understand this trade-off clearly.
The core framework for AI-driven data analysis
To use AI effectively, non-technical teams need a simple operating model. The goal is not just to ask questions faster. The goal is to get trustworthy answers tied to business decisions.
Key Metrics (KPIs)
Below are the core elements that matter in any AI-assisted data analysis workflow:
- Data freshness: How current the underlying data is. Outdated data leads to misleading conclusions.
- Metric consistency: Whether terms like revenue, conversion, churn, or resolution time are defined the same way across teams.
- Source coverage: Which systems are included, such as CRM, ad platforms, ERP, support tools, or spreadsheets.
- Query accuracy: How closely the AI-generated answer matches the business question being asked.
- Explainability: Whether users can see how the result was calculated or summarized.
- Permission control: Who can access which datasets, fields, and reports.
- Error rate: How often the tool generates incorrect summaries, faulty formulas, or misleading visualizations.
- Time to insight: The time required to go from question to usable answer.
- Actionability: Whether the output helps a team make a concrete operational decision.
- Review compliance: Whether outputs are being checked before they are shared or used in decision-making.
Core elements of a strong setup
A reliable AI analysis environment usually includes:
- Clean, connected data sources
- Standardized definitions for business metrics
- Role-based access controls
- Auditability for generated outputs
- Dashboards for recurring monitoring
- Human review for sensitive or high-impact use cases
For enterprise teams, platforms like FineReport are useful because they combine governed reporting, dashboard delivery, and scalable distribution, while AI-friendly workflows can improve accessibility for non-technical users. In some scenarios, teams may also introduce Dora to support more intelligent data interaction and business-facing analysis experiences.
 Enterprise dashboard with Drill-down view
7 tools non-technical teams can use
Non-technical teams do not need one single product category. In practice, they need a stack of AI-enabled capabilities depending on their workflows, data maturity, and reporting complexity.
AI spreadsheet assistants
AI spreadsheet assistants help users clean data, generate formulas, classify values, identify outliers, and summarize tables using plain-language prompts. They are ideal for teams still working heavily in Excel or cloud spreadsheets.
Best for:
- Quick ad hoc analysis
- Formula generation
- Data cleanup
- Lightweight trend summaries
Limits:
- Hard to govern at scale
- Easy to duplicate logic inconsistently
- Less reliable for enterprise reporting
Conversational BI platforms
Conversational BI tools let users ask business questions in natural language and receive charts, summaries, or dashboards. These tools are strong for users who want self-service insights without learning query languages.
Best for:
- Executive Q&A
- Departmental reporting
- Rapid metric exploration
- Visual answers to business questions
Limits:
- Accuracy depends on semantic modeling
- Ambiguous prompts can produce poor results
- Requires strong metric governance
Embedded analytics with AI copilots
Embedded analytics brings AI-powered data analysis into the tools employees already use, such as CRM, ERP, service platforms, or internal apps. This reduces context switching and improves adoption.
Best for:
- Frontline decision-making
- In-application analytics
- Role-specific insight delivery
- Faster operational response
Limits:
- Integration complexity
- Dependency on existing software architecture
- Variable explainability across vendors
No-code workflow and reporting tools
These tools automate recurring data tasks, reporting cycles, and stakeholder updates. Non-technical teams can schedule reports, route alerts, and trigger summaries without building custom scripts.
Best for:
- Weekly or monthly reporting
- Alerts and distribution
- Cross-team data workflows
- Repeatable operational monitoring
Limits:
- Less suited for deep analytical exploration
- Requires disciplined process design
- Can create automation sprawl if unmanaged
AI-powered dashboard and reporting platforms
This category combines governed dashboards, pixel-perfect reporting, and interactive analysis with enterprise-grade distribution. It is especially useful when organizations need both accessibility and control.
Best for:
- Multi-department reporting
- Management dashboards
- High-volume scheduled reports
- Enterprise governance
Limits:
- Requires thoughtful setup
- Metric models must be maintained
- Broader deployments need IT and business alignment
AI data preparation tools
These tools help business users profile datasets, detect anomalies, standardize fields, and prepare data for reporting with minimal coding.
Best for:
- Data quality improvement
- Dataset merging and enrichment
- Pre-reporting cleanup
- Faster onboarding of new data sources
Limits:
- May not solve governance issues alone
- Some transformations still require technical oversight
AI insight and narrative generation tools
These tools generate plain-language summaries from dashboards or datasets, making it easier to share key takeaways with stakeholders.
Best for:
- Executive summaries
- Meeting preparation
- Report commentary
- Cross-functional communication
Limits:
- Risk of oversimplification
- Summaries can sound confident even when data is weak
Real use cases of data analysis using AI by team
The most effective use of AI in data analysis is scenario-driven. Teams succeed when they apply AI to high-frequency questions with clear business value.
Marketing and growth
Marketing teams use AI to analyze campaign performance, compare audience segments, and identify content trends more quickly.
Common use cases:
- Compare channel ROI by period
- Detect drop-offs in campaign conversion
- Summarize landing page performance
- Identify high-engagement content themes
- Segment lead quality by source
Example scenario: A growth manager asks why lead volume rose while qualified conversions fell. An AI-enabled dashboard reviews campaign mix, landing page conversion, audience shifts, and lead scoring trends, then highlights that low-intent paid social traffic increased sharply over two weeks.

Sales and revenue operations
Sales teams use AI to review pipeline patterns, identify forecast risk, and surface deal bottlenecks across territories or reps.
Common use cases:
- Spot stalled deals by stage
- Compare win rates across segments
- Analyze pipeline coverage versus quota
- Identify discounting patterns
- Flag forecast risk by rep or region
Example scenario: A revenue operations lead asks why quarter-end confidence is dropping. AI surfaces a concentration of late-stage deals with no recent activity, lower-than-normal meeting progression, and increased slippage in one enterprise segment.
Customer support and success
Support and success teams use AI to summarize ticket themes, detect recurring issues, and track satisfaction signals from interactions.
Common use cases:
- Cluster top ticket reasons
- Detect product issues driving escalations
- Compare response and resolution trends
- Track CSAT sentiment changes
- Identify at-risk customer cohorts
Example scenario: A support manager asks what is driving weekend ticket spikes. AI groups similar requests, identifies a recurring billing workflow issue, and shows that a specific plan type is overrepresented in escalated cases.
Operations and finance
Operations and finance teams use AI to monitor costs, spot anomalies, and compare performance across periods, products, locations, or business units.
Common use cases:
- Detect unusual expense spikes
- Compare fulfillment performance by warehouse
- Track budget variance
- Monitor procurement trends
- Analyze margin shifts by product line
Example scenario: An operations director asks why delivery performance fell in one region. AI compares staffing, order volume, route density, and carrier mix, then shows that carrier allocation changed at the same time service levels dropped.
Key limits and risks of data analysis using AI to understand
AI can make data analysis more accessible, but it also introduces real business risks. Leaders should treat AI as an accelerator, not a guarantee of truth.
AI can produce confident but incorrect summaries
If source data is messy, duplicated, delayed, or incomplete, AI may still generate a polished answer that sounds credible. This is one of the biggest risks for non-technical teams. The interface may feel intuitive, but the output is only as trustworthy as the data and logic behind it.
Results depend on data quality and metric definitions
Teams often discover that they are not aligned on basic metrics. If marketing defines a qualified lead differently from sales, or finance calculates revenue differently from operations, AI will not resolve that disagreement automatically.
Sensitive data handling requires guardrails
When AI tools connect to customer, employee, or financial data, organizations need clear controls around:
- Data access permissions
- Field-level restrictions
- Prompt logging
- Output sharing
- Regulatory compliance
- Vendor security review
Teams still need validation and decision discipline
AI can help generate summaries, but it cannot own accountability. High-impact decisions still require context, review, and business judgment.
Best-practice risk controls
- Approve standard metric definitions before rollout
- Restrict access by role and department
- Validate outputs against known reports during onboarding
- Require human review for external or executive-facing reports
- Escalate unusual findings to analysts when stakes are high
How to choose the right data analysis AI tool and get started
Choosing the right platform depends on the team’s reporting volume, data complexity, governance requirements, and desired user experience.
Questions to ask before adopting a tool
Before selecting any AI-enabled data analysis tool, ask:
- What data sources does it connect to?
- How are business metrics defined and managed?
- Can users trace how answers were generated?
- Who can verify or approve outputs?
- Does it support row-level or field-level permissions?
- How does it handle sensitive data?
- Can it scale from ad hoc questions to recurring reporting?
- Does it fit existing workflows and user habits?
A simple rollout plan for non-technical teams
A practical rollout should start narrow and measurable.
1. Pick one repeatable reporting use case
Choose a recurring task with clear business value, such as weekly campaign reporting, pipeline health review, ticket summary reporting, or budget variance monitoring.
2. Define success metrics early
Measure outcomes such as:
- Reduction in reporting turnaround time
- Fewer analyst-created routine reports
- Faster stakeholder access to insights
- Improved report usage or engagement
- Lower error rates after validation cycles
3. Standardize the core metrics
Before enabling self-service prompts, align the team on what each KPI means. This prevents AI from speeding up confusion.
4. Review outputs on a fixed cadence
For the first phase, compare AI-generated outputs to trusted baseline reports. Track discrepancies and refine prompts, models, and permissions.
5. Expand only after governance is stable
Once one workflow performs consistently, scale to adjacent teams or more advanced scenarios.
Actionable best practices for implementing AI-driven data analysis
If I were advising an enterprise team rolling this out, I would focus on these practical steps first.
1. Start with decision-critical but low-risk use cases
Choose workflows that matter operationally but do not carry major compliance or financial risk. Weekly sales summaries, campaign performance reviews, and support volume tracking are good starting points.
2. Build a metric dictionary before opening self-service access
This is the most overlooked step. AI can only be trusted when the business has agreed on definitions. Create standard logic for revenue, conversion, churn, backlog, margin, resolution time, and any other shared KPI.
3. Pair natural-language access with governed dashboards
Do not rely on chat-based outputs alone. Give teams a governed dashboard environment where AI-generated answers can be compared to approved visualizations. This is where enterprise reporting tools such as FineReport can add real value.
4. Establish an escalation path to analysts or engineers
Non-technical users should know when to stop and escalate. If a question requires predictive modeling, custom attribution logic, statistical significance testing, or cross-system reconciliation, involve specialists quickly.
5. Train teams on interpretation, not just tool usage
The biggest mistake is assuming adoption equals capability. Teach users how to challenge outputs, identify weak summaries, and ask better follow-up questions.
When to bring in analysts or engineers
AI is not a substitute for technical expertise in every situation. Bring in analysts or engineers when:
- Data must be modeled across multiple systems
- Business logic is inconsistent or disputed
- Decisions require forecasting or advanced statistics
- Compliance or audit requirements are strict
- Teams need production-grade data pipelines
- Outputs affect pricing, financial reporting, or legal exposure
In mature organizations, the best model is collaborative. Non-technical teams use AI for speed and exploration. Analysts provide rigor, governance, and advanced problem-solving.
Final takeaway
AI is changing how non-technical teams approach data analysis, but the real advantage is not automation for its own sake. It is the ability to answer routine business questions faster, distribute insight more widely, and reduce dependency on overloaded technical teams. The organizations that win with AI are the ones that combine natural-language accessibility with strong metric governance, data quality discipline, and review processes.
If you want scalable, governed reporting with the flexibility to support business users across departments, build your rollout around a real reporting foundation rather than isolated AI experiments.
FAQs
It means using natural-language prompts, automated summaries, and guided charts to turn business questions into insights without needing SQL or advanced analytics skills. The goal is faster access to answers for everyday decisions.
AI-assisted analysis is faster for exploration and easier for business users to access, while traditional BI is usually more controlled and reliable for recurring reports. AI helps with speed, but it still depends on solid data definitions and governance.
Teams can quickly explore questions about campaign performance, pipeline risk, churn changes, support trends, cost spikes, and operational variance. It works best for routine and semi-structured analysis where fast visibility matters.
AI outputs can be misleading if the source data is incomplete, inconsistent, or poorly defined. It is also weaker for causal analysis, advanced forecasting, and high-stakes decisions that require strict accuracy.
Human review is essential when metrics have multiple definitions, data quality is uncertain, or decisions affect finance, compliance, or executive reporting. People are also needed to validate conclusions and explain them clearly to stakeholders.


The Author
Saber Chen
AI Product Architect, CPO
Related Articles

AI With Access to Real Time Data: 10 Free Apps Compared for Business Teams in 2026
AI with access to real time data is software that uses live web signals, current business metrics, or connected internal systems to generate answers, insights, and actions based on what is happening now rather than yeste
Saber Chen
Jun 12, 2026

Google AI Sustainability Reporting: How to Build a Workflow Using Google’s Playbook
Google AI sustainability reporting is not just about drafting a better report faster. It is about building a controlled, traceable workflow that helps sustainability leaders, finance teams, legal reviewers, and data owne
Yida Yin
Jun 16, 2026

What Is a Data Agent? A Practical Beginner’s Guide to How It Works
A data agent is one of the easiest ways to make business data feel more accessible. Instead of opening dashboards, writing SQL, or asking an analyst for help, you can ask a question in plain language and get an answer ba
Saber CHEN
Apr 02, 2026