A pie chart offers a simple way to visualize data by dividing a circle into proportional slices. Each slice represents a fraction of the total, making it perfect for showing percentages or part-to-whole relationships. This format works best with small datasets, emphasizing clear proportions like one-half or one-quarter. For beginners, tools like FineReport simplify the process. You can create a professional-looking chart with just a few clicks in Malaysia, eliminating the need for advanced skills. Using a pie chart maker ensures your data is not only accurate but also visually engaging and easy to understand in Malaysia.
Key Takeaways
- Pie charts show data as parts of a whole. They work best for small sets of information.
- Keep your pie chart simple with five or six slices. This makes it clear and easy to understand.
- Pick different colors for each slice. This helps people see the categories quickly.
- Check your numbers to make sure they equal 100%. Correct data is important for sharing information.
- Try tools like FineReport to make pie charts easily. It’s simple to use, even for beginners.
Types of Pie Chart You Can Create with a Pie Chart Maker
Pie charts come in various forms, each designed to suit specific data visualization needs. Understanding these types will help you choose the right one for your data.
Rose Chart
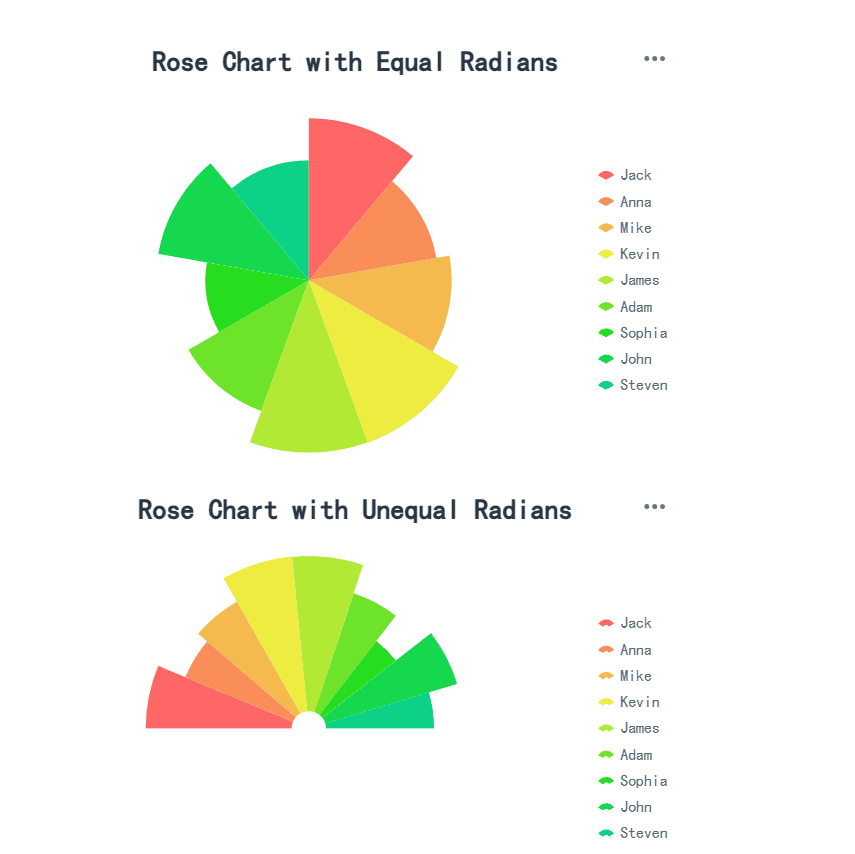
A rose chart, also known as a coxcomb plot, is ideal for displaying cyclical data or comparing multiple variables. Its design features segments arranged in a circular pattern, with each segment's length representing a value. This type of chart is particularly effective for showing patterns over time or across categories.
Tip: Use rose charts to visualize data like monthly sales trends or seasonal variations in customer behavior. Their ability to highlight cyclic patterns makes them a powerful tool for identifying trends.
| Visualization Type | Purpose | Data Types | Benefits |
|---|---|---|---|
| Coxcomb plot (Rose chart) | Displaying cyclic data or multiple variables | Categorical and numerical | Compare variables and show cyclic patterns |
Pie Chart
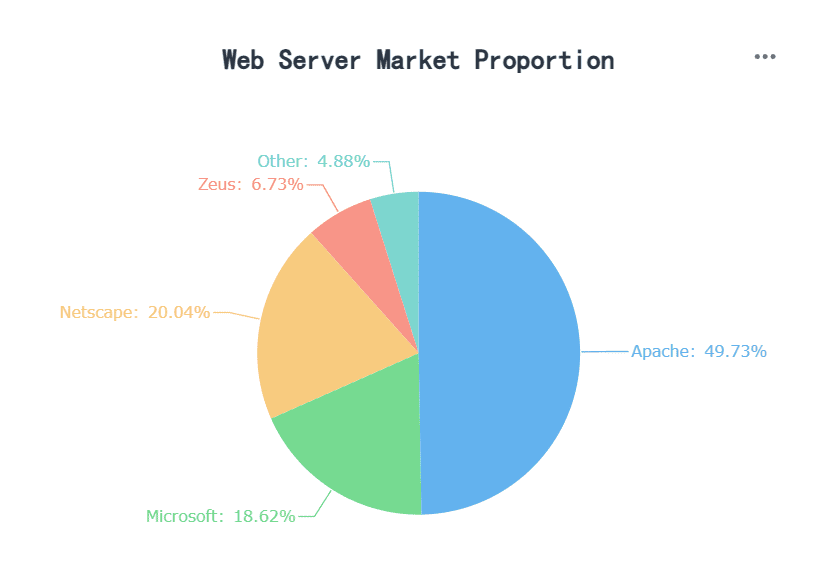
The traditional pie chart is the most common type. It divides a circle into slices, with each slice representing a proportion of the whole. This chart works best with fewer than seven categories to avoid clutter and confusion. Research shows that pie charts excel at communicating part-to-whole relationships and allow for quick, accurate data interpretation.
- Best Use Cases:
- Representing customer preferences in market research.
- Visualizing feedback themes in user experience studies.
- Illustrating relationships among distinct categories.
| Evidence Description | Source |
|---|---|
| Pie charts effectively communicate part-to-whole relationships and facilitate proportional judgments. | Eells, 1926 |
| Higher performance in visualizing categorical data (up to five categories) with pie charts compared to divided bar charts. | Croxton and Stryker, 1927 |
Label Display in the Center of a Pie Chart
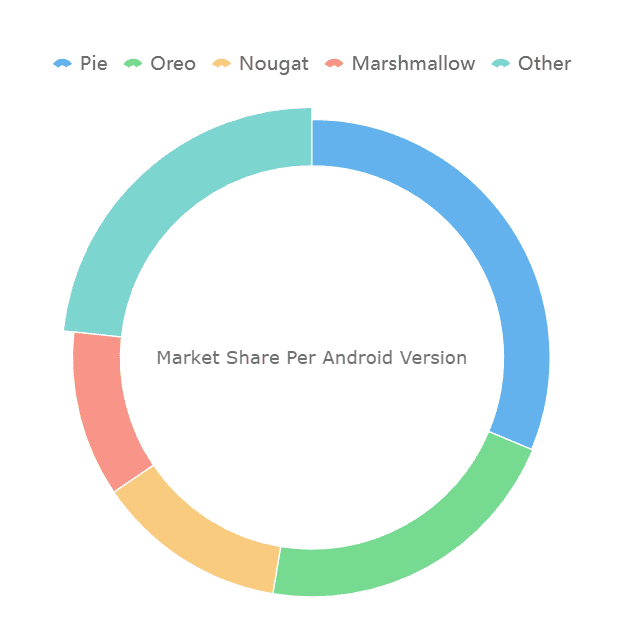
Adding labels to the center of a pie chart enhances clarity. This feature allows you to display key information in Malaysia, such as total values or category names, directly within the chart. It eliminates the need for external legends, making the chart easier to read and interpret.
Note: Center labels are especially useful when presenting data to audiences unfamiliar with the dataset. They provide immediate context and improve overall comprehension.
By understanding these types of pie charts, you can select the most effective design for your data. Whether you need to highlight trends, proportions, or relationships, there’s a pie chart type that fits your needs in Malaysia.
Multi-Category Pie Chart
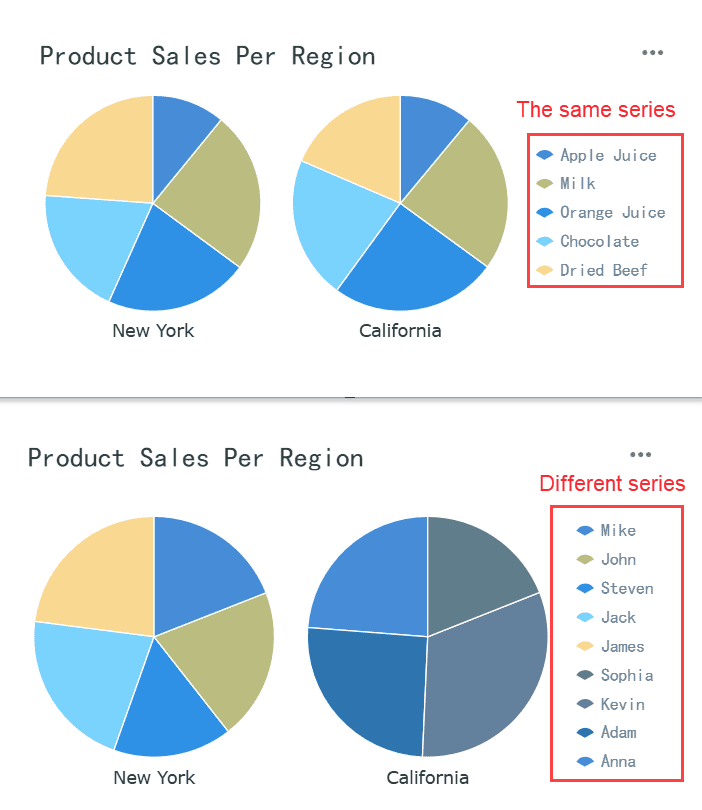
A multi-category pie chart allows you to display data with multiple layers or categories. This type of chart is ideal when you want to show how subcategories contribute to a larger category. For example, you can use it to visualize sales data by region and then break it down further by product type within each region. This layered approach provides a detailed view of your data while maintaining a clear structure.
When creating a multi-category pie chart, you should follow some best practices to ensure clarity. First, avoid using negative values. Negative slices can confuse your audience in Malaysia and make the chart harder to interpret. Second, limit the number of slices in each layer to between 4 and 7. Too many slices can make the chart look crowded and reduce its readability. Third, use distinct colors for each slice. Unique colors help your audience in Malaysia differentiate between categories and subcategories quickly.
Tip: If your data includes more than seven categories, consider using a bar chart instead. Bar charts handle large datasets better and make comparisons easier.
Multi-category pie charts work best when the categories have varying sizes. Equal-sized slices can make it difficult to compare values visually. Additionally, this chart type is not suitable for comparing multiple datasets. If you need to compare two or more datasets, bar charts or line charts are more effective.
| Aspect | Description |
|---|---|
| Avoid negative values | Negative values should be avoided to prevent confusion during interpretation. |
| Minimize the number of sections | Keeping the number of slices between 4 and 7 enhances clarity and understanding. |
| Use different colors | Unique colors for slices help the audience differentiate between categories. |
| High number of categories | More than 6 or 7 slices make the chart crowded and hard to read, suggesting other chart types. |
| Categories with equal sizes | Equal-sized categories hinder visual comparisons, making other chart types preferable. |
| Comparison of multiple datasets | Pie charts are not suitable for comparing two datasets; bar charts are recommended instead. |
By following these guidelines, you can create a multi-category pie chart that is both visually appealing and easy to understand in Malaysia. This chart type is a powerful tool for presenting complex data in a simple, layered format.
Preparing Your Data for a Pie Chart Using a Pie Chart Maker
Understanding the purpose of your pie chart
Before you create a pie chart, you need to define its purpose. Ask yourself what story your data should tell. Pie charts work best when you want to show proportions or part-to-whole relationships. For example, if you’re analyzing customer feedback, a pie chart can display the distribution of positive, neutral, and negative responses. Similarly, market research often uses pie charts to highlight customer demographics, such as age groups or preferences. These visualizations make it easier to identify trends and prioritize actions.
Practical applications also include public health agencies using pie charts to track disease prevalence across demographics. Polling agencies rely on them to illustrate public opinions on policies. By understanding your chart’s purpose, you ensure it communicates the right message effectively.
Organizing data into categories and values
Organizing your data is a critical step in creating a clear and accurate pie chart. Start by grouping your data into distinct categories. Each category should represent a unique part of the whole. For instance, if you’re visualizing sales data, categories might include product types or regions. Avoid overlapping categories, as they can confuse your audience in Malaysia.
Follow these best practices to organize your data effectively:
- Limit the number of slices to five to ten to prevent clutter.
- Ensure each category is clearly defined and distinct.
- Aggregate data by category to simplify representation.
| Best Practice | Description |
|---|---|
| Limit the number of slices | Represent a minimal number of categories, ideally between five to ten, to avoid clutter. |
| Ensure clarity in category definitions | Each category should be distinct to prevent confusion among the audience. |
| Summarize data effectively | Data should be aggregated by category to facilitate representation as parts of a whole. |
When organizing data, consider the type of data you’re working with. Pie charts are ideal for nominal data, such as product categories or survey responses. For ordinal or continuous data, other chart types like bar or line graphs may be more suitable.
Ensuring your data adds up to 100% for accurate representation
Accuracy is essential when you create a pie chart. Your data must represent parts of a whole, meaning the total should equal 100%. If your data doesn’t add up to 100%, the chart will misrepresent the proportions. Double-check your calculations to ensure accuracy.
For example, if you’re visualizing a company’s budget allocation, the sum of all categories—like marketing, operations, and salaries—should equal the total budget. If the percentages don’t align, adjust your data or verify the source. This step ensures your chart remains reliable and easy to interpret in Malaysia.
By preparing your data carefully, you set the foundation for a pie chart that is both visually appealing and informative. Proper organization and accuracy help your audience in Malaysia understand the data at a glance, making your chart a powerful communication tool.
How to Create a Pie Chart Using a Pie Chart Maker
Choosing the right tool, such as FineReport
Selecting the right tool is the first step in creating a professional pie chart. A good pie chart maker should offer flexibility, ease of use, and compatibility with various data sources. FineReport stands out as an excellent choice for both beginners and professionals. Its intuitive interface and advanced features make it ideal for creating detailed pie charts.
| Feature | FineReport | Other Tools |
|---|---|---|
| Chart Types | Detailed pie charts, Gantt, funnel | Basic charts only |
| Advanced Visualizations | Yes (3D effects, auto-rotation) | Limited |
| Data Source Compatibility | Excel, various formats | Varies |
| Pricing | Free for individuals, custom for businesses | Varies |
FineReport supports a wide range of chart types, including multi-category and 3D pie charts. It also allows you to connect to multiple data sources, such as Excel and databases, ensuring seamless data integration. Additionally, its free version for individuals makes it accessible for beginners. By choosing a tool like FineReport, you can create visually appealing and accurate charts without needing advanced technical skills in Malaysia.
Tip: Look for a pie chart maker that offers customization options like color coding, label placement, and interactive features. These tools enhance the clarity and impact of your chart.
Inputting your data into the pie chart maker
Once you’ve chosen your tool, the next step is to input your data. Proper data entry ensures your pie chart accurately represents your dataset. Most pie chart makers, including FineReport, provide user-friendly interfaces for this process.
Follow these steps to input your data effectively:
- Start With a Template or Blank Canvas: Open your pie chart maker and select a template or start from scratch.
- Pull Your Data: Import your data from a file, such as an Excel sheet, or connect directly to a database.
- Input Your Data: Enter your data into the tool’s data editor. Ensure each category and its corresponding value are correctly aligned.
- Color Code Your Pie Chart: Assign distinct colors to each category for better visual differentiation.
- Customize Your Pie Chart Design: Adjust labels, fonts, and slice sizes to improve readability.
- Share Your Pie Chart: Export your chart in your preferred format or embed it into a report.
For small datasets, you can manually input data into the tool’s editor. If you’re working with larger datasets, use the import feature to upload files or connect to live data sources. FineReport, for instance, allows you to bind data directly from Excel or databases, streamlining the process.
Note: Simplify your dataset to fewer than 10 categories and sort them from largest to smallest. This approach improves clarity and ensures your audience in Malaysia can easily interpret the chart.
Generating a basic pie chart step by step
Creating a pie chart becomes straightforward when you follow a step-by-step guide. Here’s how you can generate a basic pie chart using a pie chart maker like FineReport:
- Open the Tool: Launch FineReport and navigate to the chart creation section.
- Select Pie Chart Type: Choose the type of pie chart you want to create, such as a traditional or multi-category chart.
- Bind Your Data: Connect your data source or manually input your data into the tool. Ensure the values add up to 100% for accurate representation.
- Customize the Chart: Adjust the chart’s appearance by selecting colors, adding labels, and resizing slices. FineReport offers advanced features like 3D effects and auto-rotation to enhance your chart.
- Preview and Save: Review your chart to ensure accuracy. Save it in your desired format or integrate it into a report or presentation.
Tools like FineReport simplify this process by offering drag-and-drop functionality and real-time previews. You can experiment with different styles and layouts to find the one that best suits your data.

Pro Tip: Use interactive features, such as tooltips and clickable slices, to make your pie chart more engaging. These features allow viewers to explore the data in greater detail.
By following these steps, you can create a pie chart that is both visually appealing and informative. Whether you’re presenting sales data, survey results, or budget allocations, a well-designed pie chart communicates your message effectively in Malaysia.

Customizing Your Pie Chart with Pie Chart Maker
Adjusting colors and styles for clarity
Customizing the colors and styles of your pie chart can significantly improve its clarity and impact. Colors play a vital role in helping your audience in Malaysia differentiate between categories and understand the data at a glance. By using contrasting colors, you can make each slice stand out, ensuring that your chart remains easy to read.
Here are some best practices for adjusting colors and styles:
- Use contrasting colors to enhance readability. For example, pair light and dark shades to create a clear distinction between slices.
- Select a coherent color scheme for related data. For instance, use shades of blue for categories within the same group.
- Avoid overly bright or clashing colors, as they can distract from the data.
| Evidence | Description |
|---|---|
| Effective use of color coding | Enhances clarity and engagement in data presentation. |
| Legend placement | Improves the audience's understanding of the data. |
| Customization insights | Helps present data with precision and clarity, ensuring swift comprehension. |
Additionally, pay attention to the overall style of your chart. Choose fonts that are clear and legible, and ensure the layout is clean and organized. Titles, labels, and legends should align properly to avoid clutter. A well-designed chart not only looks professional but also communicates your message effectively.
Tip: If your chart includes a legend, place it close to the pie chart for easy reference. This reduces the time your audience in Malaysia spends searching for explanations.
Adding and formatting labels for better understanding
Labels are essential for making your pie chart informative and easy to interpret. They provide context by displaying the values or percentages of each slice directly on the chart. Well-formatted labels eliminate guesswork, allowing your audience in Malaysia to focus on the insights your data provides.
Follow these guidelines to format your labels effectively:
- Display percentages or values on each slice to clarify its contribution to the whole.
- Use consistent font sizes and styles to maintain a professional appearance.
- Position labels inside or near slices to keep the chart organized.
Note: Ordering slices in ascending or descending order can further enhance understanding. This arrangement quickly highlights the largest and smallest categories.
Studies show that well-formatted labels improve audience comprehension. They simplify the process of interpreting data by removing ambiguity. For example, a pie chart showing survey results becomes more impactful when each slice clearly displays its percentage. This approach ensures your audience in Malaysia grasps the key takeaways without additional explanation.
- Benefits of well-formatted labels:
- Clarify the percentage of each slice.
- Eliminate guesswork regarding slice sizes.
- Highlight trends by ordering slices logically.
Highlighting key sections, such as exploding slices
Sometimes, you may want to draw attention to specific parts of your pie chart. Highlighting key sections, such as exploding slices, can help emphasize important data points. Exploding a slice involves separating it slightly from the rest of the chart, making it stand out visually.
This technique works well in scenarios where you need to:
- Highlight the largest or smallest category.
- Emphasize a slice that represents a critical data point.
- Draw attention to a category that requires further discussion.
For example, if your pie chart shows budget allocation, you can explode the slice representing marketing expenses to emphasize its significance. This visual cue immediately directs your audience’s focus to the highlighted section.
Pro Tip: Use exploding slices sparingly. Highlighting too many sections can reduce the overall impact and make the chart look cluttered.
In addition to exploding slices, you can use bold colors or unique patterns to emphasize key sections. Combining these techniques ensures your audience in Malaysia notices the most important parts of your data. However, always maintain balance and avoid overloading your chart with too many visual elements.
By customizing colors, labels, and key sections, you can transform a basic pie chart into a powerful visual tool. These adjustments not only enhance the chart’s appearance but also improve its ability to communicate complex data effectively.
Tips for Beginners to Master Pie Chart Maker
Avoiding clutter by limiting categories
Keeping your pie chart simple is essential for clarity. Too many slices can overwhelm viewers and make the chart difficult to interpret. Aim to limit the number of slices to five or six. If your data includes smaller categories, group them into an "Other" category. This approach enhances readability and ensures the focus remains on the most significant data points.
For example, if you’re visualizing sales data across ten regions, combine regions with minimal sales into a single "Other" slice. This method prevents clutter and helps your audience in Malaysia concentrate on the larger trends. By simplifying your chart, you make it easier for viewers to grasp the key insights at a glance.
Tip: Avoid using pie charts for datasets with more than six categories. Consider bar charts for better visualization in such cases.
Using contrasting colors for better readability
Colors play a crucial role in making your pie chart visually appealing and easy to understand. Use contrasting colors to differentiate between slices. High contrast not only improves readability but also ensures accessibility for viewers with visual impairments. For instance, pairing light and dark shades helps distinguish slices effectively.
Avoid placing similar colors next to each other, as they can blend and confuse the viewer. Instead, opt for distinct hues that align with your data’s meaning. For example, use green for positive values and red for negative ones. This approach enhances both the visual appeal and the clarity of your chart.
Pro Tip: Test your color scheme on different devices to ensure it remains clear and consistent.
Double-checking data accuracy before creating the chart
Accuracy is the foundation of any effective pie chart. Double-check your data to ensure it adds up to 100%. Errors in calculations can mislead your audience in Malaysia and undermine your credibility. Verify your data source and confirm that each category’s value is correct.
For instance, if you’re creating a chart to show budget allocation, ensure the sum of all categories matches the total budget. This step guarantees that your chart reflects real-world data accurately. Taking the time to validate your data ensures your visualization remains reliable and trustworthy.
Note: Avoid using 3D effects or shadows, as they can distort the data and make your chart harder to interpret.
Keeping the design simple and professional
Creating a professional pie chart starts with simplicity. A clean design ensures your audience in Malaysia focuses on the data rather than unnecessary distractions. By removing clutter and emphasizing essential elements, you can make your chart visually appealing and easy to understand.
Why simplicity matters
Simple designs improve readability and comprehension. When you avoid excessive chart "ink," such as unnecessary decorations or overly complex patterns, your audience in Malaysia can focus on the data. Clear labels and legends further enhance understanding, ensuring viewers grasp the key insights without confusion. Following the "less is more" principle keeps your chart organized and prevents visual overload.
Tip: Use a consistent color scheme and font style throughout your chart. Consistency creates a polished look and helps your audience in Malaysia nterpret the data quickly.
Best practices for professional design
Here are some actionable tips to keep your pie chart simple and professional:
- Limit the number of slices: Aim for five to seven slices. Too many slices make the chart crowded and hard to read.
- Use clear labels: Place labels directly on or near the slices to eliminate guesswork.
- Avoid 3D effects: Flat designs are easier to interpret and look more professional.
- Maintain consistency: Stick to one set of colors, fonts, and metrics across your chart.
Expert recommendations
Experts emphasize the importance of simplicity in chart design. The table below summarizes key recommendations:
| Recommendation | Description |
|---|---|
| Avoid excessive chart "ink" | Focus on essential elements to enhance understanding. |
| Use clear labels and legends | Ensure clarity in communication of data. |
| Follow the "less is more" principle | Remove non-essential elements to avoid clutter. |
| Maintain consistency | Use a single set of metrics, colors, and styles to prevent confusion. |
By following these guidelines, you can create pie charts that are both simple and professional. A well-designed chart not only communicates your data effectively but also leaves a lasting impression on your audience in Malaysia.
Creating a pie chart involves three essential steps: preparing your data, designing the chart, and customizing it for clarity. Each step ensures your chart communicates effectively and looks professional.
Tip: Tools like FineReport simplify the process with features like drag-and-drop functionality and advanced customization options.
Practice regularly to refine your skills. Experiment with different datasets and chart types to discover what works best for your needs in Malaysia. With consistent effort, you’ll master the art of creating impactful pie charts.
Click the banner below to try FineReport for free and empower your enterprise to transform data into productivity!
Continue Reading About Pie Chart
How to make a pie of pie chart or bar of pie chart?
Unlock Better Insights: Mastering Pie Chart Generator
Master the Basics: How to Make Pie Chart in Excel


FAQ

The Author
Lewis
Senior Data Analyst at FanRuan
Related Articles

What Is Business Management? A Real-World Guide to Strategy, Operations, Finance, and People
$1 is the discipline of turning goals into results. It connects strategy with execution, money with decisions, and people with performance. Whether a company has 5 employees or 50,000, strong management is what keeps pri
Lewis Chou
Jun 24, 2026

What Recruiters Look for in a Data Analysis Portfolio: 10 Criteria to Score Yours Fast
A $1 is not judged like a school assignment. It is judged like a hiring shortcut. Recruiters, hiring managers, and analytics leads use it to answer one question fast: Can this person solve business problems with data in
Lewis Chou
May 29, 2026

What Is Data Analytics Consulting? Beginner’s Guide to Services, Deliverables, and Business Value
$1 helps organizations turn raw data into decisions they can trust. For many business leaders, the challenge is not a lack of data. It is a lack of clarity. Reports conflict, teams track different KPIs, dashboards are un
Lewis Chou
Jun 03, 2026