If you are searching for power bi for mac, you are probably trying to answer one practical question: Can I actually use Power BI on a Mac, especially an Apple Silicon MacBook with M1, M2, M3, or M4? The short answer is yes, but not in the same way Windows users do.
For Mac users, the real decision is not whether Power BI works at all. It is which workflow fits your job:
Browser access for viewing dashboards, sharing reports, and lightweight collaboration
iPhone or iPad app access for mobile consumption
Windows virtualization or remote access for the full Power BI Desktop authoring experience
That distinction matters even more on Apple Silicon. Older Intel Macs had options like Boot Camp, but M1, M2, M3, and M4 Macs rely on different setup paths, usually involving Windows on ARM through virtualization or access to a separate Windows machine.
Power BI for Mac: what Apple Silicon users can and cannot do
When people ask about Power BI for Mac, they often mix together three different products and experiences:
Power BI Service in a web browser
Power BI mobile app on iPhone or iPad
Power BI Desktop, which is the main Windows-based authoring tool
Understanding that difference saves a lot of confusion.
What Apple Silicon users can do
If you have a Mac with M1, M2, M3, or M4, you can typically:
Open Power BI Service in a browser
View and interact with published dashboards and reports
Collaborate with teammates in shared workspaces
Use the Power BI mobile app on iPhone or iPad
Run Power BI Desktop indirectly by using a Windows virtual machine or remote Windows environment
What Apple Silicon users cannot do natively
What you still do not get is a native macOS version of Power BI Desktop. That means you cannot simply download a Mac installer and start building advanced PBIX files directly in macOS as if it were a Windows laptop.
Apple Silicon changed the setup landscape because these Macs no longer use the same Intel-based approach older Macs used. On Intel Macs, some users relied on dual-boot methods. On M-series Macs, the more common path is:
Virtualization with Windows on ARM
Or remote access to a Windows desktop, laptop, or cloud VM
That matters because performance, compatibility, memory allocation, and driver behavior can vary depending on your workload.
What M1, M2, M3, and M4 users should expect
For most users, the experience breaks down like this:
M1 and M2 Macs: Usually fine for browser-based use and moderate virtualized Desktop work if memory is sufficient
M3 and M4 Macs: Better positioned for smoother virtualization, but still not identical to a native Windows workstation for large or complex BI projects
All Apple Silicon Macs: Good for consumption and light collaboration, but full professional Desktop authoring still needs an indirect setup
The practical takeaway is simple: Power BI on Mac is viable, but your best workflow depends on whether you mainly consume reports or actively build them.
Your main ways to use Power BI on a Mac
Use Power BI in a browser for dashboards, reports, and collaboration
For many Mac users, the browser is the easiest answer. If your main goal is to open dashboards, filter reports, monitor KPIs, comment, share, or review team outputs, then Power BI Service in a modern browser may be enough.
Browser access is usually a good fit for:
Business users
Department managers
Executives
Finance reviewers
Sales leaders
Operations teams consuming published dashboards
In this setup, you can usually:
Access workspaces
View dashboards and reports
Filter and interact with visuals
Share content with teammates
Participate in collaboration workflows
Handle some lightweight edits depending on permissions and scenario
The main limitation is that browser use is not a full substitute for Power BI Desktop. If your role requires serious data modeling or report engineering, the browser alone will feel restrictive.
Typical limits include:
Reduced control for advanced data shaping
Less flexibility for complex model-building tasks
Incomplete support for some local-file-centric workflows
Dependence on already published or centralized data assets
Use the iPhone or iPad app from Apple platforms
The Power BI app for iPhone and iPad is useful, but it serves a different purpose. Think of it as a mobile access layer, not a report-building environment.
This option is most helpful for:
Executives checking KPIs
Regional managers traveling between sites
Sales teams needing pipeline or territory visibility
Field leaders who need alerts and quick updates
Users who want portable access to published reports
So if your question is, “Can I use Power BI on Apple devices?” the answer is yes. If your question is, “Can I build my full BI development workflow from an iPad?” the answer is generally no.
Run Power BI Desktop through Windows virtualization
If you need the full authoring tool, virtualization is the most practical path on Apple Silicon. This is the route most analysts and BI developers consider when they must run Power BI Desktop on M1, M2, M3, or M4 hardware.
The idea is straightforward:
Install virtualization software on your Mac
Run a Windows environment inside that virtual machine
Install Power BI Desktop in the Windows environment
Use it similarly to a Windows PC, with some caveats
This approach is best for:
Report builders
Analysts using DAX
Users working with Power Query transformations
Teams maintaining PBIX-based development workflows
Compared with browser-only access, virtualization gives you much more control. Compared with remote access, it gives you more local flexibility. But it also introduces trade-offs:
More memory and storage use
Potential graphics or display issues
Performance differences versus native Windows hardware
Extra setup steps and maintenance
For heavier enterprise work, some teams still prefer remote access to a separate Windows machine or a managed cloud VM. That can be more stable for large models, stricter IT requirements, or complex connector environments.
How to set up Power BI Desktop on Apple Silicon step by step
Choose a Windows environment that works well on M1, M2, M3, and M4
For newer Macs, the common route is to run ARM-based Windows in a virtualized environment. This is the path most Apple Silicon users evaluate first because it avoids needing a separate physical Windows laptop.
Before you begin, think about three factors:
Memory: Virtualization benefits from more RAM, especially if you keep macOS apps open alongside Windows
Storage: Power BI projects, Windows updates, and cached datasets can take meaningful disk space
Performance expectations: Small to moderate reports are one thing; large models and many background apps are another
A practical rule is that casual experimentation and lightweight report work require much less from the machine than serious data modeling.
You should also decide whether you want:
A local virtual machine on your Mac
Or remote access to a Windows desktop or cloud VM maintained elsewhere
If your BI work is occasional, local virtualization may be enough. If your work is central to finance, data, or enterprise reporting, a dedicated Windows environment may be more reliable.
Install Windows and Power BI Desktop
At a high level, the setup sequence is usually:
Create the virtual machine
Install Windows
Run Windows updates
Configure basic sharing and display settings
Download and install Power BI Desktop
Sign in with the required Microsoft account
That sounds simple, but a few practical details matter.
Step 1: Create the virtual machine
Set up your virtualization software and create a Windows VM appropriate for Apple Silicon. Make sure the VM has enough allocated memory and storage before you install heavy tools.
Step 2: Install Windows
Install Windows, complete the basic device and account setup, and let the system finish its initial update cycle. Many later problems come from skipping updates too early.
Step 3: Update Windows fully
Before installing Power BI Desktop, run updates and restart as needed. This helps avoid compatibility and sign-in issues.
Step 4: Download Power BI Desktop
Users typically obtain the installer from Microsoft’s official download flow. In some enterprise environments, account permissions, software distribution policies, or managed app stores may affect how the app is installed.
Step 5: Sign in and confirm access
Once Power BI Desktop launches, sign in with the correct organizational or personal Microsoft account, depending on your use case. If your company uses Microsoft 365 or managed tenant policies, confirm your account has the right Power BI permissions and license context.
Optimize performance and file handling
After installation, spend a few minutes tuning the environment. This can make a noticeable difference.
Recommended adjustments include:
Allocating reasonable CPU and memory to the VM
Avoiding too many heavy macOS apps while running Power BI Desktop
Enabling shared folders for easier PBIX and source file access
Using display settings that reduce scaling friction
Storing active files in a consistent, predictable location
Common bottlenecks for Mac users include:
Too little RAM assigned to Windows
Limited free storage on the Mac
Large imports causing memory pressure
Slow shared-folder performance for source files
Background sync apps competing for system resources
For larger datasets, try to minimize unnecessary simultaneous workloads. A virtualized BI setup is usually most stable when it is treated like a focused work environment, not a dozen-app multitasking session.
Test your setup with a simple report
Before using the setup for production work, validate it with a small report.
A useful test includes:
Importing a sample dataset
Creating a few visuals
Refreshing data
Saving the PBIX file
Reopening it to verify stability
Testing export behavior if relevant to your workflow
You should also confirm that your important basics work as expected:
Sign-in stays stable
File save paths are consistent
Refresh runs successfully
Needed connectors appear
Visuals render properly
Publishing or export actions complete without obvious errors
Common issues Mac users run into and how to solve them
Installation, login, and licensing problems
A common frustration is getting Power BI Desktop installed but not fully usable. Typical issues include:
Installers that fail or stall
Sign-in loops after launch
Tenant or account restrictions
License mismatch between expected and actual features
Confusion between Desktop functionality and Service licensing
If Power BI opens but key features seem unavailable, check:
Whether you are signed into the correct Microsoft account
Whether your organization restricts certain workspace or publishing rights
Whether you are expecting a Service feature from within Desktop, or vice versa
Whether security or identity policies in your company are blocking normal sign-in behavior
If you are in a managed enterprise environment, the fastest fix is often to confirm the account, tenant, and licensing setup with IT before troubleshooting the virtual machine itself.
Slow performance, memory pressure, and graphics quirks
Virtualization introduces overhead, so some lag is normal. What matters is whether it is minor inconvenience or a real blocker.
Common symptoms include:
Slow visual rendering
Delays when loading large models
Lag while editing report pages
Windows freezing under memory pressure
Display scaling issues or blurry UI elements
To troubleshoot, work through the basics first:
Increase memory allocation if your Mac has enough headroom
Close unused Mac apps
Reduce simultaneous browser tabs and sync tools
Confirm enough free disk space remains on the host Mac
Lower display strain if high-resolution scaling is causing instability
A good decision point is this: if your daily workflow involves large datasets, frequent refreshes, and complex modeling, and the VM constantly struggles, your Mac may not be the right primary Power BI Desktop machine.
Data source, gateway, and refresh limitations
This is where many Mac users discover the difference between local development and enterprise deployment.
Local report building on a Mac via virtualization may work well enough. But enterprise refresh and connectivity can get more complicated because of:
Local file path differences between macOS and Windows
Gateway configuration requirements for on-premises sources
In practice:
Building and testing a report locally is often manageable
Setting up production-grade refresh processes may require coordination with IT
Enterprise data sources may work better through centrally managed infrastructure than through a personal Mac-based setup
If your reports depend on governed refresh, gateways, or specialized enterprise connectors, it is wise to validate the end-to-end workflow early instead of assuming local success will translate directly to production.
How to choose the best Power BI workflow for your Mac
Best option for casual viewers and business users
If you mainly consume dashboards and reports, the simplest path is usually the best one: use Power BI Service in a browser.
This is the right fit if you mostly need to:
Review KPIs
Filter dashboards
Join discussions around reports
Monitor team performance
Share insight snapshots with others
For many managers and business users, this avoids unnecessary technical overhead.
Best option for report builders and analysts
If you actively build reports and need the real Desktop environment, a virtualized Windows setup is often worth the effort.
This is usually the best choice when you need:
PBIX-based report development
DAX work
Power Query transformations
More control over report design and model behavior
It takes more setup and stronger hardware discipline, but it gives analysts much more capability than the browser alone.
Best option for teams with heavy data modeling needs
If your team works with larger models, stricter governance, or more demanding enterprise workloads, a dedicated Windows PC, managed cloud VM, or remote desktop setup may be more reliable than running everything locally on a Mac.
Choose browser access if you mostly view and share
Choose virtualization if you need full Desktop features and can manage the setup
Choose remote Windows infrastructure if performance, stability, or governance matters more than local convenience
Practical recommendations before you commit
From a BI consulting perspective, the best Mac setup is usually the one that matches the user role, not the one with the most technical complexity.
Here are five practical recommendations:
Start with your real workload
If you mainly consume reports, do not overbuild your environment.
If you author reports daily, plan for Desktop from the start.
Test with a realistic sample file
Use a report that reflects your actual data size and visual complexity.
A toy example may hide performance problems.
Validate connectors and refresh early
Especially if you use enterprise data sources, drivers, or gateway-dependent refresh.
Budget for memory and storage
Virtualization is far more comfortable when your Mac has enough headroom.
Separate personal convenience from team reliability
A local Mac setup may be fine for prototyping, while production reporting may still belong on managed Windows infrastructure.
A practical alternative for teams that want easier self-service BI
Tools like Power BI are widely used in the BI market, but teams that need a more business-user-friendly, self-service BI platform may also consider FineBI.
This matters for Mac users because the problem is often not just operating system compatibility. It is also about how easily business teams can:
Access trusted dashboards
Build interactive analysis without heavy technical dependence
Explore data with drill-down and filtering
Share insights across departments
Reduce friction between business users and technical BI developers
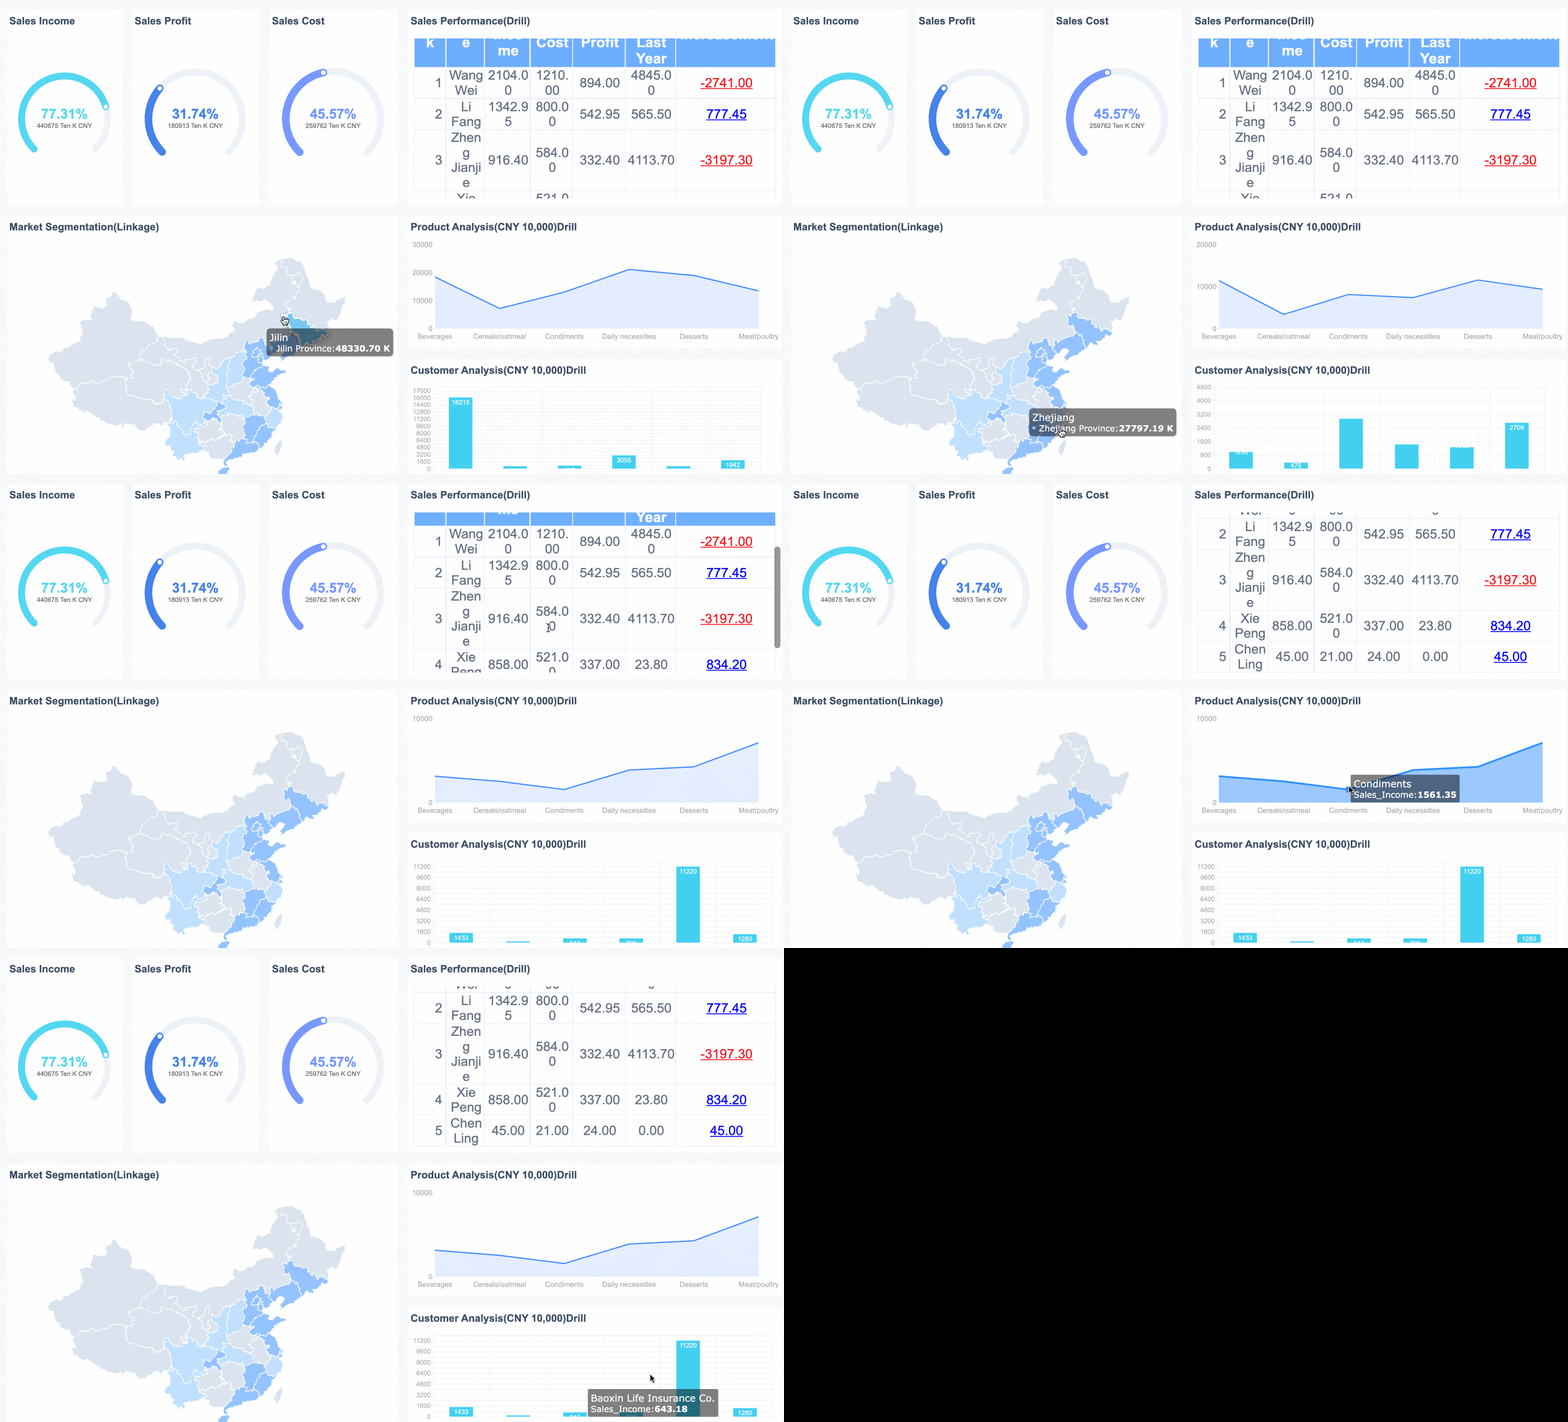
FineBI is positioned as a self-service BI platform designed to help business teams analyze and visualize data with a more approachable workflow. It supports interactive dashboards, drag-and-drop analysis, data exploration, and sharing across the organization. For teams trying to reduce reliance on desktop-heavy report development, that can be a meaningful advantage.
Dora adds another layer. Dora is FanRuan’s enterprise Data Agent platform, designed to work on top of FineBI and existing enterprise data assets. Rather than replacing BI, it extends it into Agentic BI workflows.
In practical terms:
FineBI builds the trusted dashboard, metric, and semantic foundation
Dora turns that foundation into a scenario-specific AI assistant or AI digital employee
That means a team can move beyond static dashboard consumption toward governed AI-supported workflows such as:
For enterprises that already have trusted BI or data assets, Dora can also be considered as a standalone enterprise Data Agent layer. But it is best understood as complementing governed analytics, not replacing them.
When FineBI + Dora is a strong fit for Mac-based teams
If your team includes many Mac users, FineBI + Dora can be especially relevant when you want to reduce dependence on a Windows-only Desktop authoring model.
It is a strong fit for scenarios like:
Business teams that need self-service dashboards without steep technical barriers
Enterprises looking to add a governed AI workflow on top of existing BI assets
Operations, finance, and management users who need answers and follow-up, not just static reports
In those cases, the conversation shifts from “How do I force a Windows-only workflow onto a Mac?” to “How do I give business users a more accessible analytics experience while keeping governance intact?”
Final thoughts on power bi for mac
The most honest answer to power bi for mac is this:
Yes, Mac users can work with Power BI
No, there is still no native macOS Power BI Desktop
Apple Silicon users usually need browser access, mobile access, virtualization, or remote Windows infrastructure depending on their role
If you are a casual dashboard consumer, browser access is usually enough. If you are a report builder, virtualization may work well. If you are part of a heavy enterprise BI team, a managed Windows setup may be more dependable.
And if your organization wants a broader path to self-service analytics, easier business adoption, and governed AI-assisted workflows, FineBI + Dora is worth evaluating alongside the traditional options.
FAQs
Yes, you can use Power BI Service in a web browser on a Mac for viewing dashboards, interacting with reports, and collaborating with your team. However, the full Power BI Desktop authoring experience still requires Windows.
No, Power BI Desktop does not have a native macOS version. Mac users who need advanced modeling, Power Query, and DAX work must use virtualization or remote access to a Windows environment.
Apple Silicon Macs typically run Power BI Desktop through Windows on ARM in a virtual machine or by connecting to a remote Windows PC or cloud VM. This works for many users, but performance and compatibility can vary by workload.
For many business users, yes, because the browser version handles report viewing, filtering, sharing, and light collaboration well. If your job involves building complex PBIX files or heavy data modeling, the browser alone is usually not enough.
If you create reports often, the best setup is usually a Windows virtual machine on your Mac or remote access to a dedicated Windows machine. That gives you access to the full Power BI Desktop feature set while keeping your main workflow on macOS.
Product Trial
FineReport
Pixel-perfect reports · Interactive dashboards · Easy data entry · Digital twins




 An interactive dashboard created by FineBI