A production dashboard is a visual tool that gathers and displays real-time production data, giving you instant production visibility. With live production monitoring, you can track key metrics and spot trends as they happen. This dashboard lets you make faster decisions, solve problems early, and keep your team focused using unified data. Real-time information empowers proactive decision-making, preventing 75% of quality issues and boosting operational efficiency by 15%. With data-driven tools, you can transform manual processes into automated systems, ensuring swift responses to challenges and smarter strategies for growth.
The data panel and system construction of the cases in this article are implemented by FanRuan's products. Click the button below to use the functions of the latest version of FanRuan's products for free, come and try it!

A production dashboard is a powerful visual tool that consolidates critical manufacturing data into a single, easy-to-read interface. It provides real-time insights into production processes, enabling you to monitor key metrics like equipment status, output levels, and quality performance. By displaying this information through widgets, charts, and graphs, the dashboard ensures you can quickly identify trends, anomalies, and areas for improvement.
Manufacturing dashboards are designed to be user-specific, catering to the unique needs of operators, managers, and executives. For example, an operator might focus on machine utilization and downtime, while a manager might prioritize overall equipment effectiveness (OEE) and production throughput. These dashboards also integrate seamlessly with other systems, such as MES (Manufacturing Execution Systems) and ERP (Enterprise Resource Planning), ensuring a unified view of operations.
Key Performance Indicators (KPIs) form the backbone of any manufacturing dashboard. Metrics like defective rates, machine occupancy, and inventory levels guide decision-making and help your career maintain high standards of efficiency and quality. For instance, tracking OEE allows you to evaluate availability, performance, and quality, ensuring your production processes remain optimized.
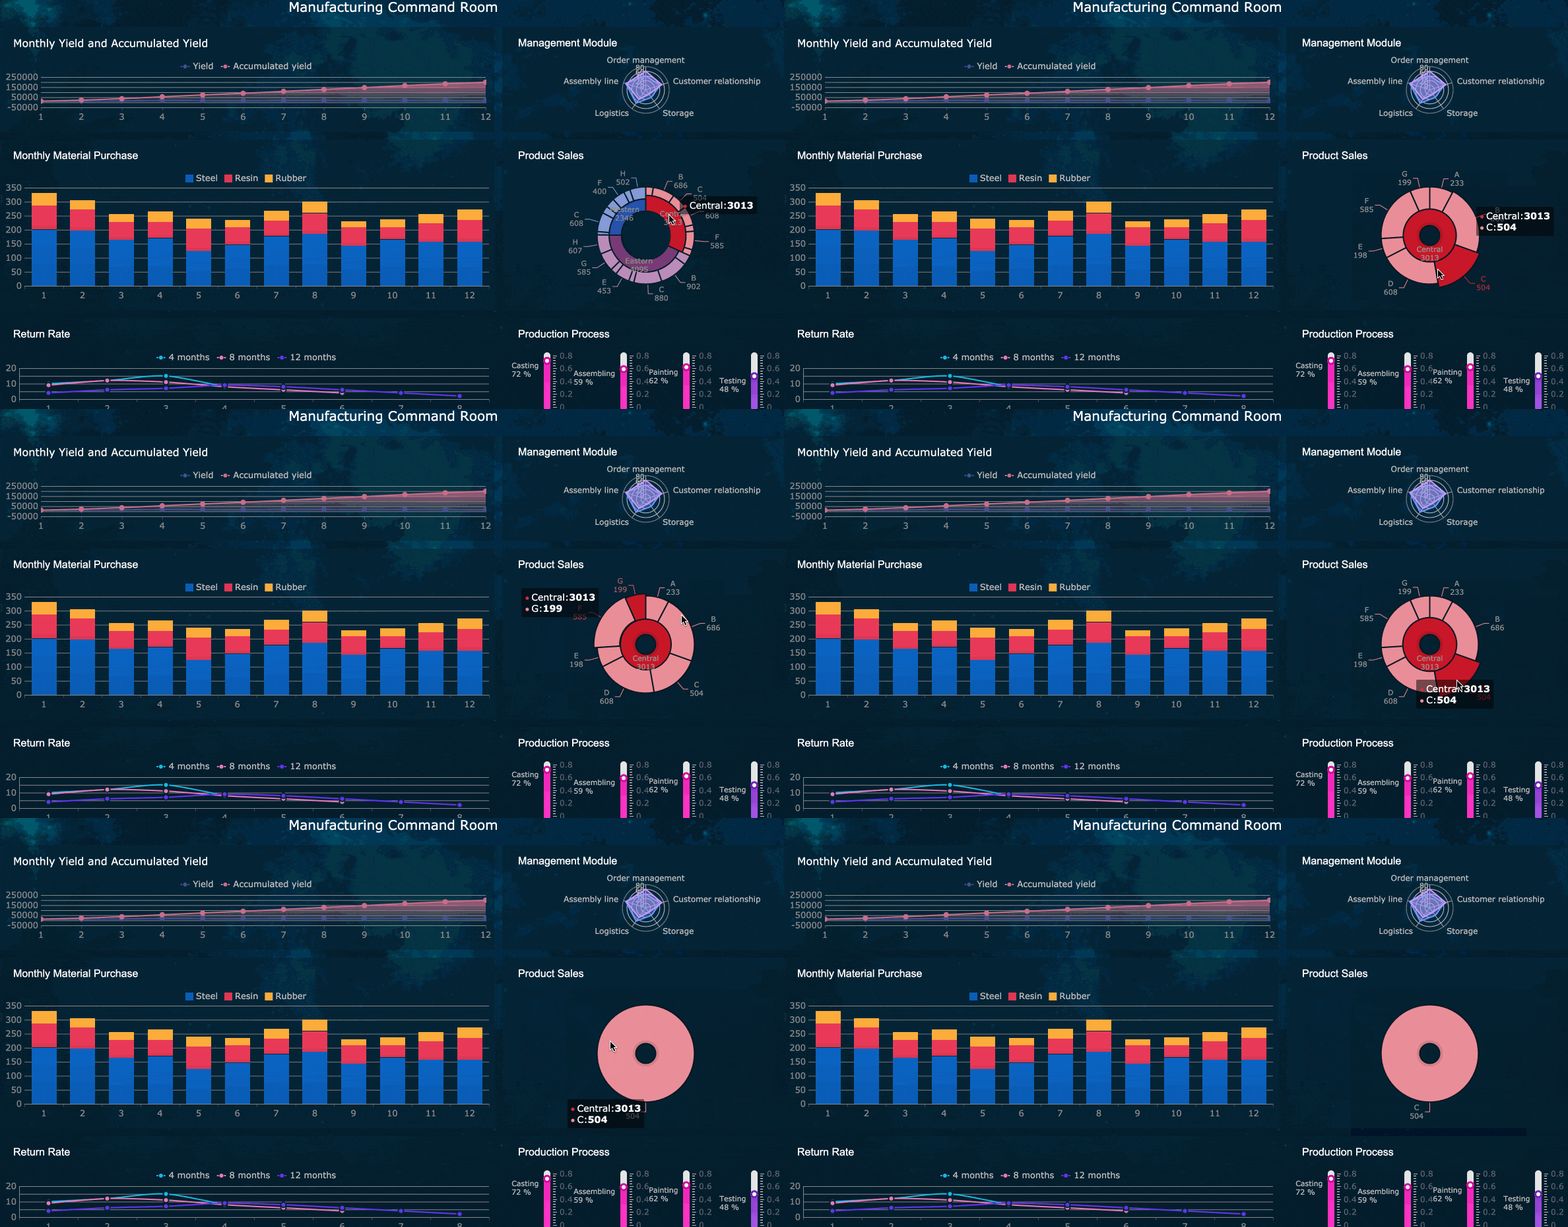
Tip: A well-designed production dashboard should not only display data but also contextualize it. This means providing insights that help you understand the "why" behind the numbers, enabling proactive decision-making.
Real-time production dashboards have become indispensable in today’s fast-paced industrial landscape. They empower you to monitor and manage production processes as they happen, ensuring you can respond to issues immediately. This capability is especially crucial in modern operations, where delays or inefficiencies can lead to significant financial losses.
These dashboards excel at tracking materials from arrival to departure, offering a comprehensive view of the shop floor. For example, a pharmaceutical manufacturer reduced batch rejection rates by 45% and improved production throughput by 30% by using a dashboard to monitor 300 process parameters in real time. Similarly, a precision components manufacturer achieved a 65% reduction in quality defects and a 40% improvement in machine utilization by leveraging predictive analytics within their dashboard system.
Real-time dashboards also enhance workflow optimization by consolidating KPIs like machine utilization, downtime metrics, and defective rates. For instance, Toyota’s lean manufacturing principles, supported by real-time dashboards, have helped the company maintain operational efficiency rates of 97%. By regularly comparing performance against industry standards, organizations can achieve efficiency gains of up to 20%.
Note: Real-time dashboards are not just about monitoring; they are about enabling action. When you can see disruptions or inefficiencies as they occur, you can take immediate steps to address them, minimizing downtime and maximizing productivity.
The integration of real-time manufacturing dashboards into operations has also proven to reduce waste and improve quality. A semiconductor manufacturer, for example, cut production losses by 75% by processing over 10,000 data points per minute. This level of insight allowed them to detect and adjust process deviations instantly, ensuring consistent quality and efficiency.
A comprehensive production dashboard excels in providing real-time insights through advanced data visualization. By transforming raw data into intuitive charts and graphs, you can quickly identify trends and anomalies. For instance, companies using real-time manufacturing dashboards have reported a 30% increase in productivity. These dashboards also make it 30% more likely for organizations to exceed their performance goals by visualizing key metrics effectively.
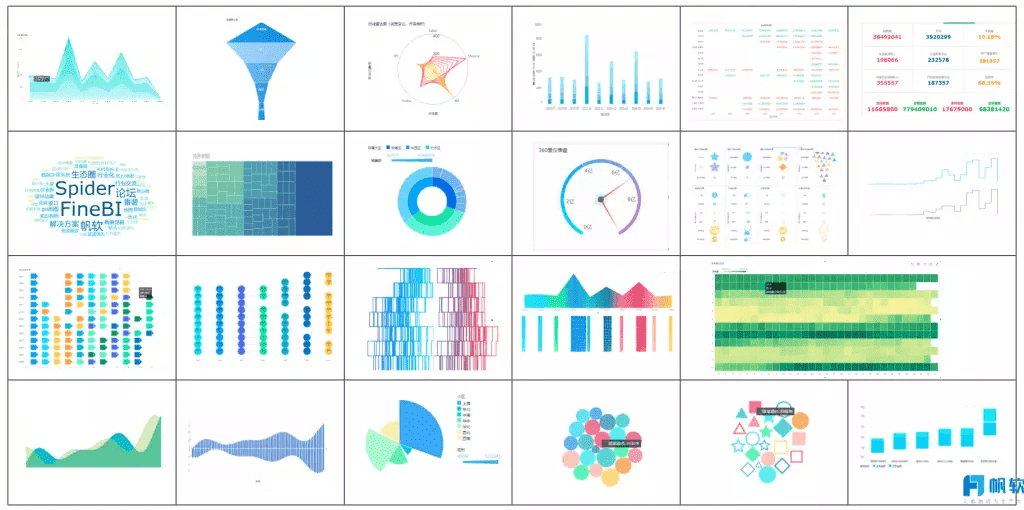
Tracking performance metrics is essential for improving manufacturing efficiency. A quality control dashboard enables you to monitor KPIs like overall equipment effectiveness, cycle time, and quality yield. For example, reducing cycle time directly increases the number of units produced per hour, while higher quality yield minimizes waste and rework.
A comprehensive manufacturing operations dashboard integrates these metrics seamlessly. Research from MESA shows an 18% improvement in overall equipment effectiveness after implementing advanced data monitoring systems. By balancing machine load with maintenance schedules, you can reduce emergency downtimes and boost production rates. This approach ensures that every aspect of your operation contributes to overall efficiency
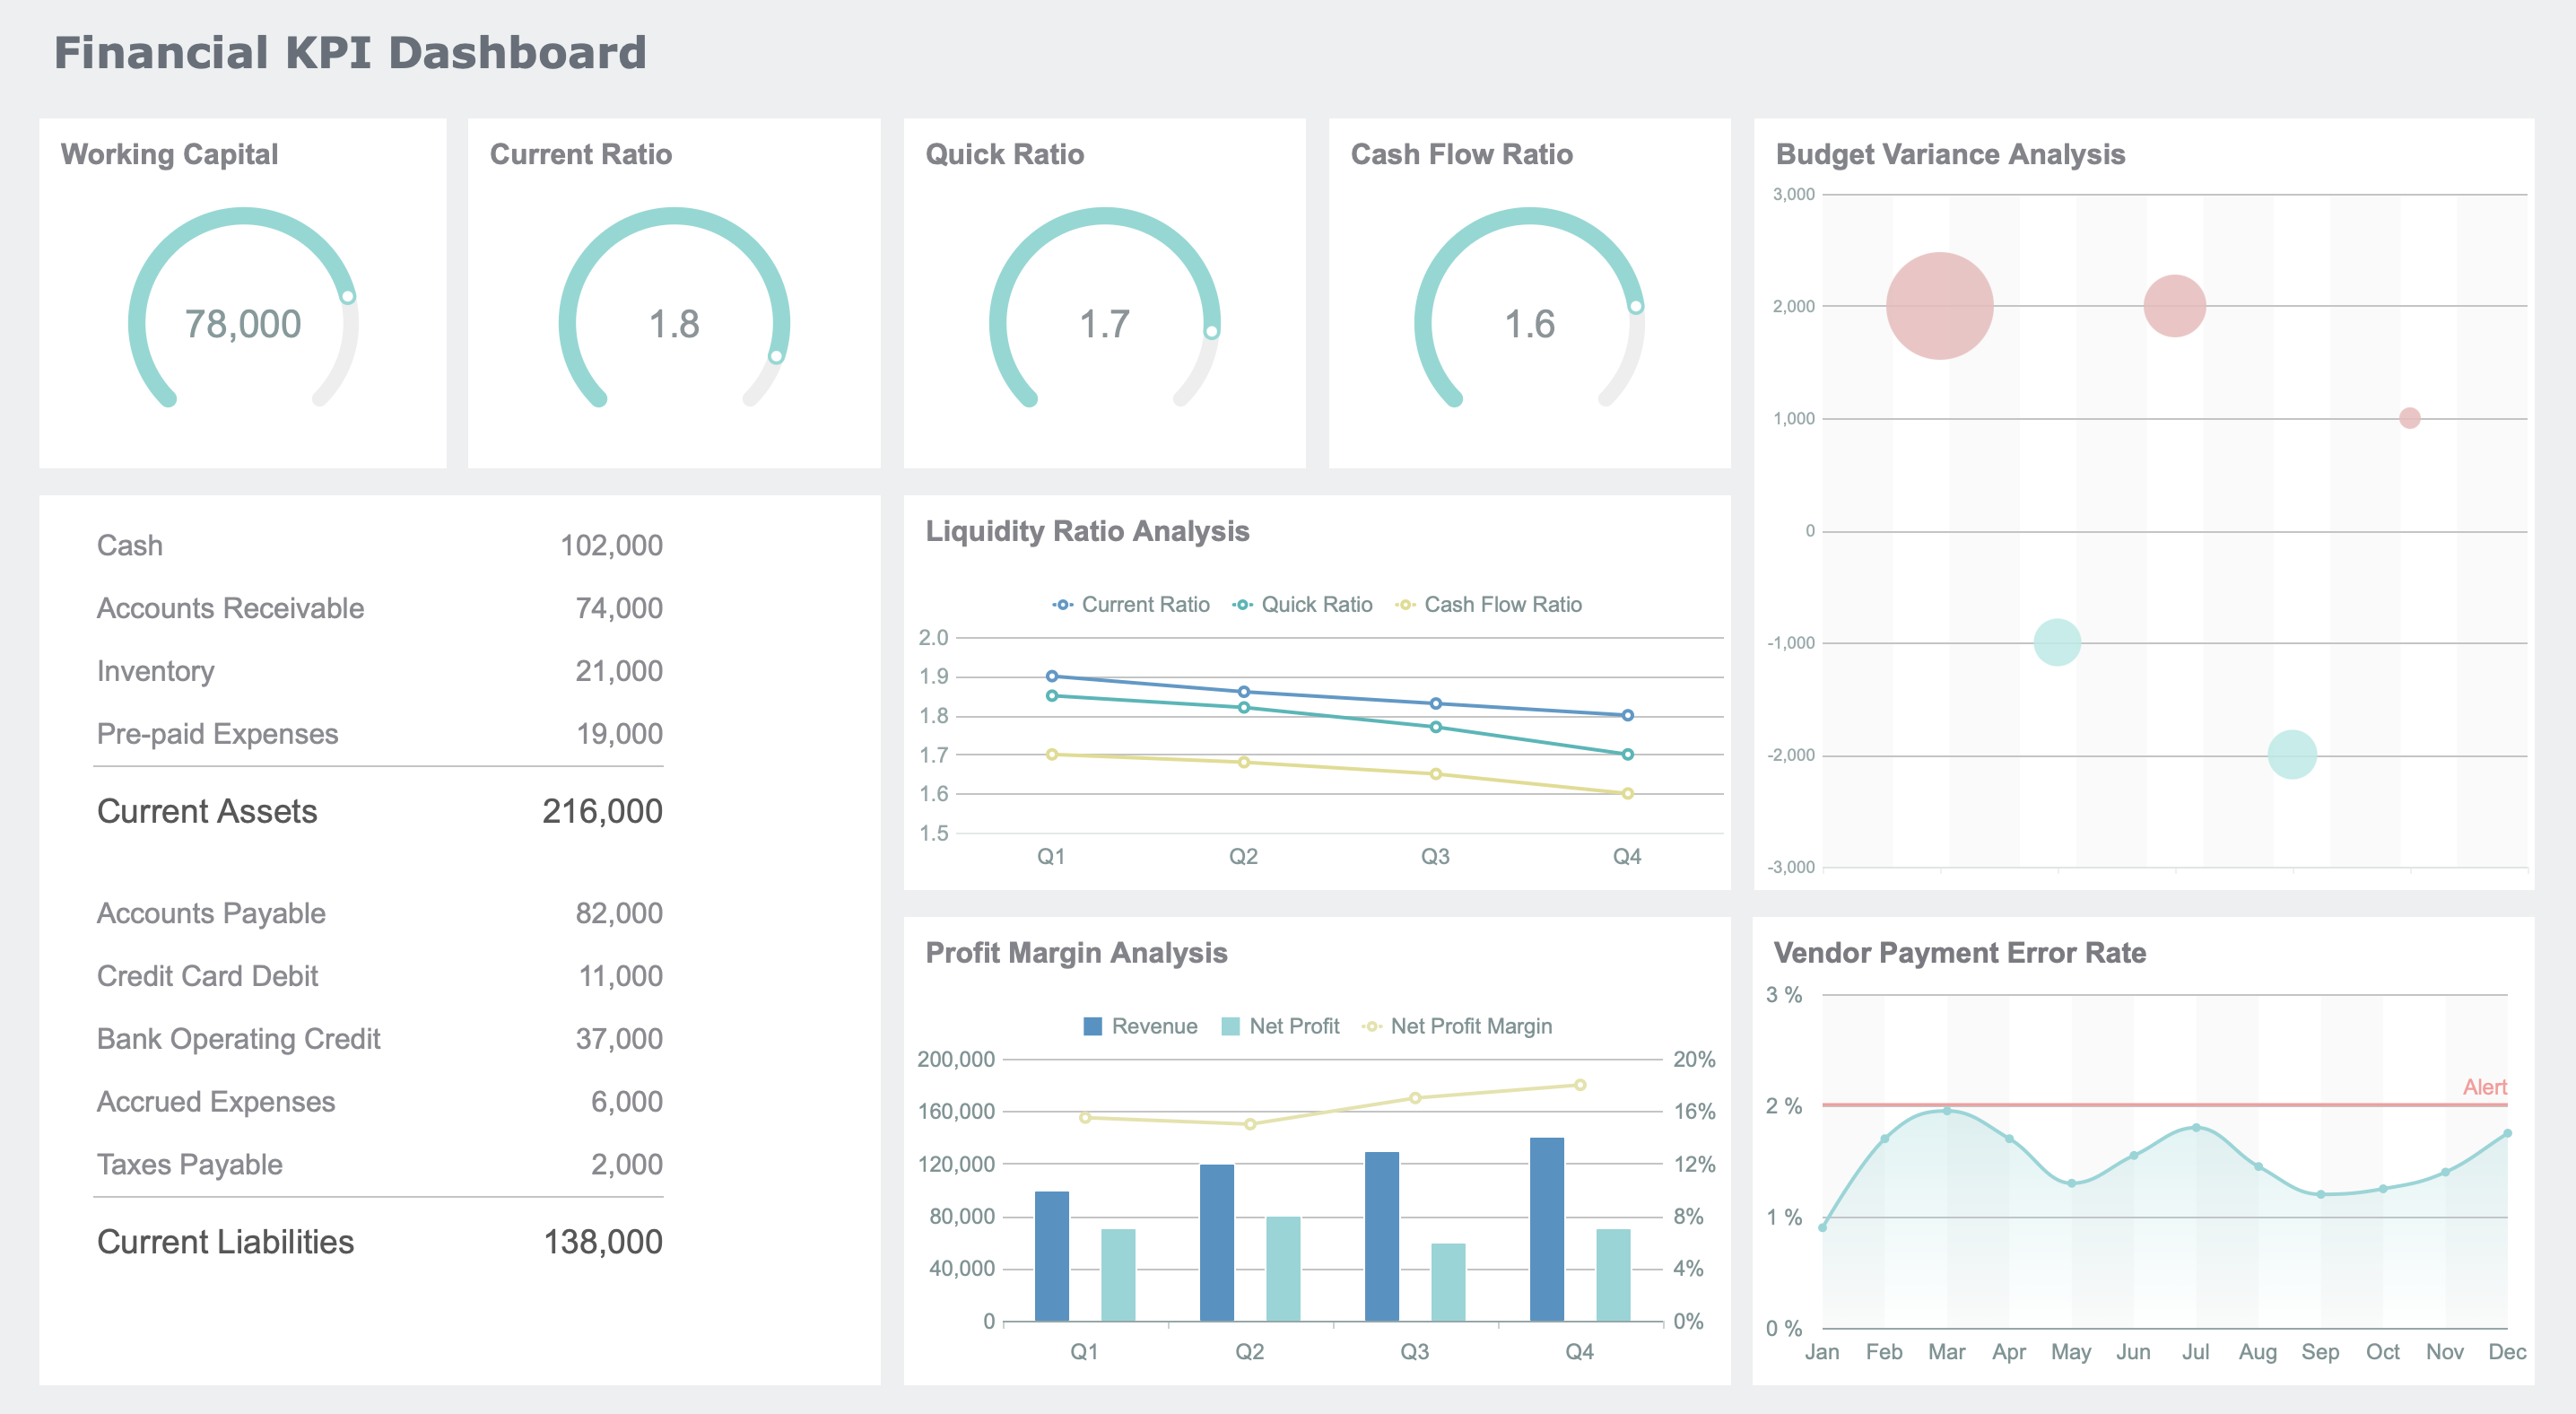
Alerts and notifications play a critical role in proactive decision-making. Real-time alerts notify you of process deviations, enabling immediate action. For example, smart sensors and machine learning algorithms provide early fault warnings, reducing unplanned downtime. Automated notifications also streamline quality control by alerting operators to potential issues before they escalate.
Case studies highlight the effectiveness of these features. In the pharmaceutical industry, AI technologies have transformed manufacturing processes by enabling real-time monitoring. This approach ensures timely interventions, improving both efficiency and product quality. With a comprehensive dashboard, you can stay ahead of challenges and maintain seamless operations.
Choosing the right tools is the first step in implementing an effective production dashboard. FanRuan offers two powerful solutions: FineReport and FineBI. Each tool caters to specific needs, ensuring you can address diverse operational requirements.
By combining FineReport and FineBI, you can create a unified platform that integrates seamlessly with your existing systems. This approach allows you to centralize data collection and analysis, reducing manual processing and enhancing decision-making. For example, integrating these tools with systems like ERP and MES ensures a comprehensive view of your operations, improving transparency and efficiency.
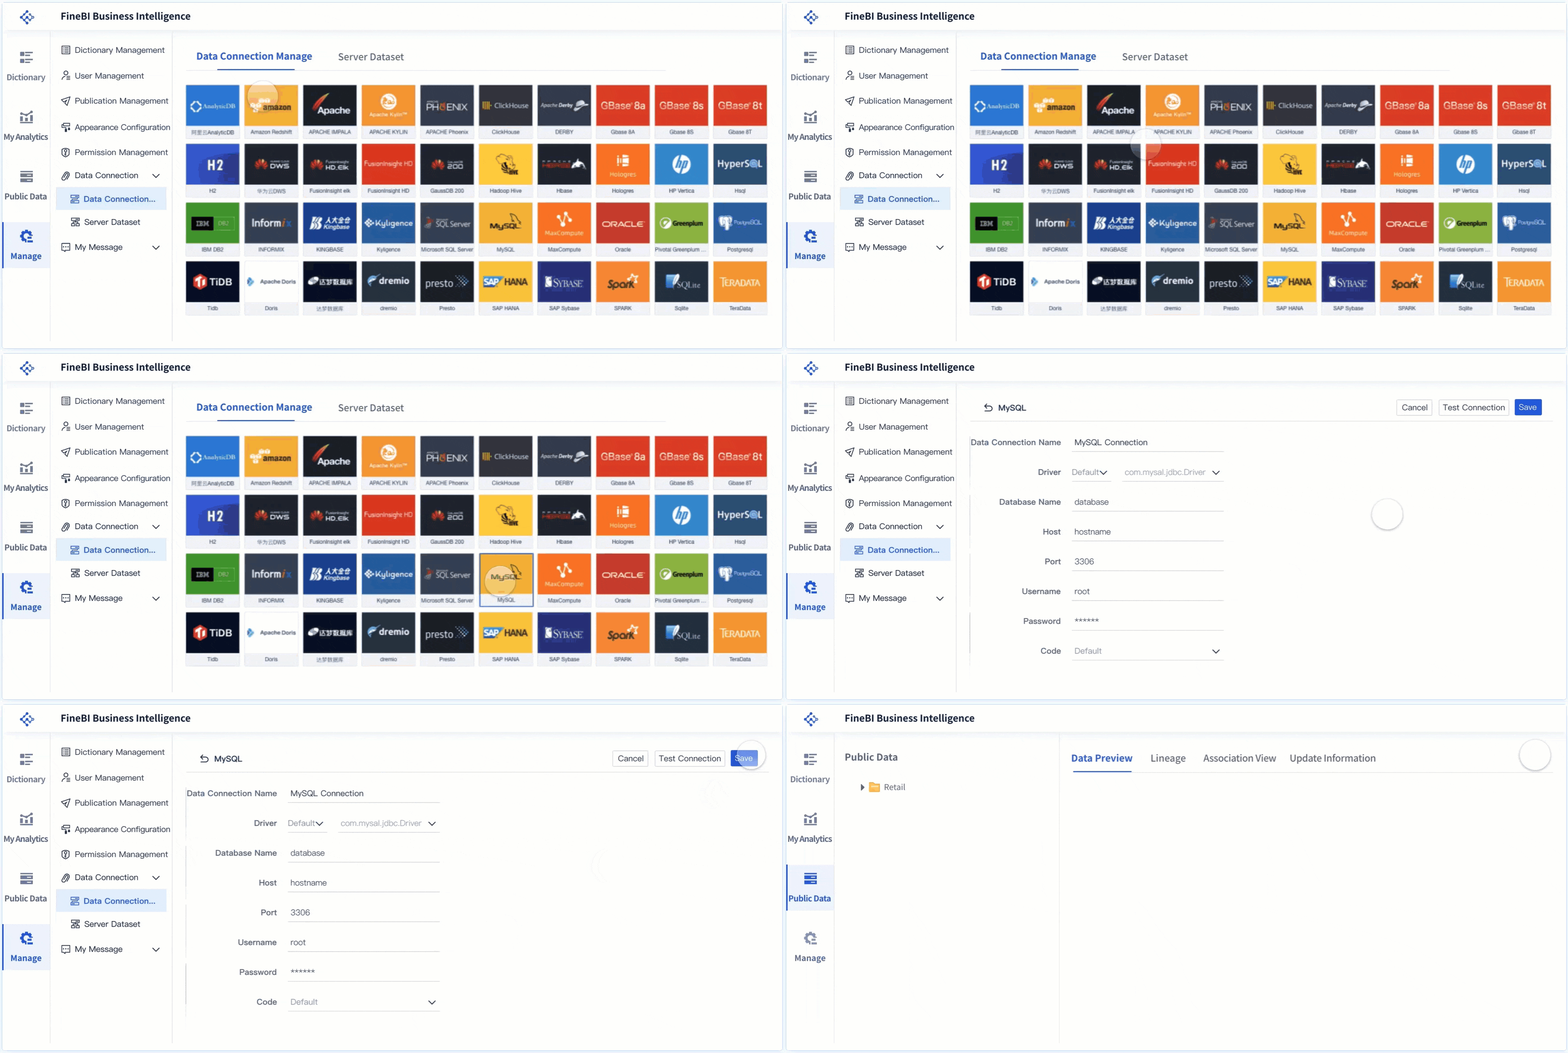
Also, FanRuan has established a localized team to provide comprehensive project implementation and technical support services. This local presence ensures faster response times, better alignment with regional business needs, and smoother deployment of products like FineReport and FineBI. Clients benefit from personalized assistance throughout the project lifecycle, from initial setup to post-deployment optimization.
Tip: Evaluate your organization's specific needs before selecting a tool. If your focus is on detailed reporting, FineReport is the way to go. For real-time insights and broader accessibility, FineBI is the better choice.
Implementing a production dashboard requires more than just software. You need well-structured teams and processes to maximize its potential. Start by defining clear roles and responsibilities for your team members. Assign tasks such as data collection, dashboard maintenance, and performance monitoring to ensure smooth operations.
By focusing on these metrics, you can enhance resource allocation and project management. Early identification of issues allows for prompt corrective actions, ensuring your production monitoring software operates efficiently.
Comprehensive training and onboarding are essential for the successful integration of production monitoring software. Begin by familiarizing your team with the features and functionalities of FineReport and FineBI. Interactive training sessions and hands-on workshops can help team members understand how to use the tools effectively.
FineReport's Production Management Dashboard offers a centralized platform to monitor and optimize your manufacturing processes. It consolidates data from multiple sources, providing a real-time view of production throughput, equipment performance, and resource utilization. This dashboard enables you to track production schedules, identify bottlenecks, and ensure smooth operations.
With its intuitive design, you can visualize key metrics like defective rates, machine occupancy, and cycle times. These insights help you make informed decisions to improve production throughput and reduce downtime. Here is an interactive demo of the production management dashboard created by FineReport. Click to experience it!
The Workshop Production Management Dashboard focuses on enhancing transparency and efficiency at the shop floor level. It simplifies information visibility, allowing you to track production throughput and monitor progress in real time. This clarity ensures that all stakeholders remain aligned during implementation management meetings.
By providing a visual representation of progress, the dashboard improves the transparency of reporting compared to verbal or email updates. Stakeholders can see the current status and schedules at a glance, making it easier to identify bottlenecks and address issues collaboratively. Click the interactive demo of the workshop production management dashboard created by FineReport to experience it!
The Procedure Production Monitoring dashboard enhances visibility into your production processes. It collects real-time production data, allowing you to identify inefficiencies immediately. Embedded analytics provide a detailed view of shop floor activities, helping you understand operations and detect potential issues like bottlenecks or defects.
By acting on these insights, you can streamline workflows and boost productivity. For instance, if a machine consistently underperforms, the dashboard highlights the issue, enabling you to schedule maintenance before it impacts production. This proactive approach ensures smoother operations and higher output quality of your production.
Note: Regularly reviewing this dashboard helps you maintain a productive and efficient manufacturing environment.
The Operation Dashboard in the Production Workshop provides a comprehensive view of your workflows. It visually represents processes, making it easier to identify delays and inefficiencies. For example, if a specific task takes longer than expected, the dashboard highlights the bottleneck, allowing you to take corrective action.
This dashboard also fosters collaboration by serving as a central platform for sharing information. Teams can access the same data, ensuring everyone works toward common objectives. By improving communication and resource management, you can achieve higher efficiency and maintain consistent production output. Click the following demo to experience it.
Callout: Use this dashboard to align your team’s efforts and ensure seamless operations across the workshop.
An Enterprise Product Sales Analysis dashboard transforms how you track sales and make decisions. It consolidates data from multiple sources, giving you a real-time view of key metrics. This centralized approach simplifies analysis and ensures you can act quickly on insights. For example, you can monitor sales performance across regions, products, or time periods, helping you identify trends and refine strategies.
Sales dashboards also enhance collaboration between teams. By providing a unified platform, they improve communication among sales, marketing, finance, and customer success teams. This alignment boosts efficiency and drives revenue growth. For instance, when sales teams share real-time data with marketing, campaigns can be adjusted to target high-performing products or regions.
Below is an interactive demo of FineBI's Enterprise Product Sales Analysis. Click to explore and experience the dynamic options firsthand.
Tip: Tailor your dashboard to specific roles and objectives. This customization ensures each team member accesses the most relevant data for their responsibilities.
Accurate and reliable data forms the backbone of effective manufacturing dashboards. Poor data quality can lead to costly errors and inefficiencies. For example, incomplete or outdated information may result in incorrect decisions, impacting your operations. To avoid this, use data quality dashboards to monitor metrics like accuracy, timeliness, and consistency. These tools allow you to identify and resolve issues proactively, ensuring high-quality data drives your processes.
Protecting your data is equally important. Implement robust security measures to prevent accidental loss or unauthorized access. Maintain a single working copy of your data while keeping an unaltered backup. This approach reduces duplicate data and ensures your team works with the most accurate information. Remember, reliable data leads to better analytics and smarter decisions.
Focusing on the right metrics ensures your dashboard aligns with your manufacturing objectives. Key performance indicators (KPIs) like overall equipment effectiveness (OEE), defect rates, and production throughput help you track progress and identify areas for improvement. For instance, monitoring OEE enables you to optimize machine performance and reduce downtime.
Relevant metrics also foster continuous improvement. By integrating KPIs into daily operations, you create a culture of performance and accountability. This approach enhances productivity, reduces costs, and improves quality. Additionally, tracking metrics like resource utilization and waste reduction helps you optimize raw materials and increase yield, ultimately boosting revenue of your production.
Periodic updates keep your dashboard aligned with evolving business needs. Review configurations weekly in highly regulated industries to detect compliance breaches immediately. In stable environments, quarterly updates provide a comprehensive view of long-term goals. Adjusting your dashboard based on these reviews ensures it remains effective and relevant.
| Update Frequency | Industry Type | Purpose of Update |
|---|---|---|
| Weekly | Highly regulated | Immediate detection of compliance breaches |
| Monthly | General compliance | Broader perspective on compliance performance |
| Quarterly | Stable environments | Comprehensive reviews for long-term compliance goals |
Regular updates also improve data accuracy and usability. By refining configurations, you ensure your team accesses the most relevant insights, enabling timely and informed decisions.
A production dashboard transforms manufacturing by enhancing real-time monitoring and operational efficiency. It reduces downtime, improves quality, and accelerates production cycles. For example, industries like automotive and pharmaceuticals have achieved remarkable results:
| Case Study | Industry | Improvement | Result |
|---|---|---|---|
| A | Automotive | Downtime Reduction | 15% decrease in machine idle time |
| B | Pharmaceuticals | Production Yield | 8% increase in output quality |
| C | Consumer Goods | Efficiency | 12% faster production cycle times |
FanRuan solutions like FineReport and FineBI empower you to harness these benefits. By adopting data-driven tools, you can stay competitive and thrive in the evolving manufacturing landscape.
Click the banner below to experience FineReport and FineBI for free and empower your enterprise to convert data into productivity!
Production Dashboard: Optimize Your Production And Manufacturing

The Author
Lewis
Senior Data Analyst at FanRuan
Related Articles

What is an ERP Dashboard and How Does It Work
An ERP dashboard displays real-time business data, helping you track key metrics, spot trends, and make informed decisions from one central platform.
Lewis
Jan 14, 2026
What is Project Portfolio Dashboard and Why is It Important
A project portfolio dashboard centralizes project data, offering real-time insights for better decisions, resource management, and strategic alignment.
Lewis
Jan 13, 2026

How to Create a Project Tracking Dashboard Step by Step
Create a project tracking dashboard step by step to centralize data, monitor progress in real time, and boost team alignment for project success.
Lewis
Jan 13, 2026