Box plot generator made easy for free online means you can create professional box plots without paying or learning complex software. You just upload your data and get results in seconds. FineBI stands out as a top choice because you do not need any technical skills and the process is quick and simple.
You have other options, too. Some popular tools include:
- FineBI
- GeoGebra
- AI Box Plot Generator
- Plotly
- Desmos
- Meta-Chart
- ChartGo
- MathCracker
- RapidTables
Try FineBI or any of these free solutions to see how fast and easy box plot creation can be.
Choose a Box Plot Generator
1.FineBI Box Plot Generator Overview
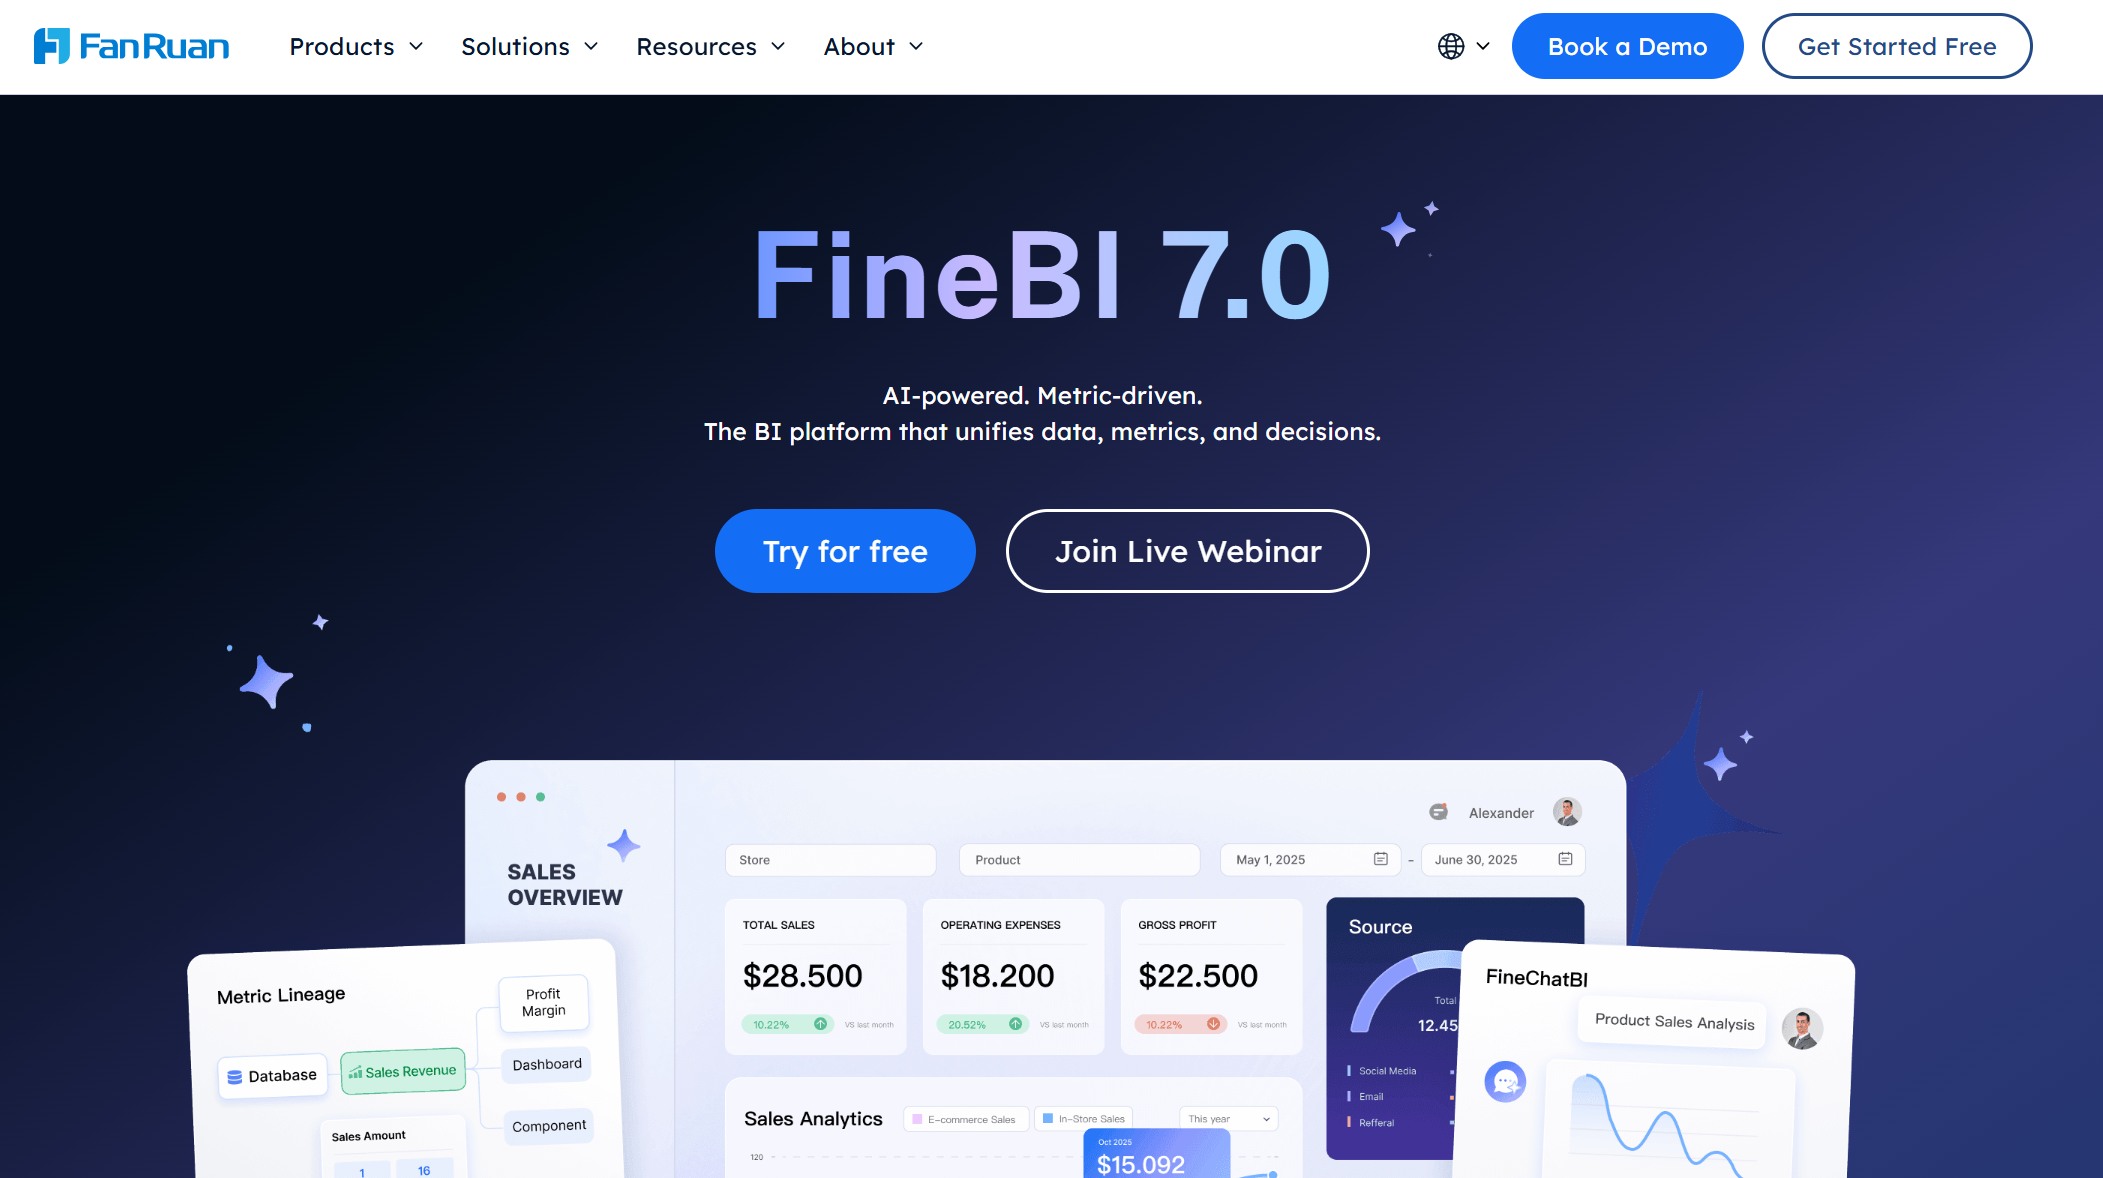
Website: https://www.fanruan.com/en/finebi
FineBI stands out as an enterprise-grade box plot generator. You can use FineBI to connect to many data sources, including databases, Excel files, and big data platforms. The workflow guides you through data integration, processing, and visualization. You can create interactive dashboards with drag-and-drop simplicity. FineBI supports real-time filtering, advanced analytics, and secure sharing. You do not need coding skills to build box plots or other charts. This tool is ideal for business users, data analysts, and researchers who want a powerful data visualization tool for statistical analysis.
Key Features:
- Connects to over 60 data sources
- Drag-and-drop dashboard creation
- Real-time interactive box plot generator
- Role-based access control for secure sharing
- Augmented analytics and AI-driven insights
Pros:
- User-friendly interface
- Handles large datasets efficiently
- Supports advanced statistical visualization
- Enables team collaboration
Cons:
- Best suited for organizations or advanced users
Ideal User Profile:
You should choose FineBI if you need enterprise-level features, advanced analytics, and secure collaboration for your data projects.
Tip: FineBI offers a free trial so you can explore its capabilities before making a commitment.
2.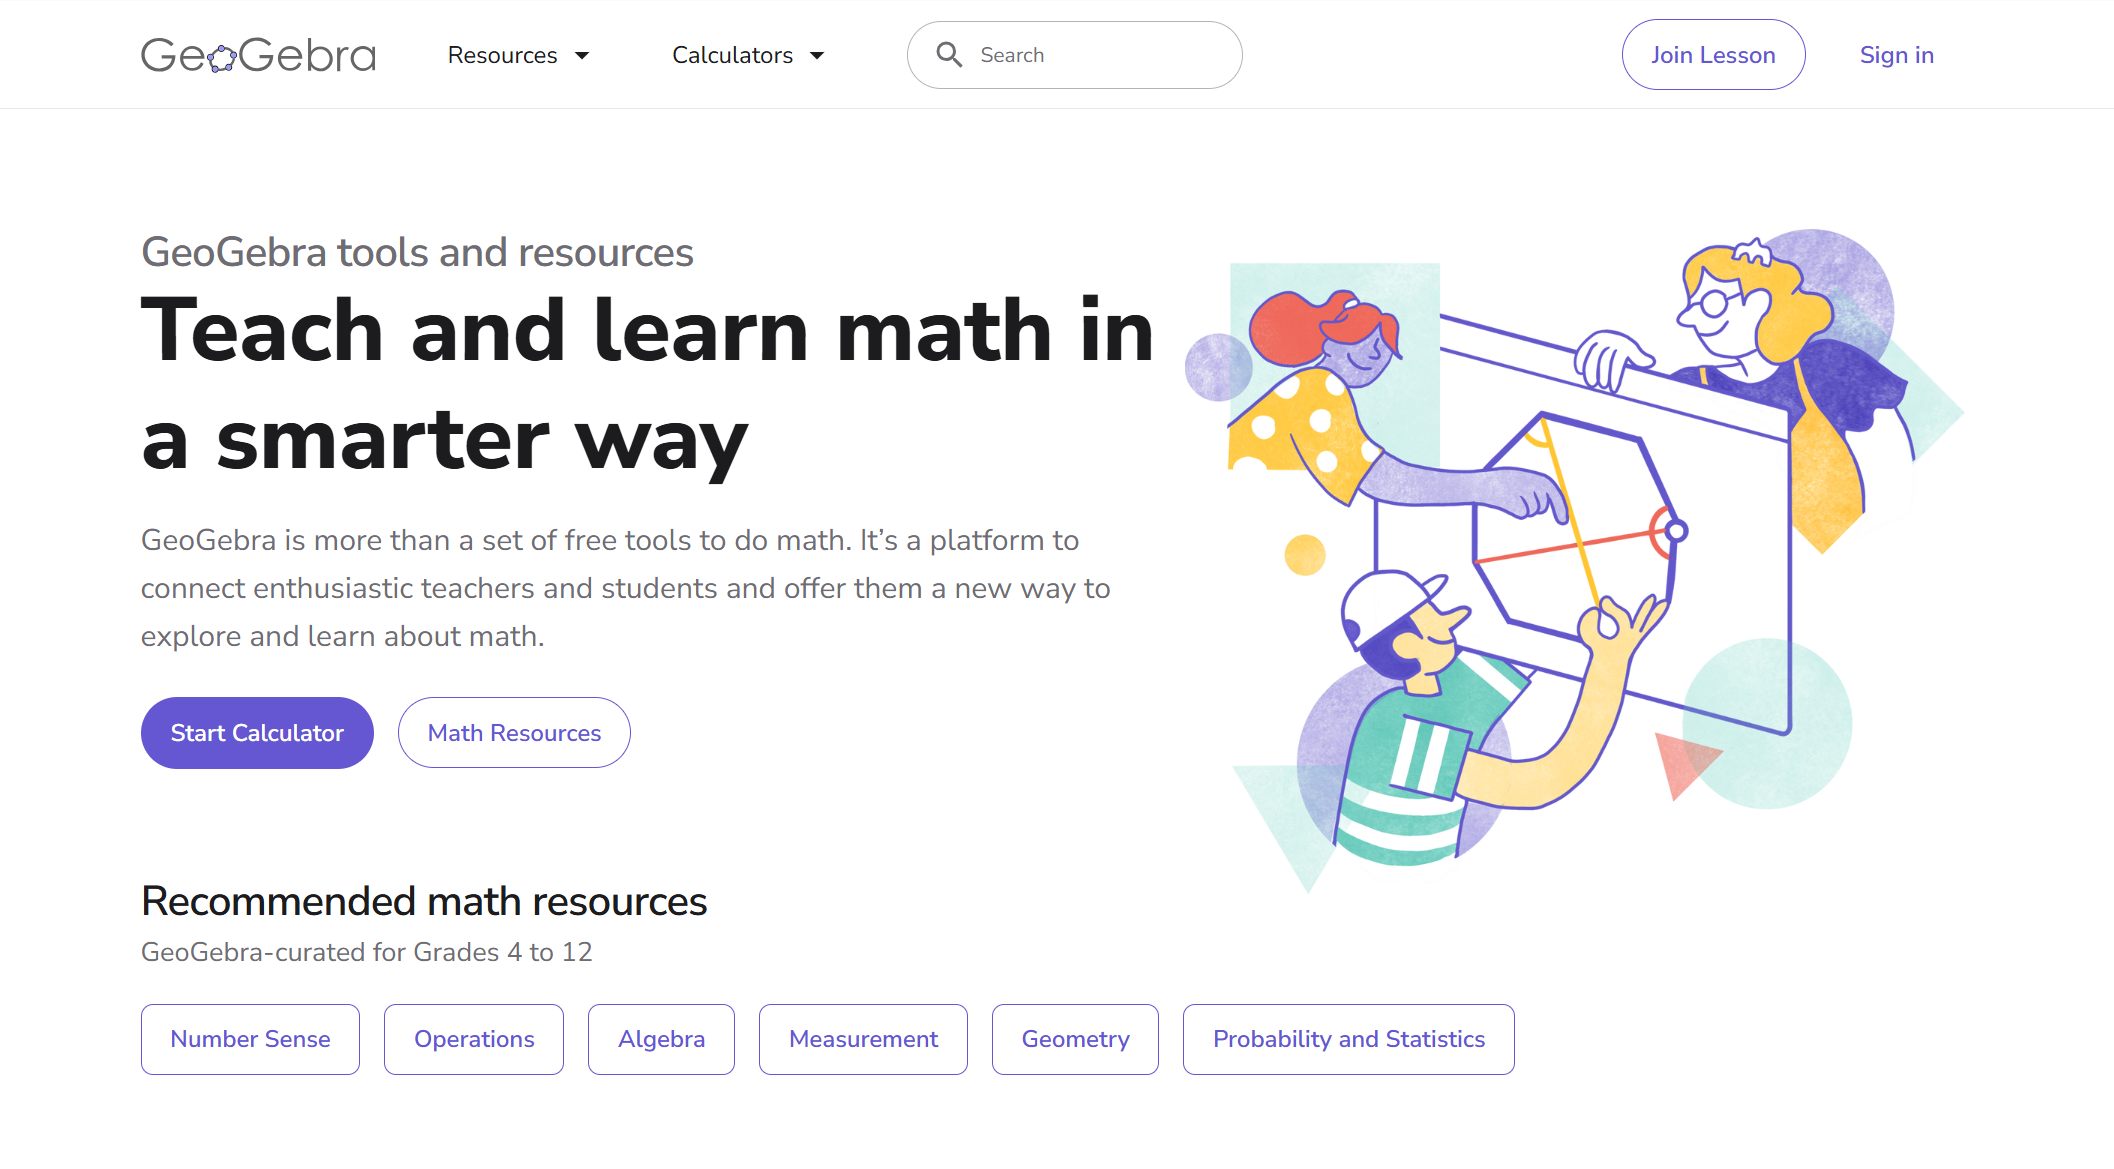 Online Box Plot Generator
Website: https://www.geogebra.org/
GeoGebra is a popular online box plot generator for students and teachers. You can visualize complex mathematical concepts and see results instantly. The tool lets you adjust graphs by dragging points, which saves time compared to manual changes. Many students find this feature helpful for learning statistics. However, you may experience slow loading times or software crashes. Troubleshooting can be difficult without support.
Key Features:
- Immediate visual feedback
- Drag-and-drop graph adjustments
- Free access for educational use
Pros:
- Interactive and engaging for students
- Simple box plot creation
- Supports mathematical exploration
Cons:
- Occasional technical issues
- Limited support for troubleshooting
Ideal User Profile:
GeoGebra works well for students and teachers who want a user-friendly box and whisker plot maker for classroom activities.
3.AI Box Plot Generator

Website: https://www.edraw.ai/feature/online-box-plot-generator.html
AI Box Plot Generator uses artificial intelligence to make box plot creation fast and accurate. You can automate the process and reduce errors. The tool analyzes your data and produces visualizations quickly. You can customize your box plots without needing technical expertise.
| Evidence Description | Explanation |
|---|---|
| Streamlined Process | The AI Box Plot Generator automates the creation of box plots, making the process more efficient and user-friendly. |
| Time-Saving | It quickly analyzes data and produces visual representations, saving time compared to manual methods. |
| Error Reduction | Automation reduces the potential for errors that can occur with traditional manual calculations. |
| Customization Options | Users can easily tailor the generated plots to their needs without needing extensive technical expertise. |
Pros:
- Fast and efficient
- Reduces manual errors
- Customizable output
Cons:
- May require internet access for full features
Ideal User Profile:
You should use this tool if you want to save time and get accurate box plots with minimal effort.
4.Plotly Online Box Plot Generator

Website: https://plotly.com/
Plotly is a well-known online box plot generator for interactive data visualization. You can zoom, pan, and hover to explore your data. Tooltips and annotations help you understand your results. Plotly supports summary statistics and outlier detection.
- Interactive features such as zooming, panning, and hovering allow users to explore data thoroughly.
- Tooltips and annotations provide additional context, enhancing data comprehension.
- The inclusion of statistical charts like box plots aids in the exploration and presentation of data.
- Seamless integration with Plotly Express for easy use.
- Extensive customization options for crafting visually appealing box plots.
- Ability to explore outliers and present summary statistics effectively.
Pros:
- Highly interactive
- Extensive customization
- Supports advanced statistical analysis
Cons:
- May require registration for some features
Ideal User Profile:
Plotly is perfect for researchers and students who need interactive box plot generators for detailed data exploration.
5.Desmos Box Plot Generator
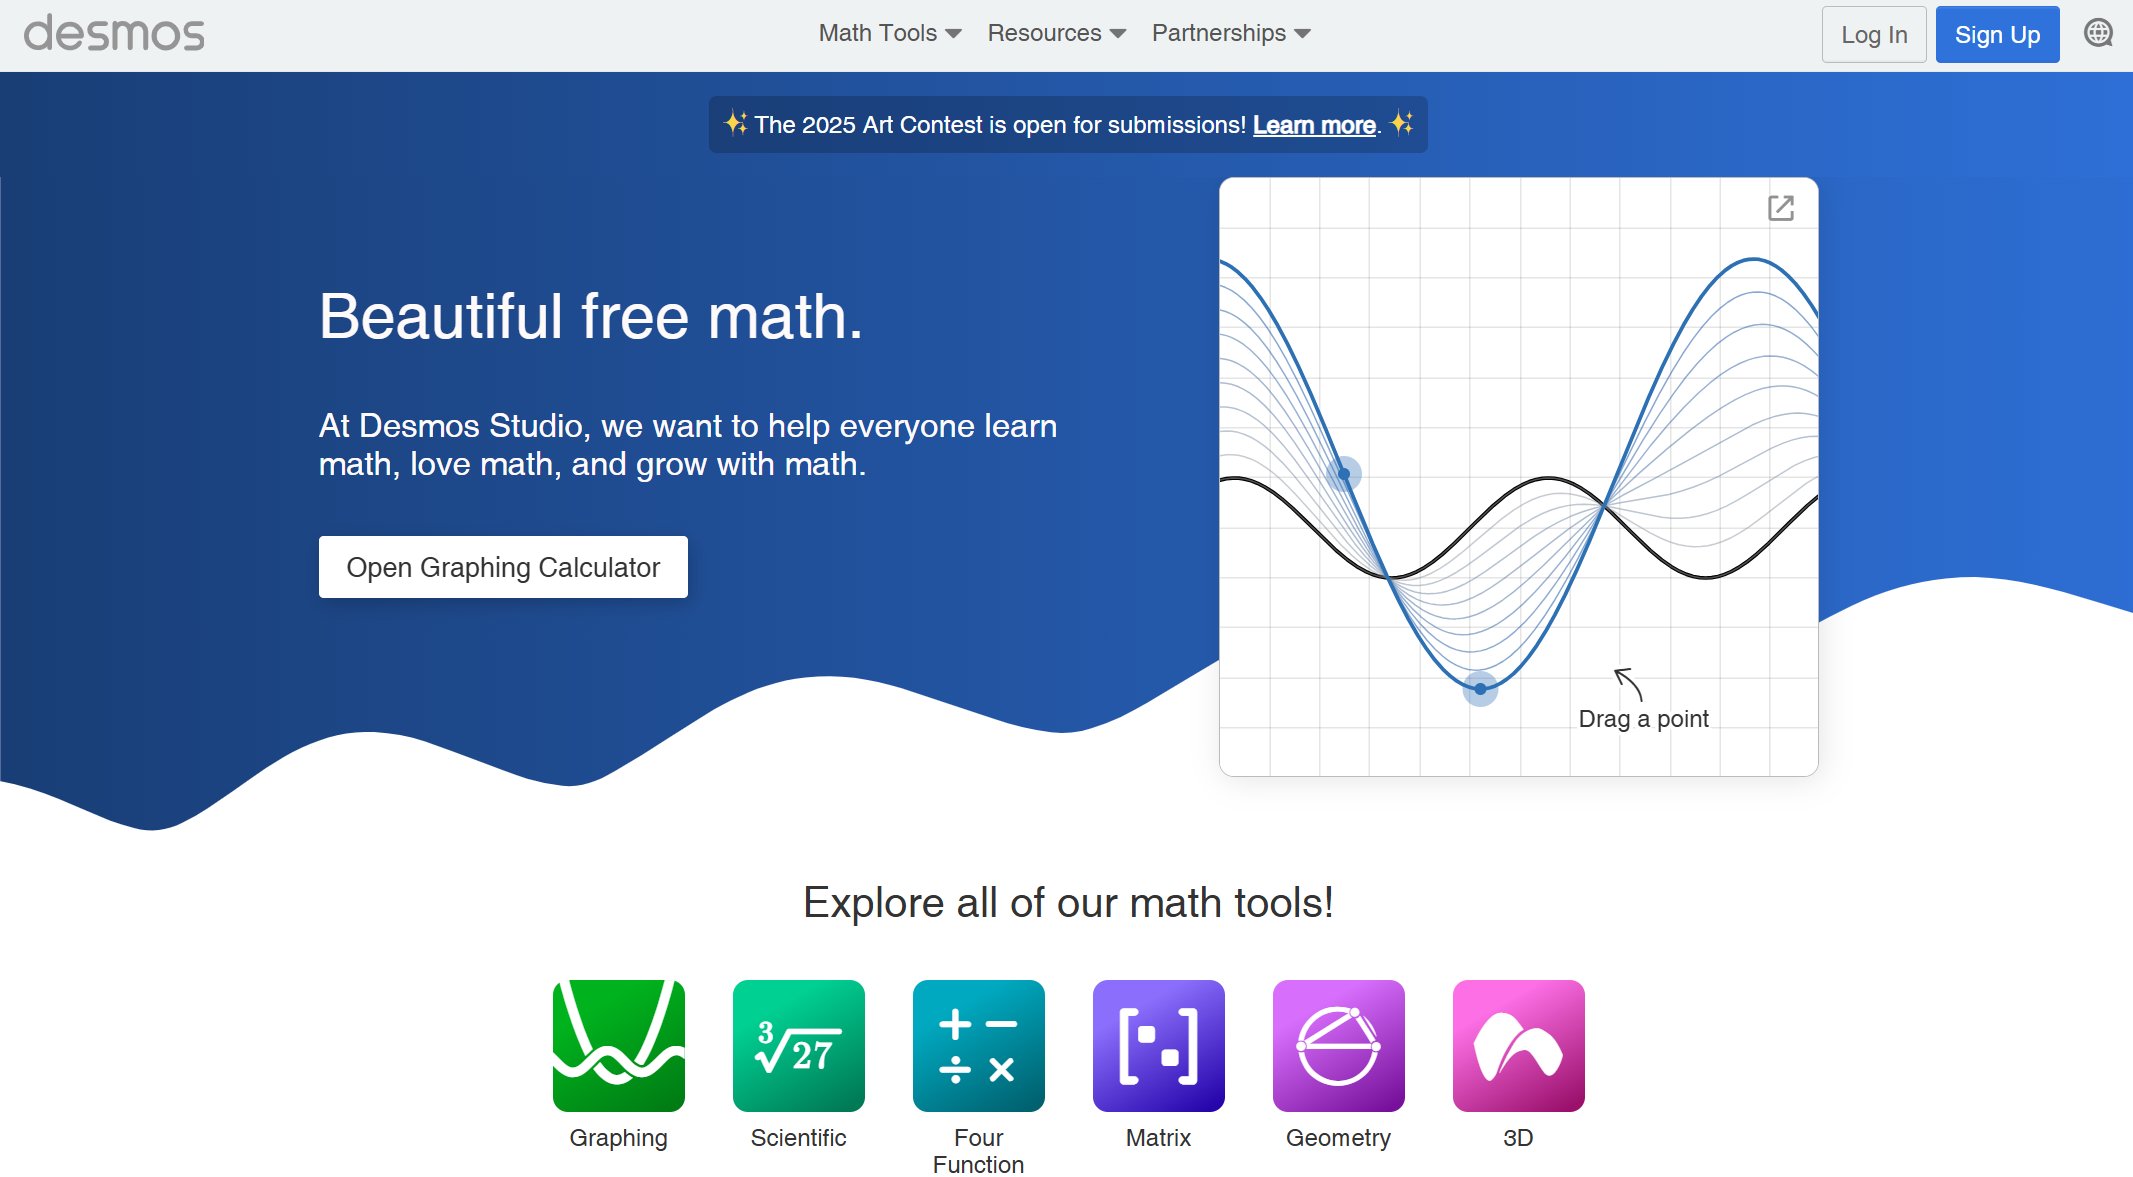
Website: https://www.desmos.com/
Desmos offers a free online box plot generator that is popular in classrooms. You can input data and see dynamic changes in your box plot. The tool is interactive and supports unlimited editing. Desmos is easy to use and helps you visualize statistics concepts.
Key Features:
- Dynamic data input
- Unlimited editing
- Free access
Pros:
- Interactive and engaging
- Simple interface
- Great for learning statistics
Cons:
- Limited export options
Ideal User Profile:
Desmos is best for students and teachers who want a user-friendly tool for statistical visualization.
6.Meta-Chart Box Plot Generator
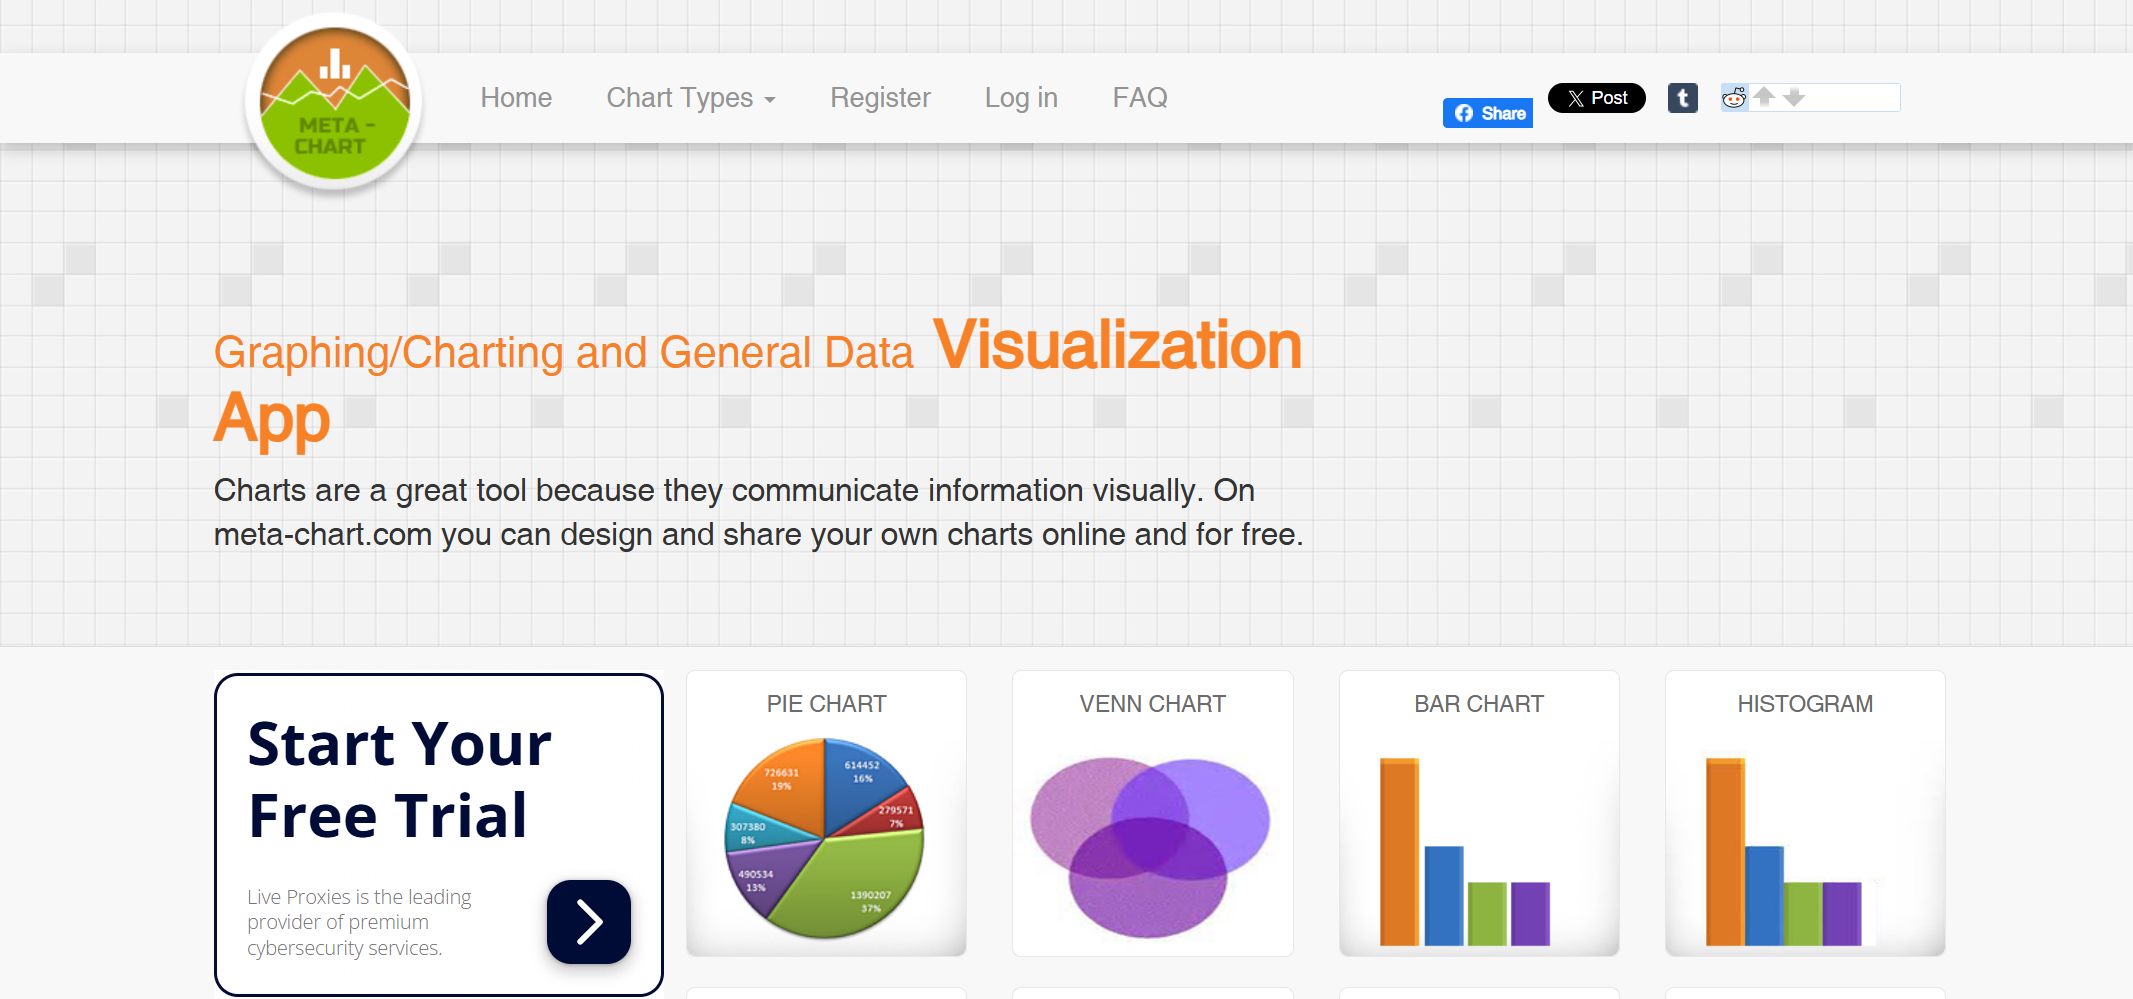
Website: https://www.meta-chart.com/
Meta-Chart is a box plot generator that offers strong customization options. You can detect outliers, adjust whisker styles, and compare multiple groups. Meta-Chart is easy to use and supports various data formats.
| Feature | Meta-Chart Box Plot Generator | DataStatPro Box Plot Generator |
|---|---|---|
| Outlier Detection | Yes | Yes |
| Customizable Whisker Styles | Yes | Yes |
| Multiple Group Comparisons | Yes | Yes |
Pros:
- Flexible customization
- Supports group comparisons
- Detects outliers
Cons:
- May have a learning curve for advanced features
Ideal User Profile:
Meta-Chart is ideal for users who need detailed customization and advanced statistical analysis software.
7.ChartGo Box Plot Generator
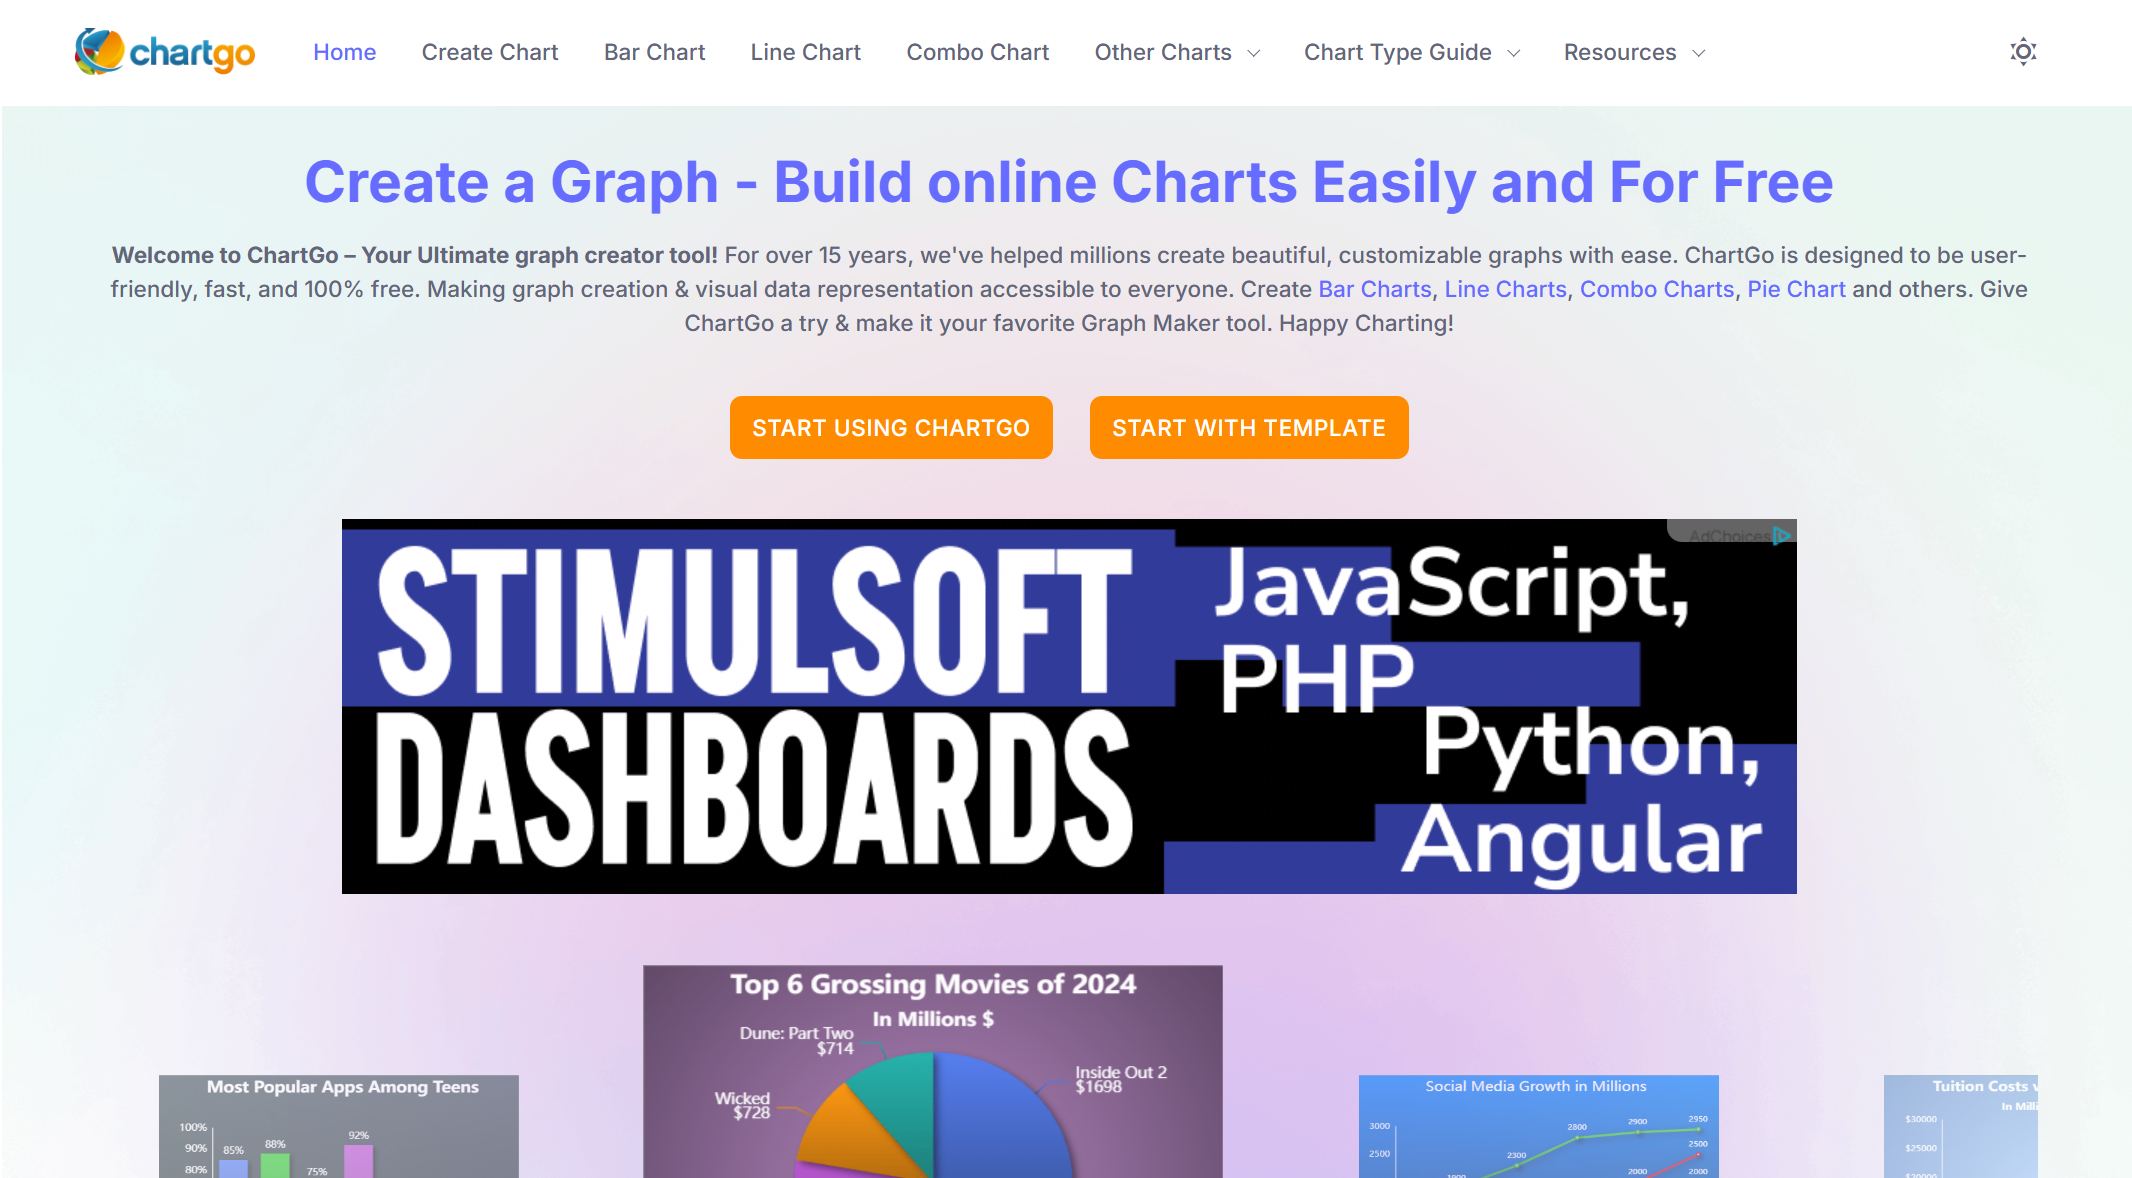
Website: https://www.chartgo.com/home.html
ChartGo is an online box plot generator that focuses on simplicity. You can create box plots quickly by entering your data. The tool is user-friendly and works well for basic visualization needs.
Key Features:
- Simple data entry
- Fast box plot creation
- Free to use
Pros:
- Easy to use
- Quick results
- No registration required
Cons:
- Limited advanced features
Ideal User Profile:
ChartGo is suitable for users who want simple box plot creation without extra complexity.
8.MathCracker Box Plot Generator
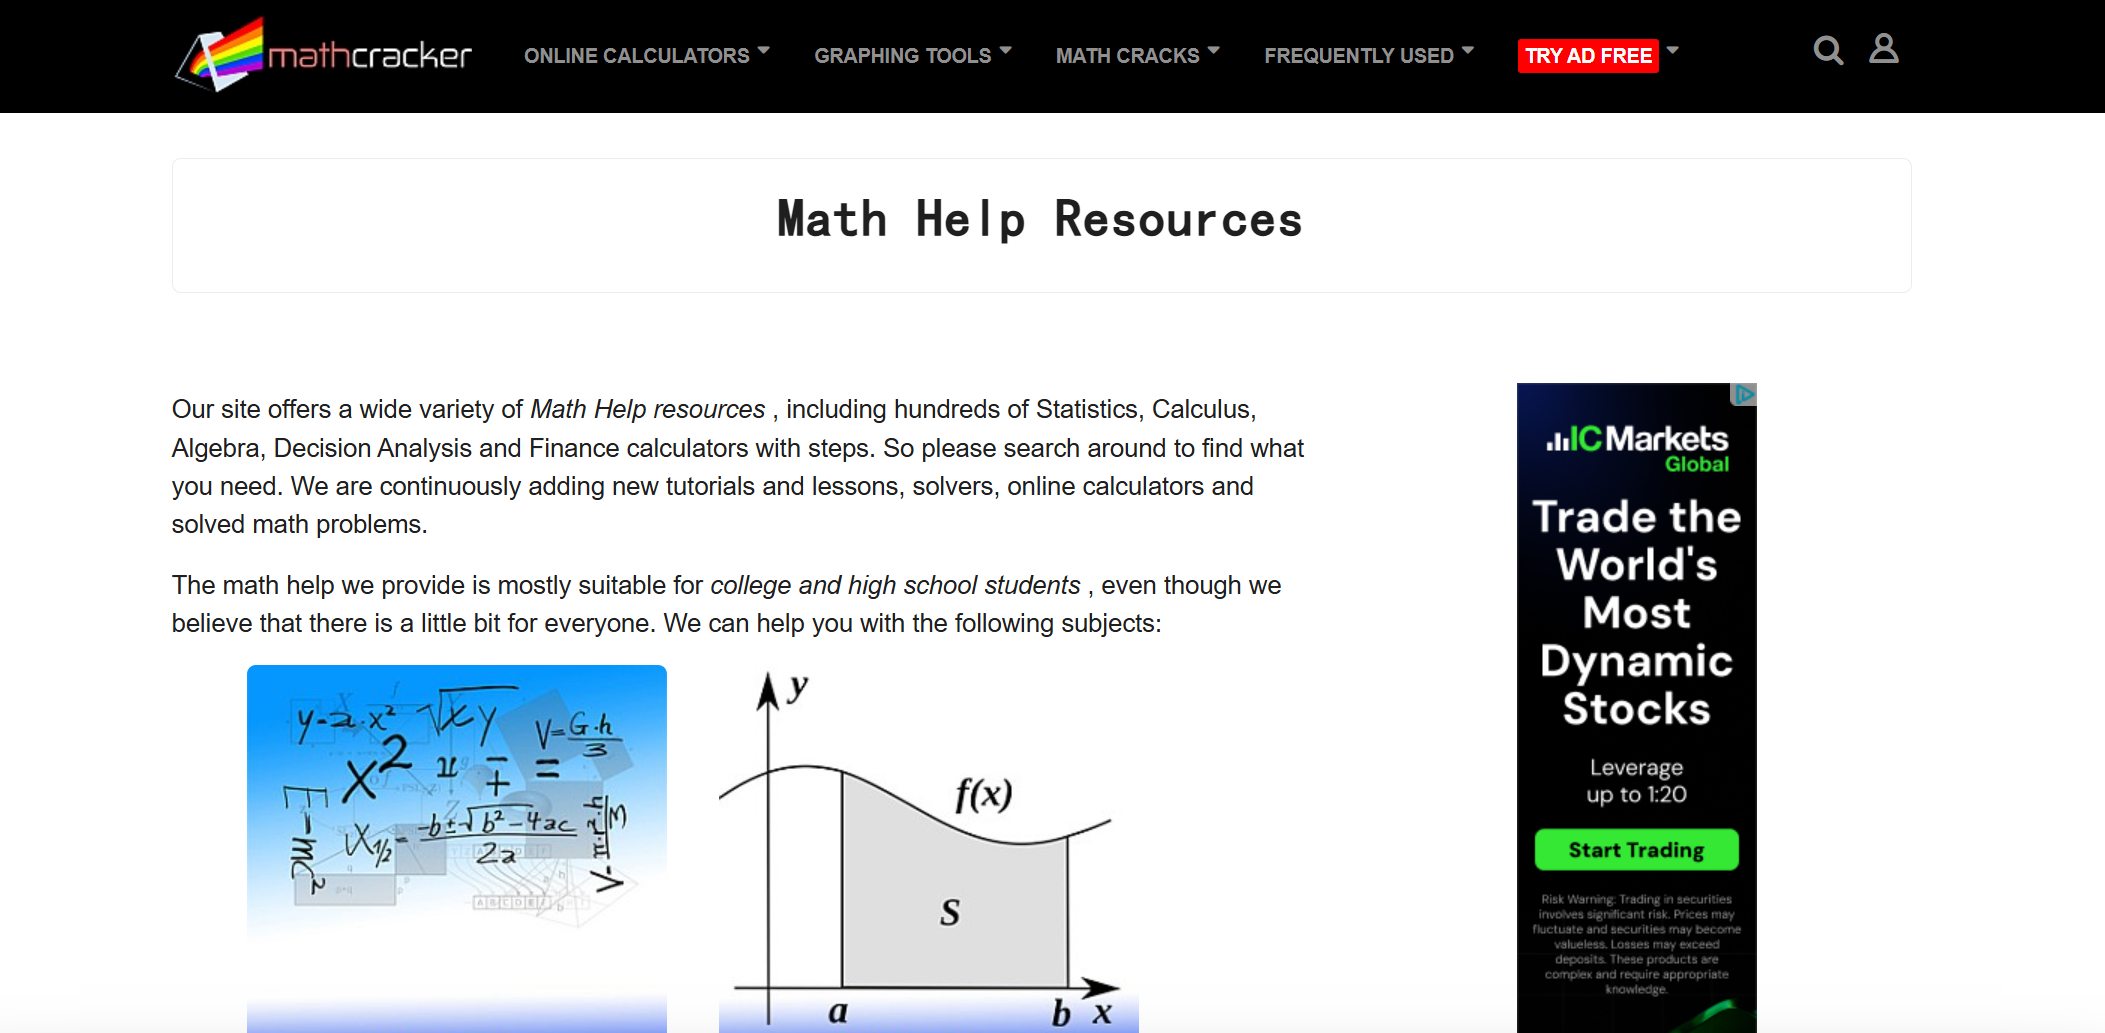
Website: https://mathcracker.com/
MathCracker helps you learn statistics by visualizing your data. You can input data from Excel and see each step of the box plot creation. The tool highlights quartiles and outliers, making statistical concepts easier to understand.
- Users can input data directly from Excel.
- The tool constructs the box plot graphically, showing each step of the process.
- It highlights key statistical features like quartiles and outliers.
MathCracker is designed to help students visualize and understand statistical concepts by allowing them to create box plots from their data. This visualization aids in grasping the distributional properties of a sample, such as quartiles and outliers, which are fundamental in statistics.
Pros:
- Educational focus
- Step-by-step visualization
- Highlights key statistics
Cons:
- May be less suitable for advanced users
Ideal User Profile:
MathCracker is best for students who want to learn statistics and see how box plots represent data distributions.
9.RapidTables Box Plot Generator
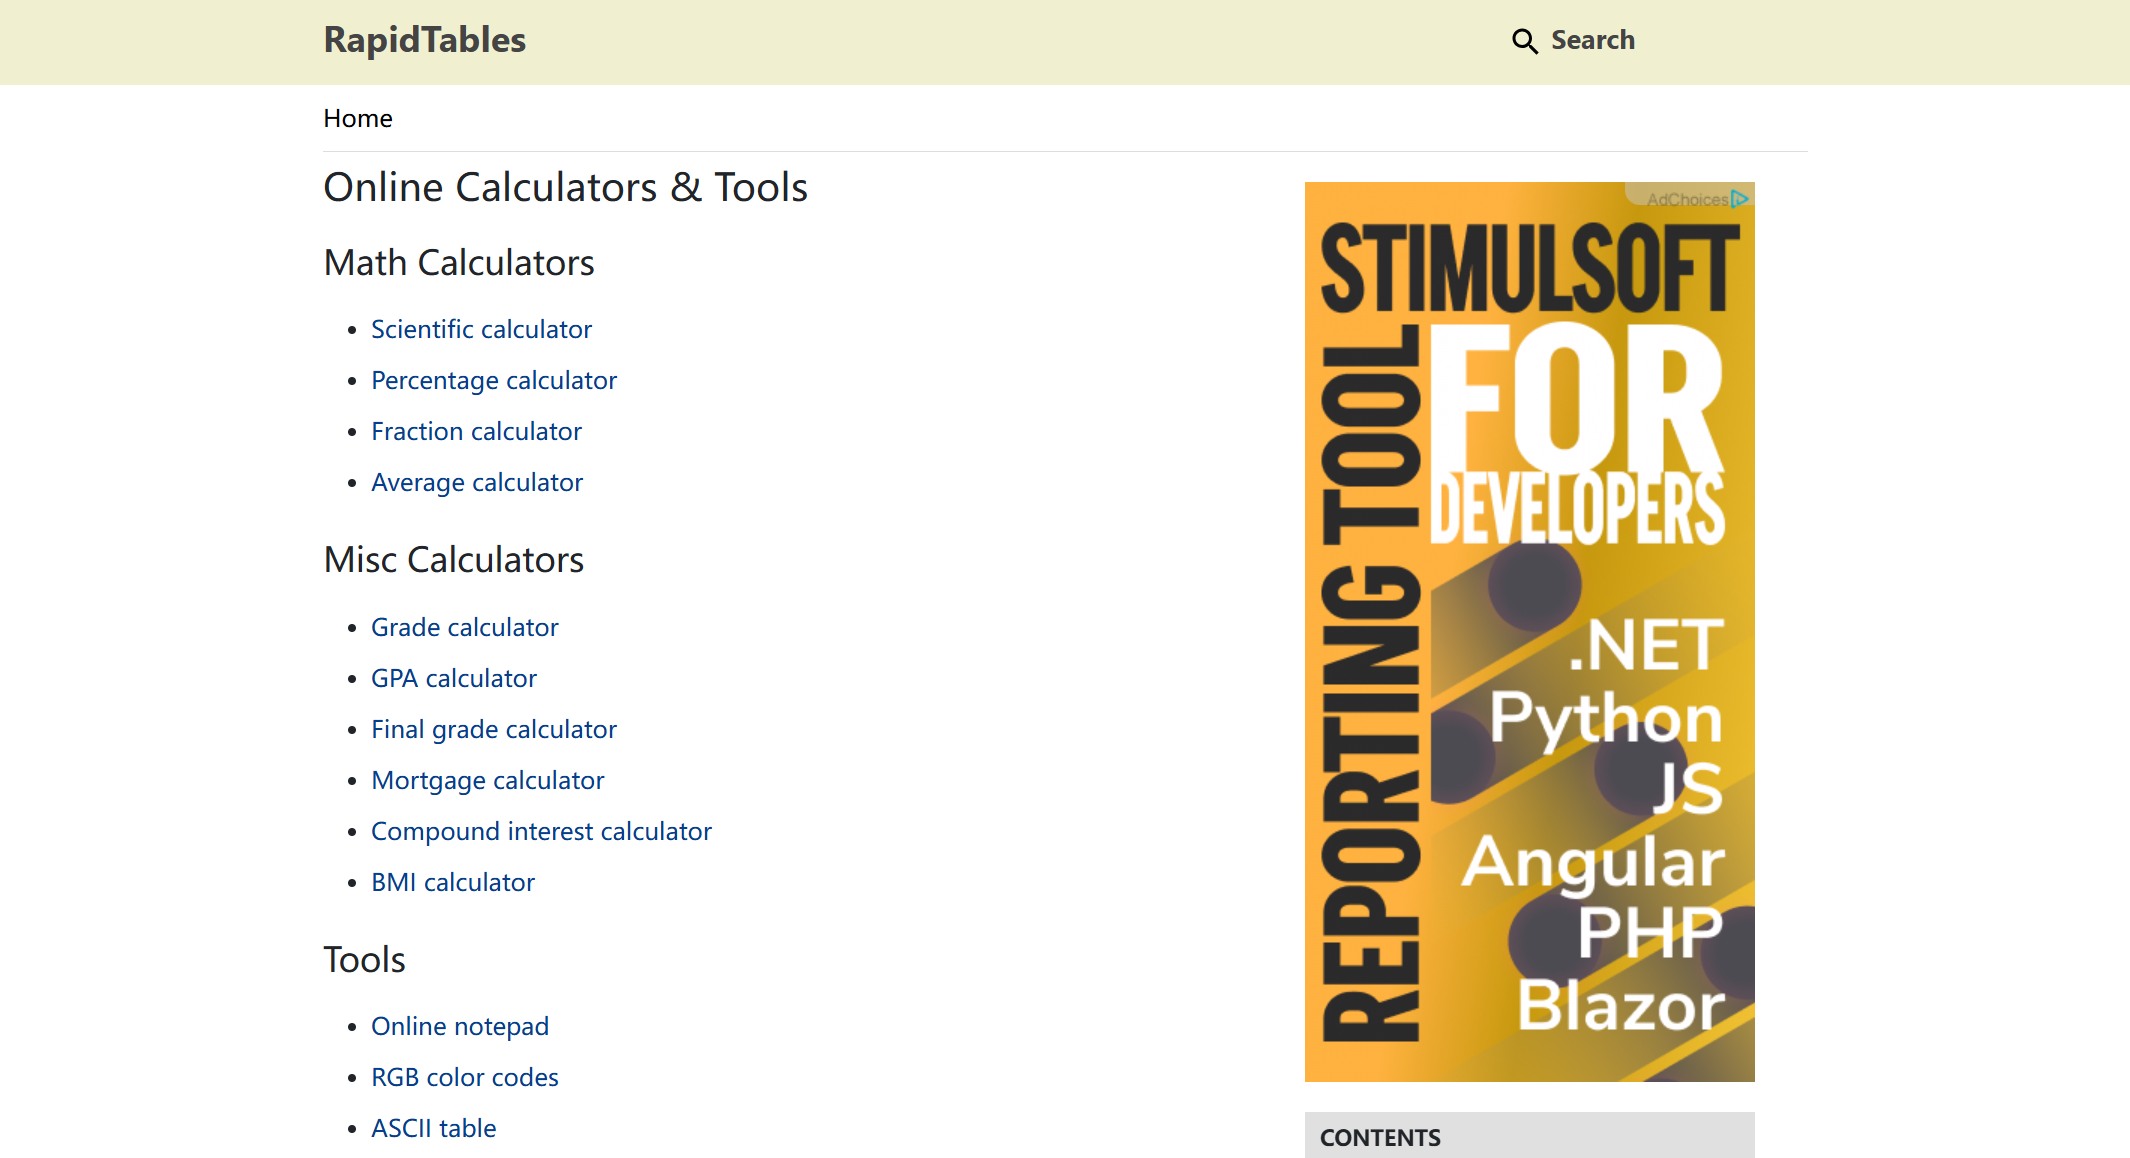
Website: https://www.rapidtables.com/
RapidTables is a straightforward box plot generator for quick results. You can enter your data and get a box plot instantly. The tool is easy to use but has some limitations.
| Limitation | Description |
|---|---|
| Assumes Symmetry | Box plots assume symmetric distributions, which may not always hold. |
| Not Ideal for Small Samples | With very few data points, box plots might not provide enough information. |
| Doesn't Show Exact Data Points | Unlike scatter plots, box plots don't display individual data points. |
Pros:
- Fast and simple
- No registration needed
Cons:
- Limited detail for small samples
- Does not show individual data points
Ideal User Profile:
RapidTables is great for users who want a quick and easy box plot generator for basic statistical visualization.
Selection tips
Picking the right box plot generator depends on what you need. Here are some features to look for:
| Feature | Description |
|---|---|
| Ease of Use | Build interactive box plots in minutes, without writing a single line of code. |
| Interactivity | Let viewers explore categories themselves with filter controls and time sliders. |
| Customization Options | Choose how far whiskers extend or remove them completely. |
| Automatic Calculations | Automatically calculate and display key values like the median and range. |
| Mobile-ready Design | Charts are responsive and animated, so they look great on any screen. |
| Flexible Layouts | Switch between vertical and horizontal box plots with a single click. |
| Best Practices for Comparison | Box plots are compact and effective for comparing distributions between multiple groups. |
You should check if the box plot generator supports your data format. Look for customization options and interactive features. Make sure the tool works well on your device. If you want to compare several groups or need advanced settings, choose a generator that offers those features. FineBI covers all these points, so you can focus on your analysis instead of struggling with the software.
Prepare Your Data For Box Plot Generator
Getting your data ready is the first step to making the most of any box plot generator. FineBI makes this process smooth, even if your data comes from different places. You can connect to databases, Excel files, CSVs, APIs, or even big data platforms. FineBI brings all your information together, so you do not have to worry about switching between tools.
Data formats
Most free online box plot generators accept a range of data formats. You can usually upload files or paste your data directly. Here’s a quick look at what you’ll find:
| Feature | Description |
|---|---|
| Data Input | Enter data using commas or line breaks. |
| Data Separation | Separate values with Enter or comma for easy upload. |
| Export Formats | Download your results in multiple formats for sharing or reports. |
FineBI supports all these formats and more. You can upload Excel or CSV files, connect to databases, or pull data from APIs. This flexibility means you can use whatever data you already have.
Organizing tips
Clean, well-organized data helps you get accurate box plots. Here are some tips to keep things simple:
- Use clear column names, like "Group" and "Value."
- Remove any empty rows or columns before uploading.
- Make sure all values are numeric if you want to plot them.
- Double-check for typos or inconsistent formatting.
FineBI's built-in data cleaning tools let you edit field names, handle missing values, and standardize formats. You can preview your data before you create your box plot, so you catch mistakes early.
Common mistakes
It’s easy to make small errors when preparing data for a box plot generator. Watch out for these:
- Setting whiskers to the wrong range. Whiskers should reach the smallest and largest data points within the correct limits.
- Forgetting to mark outliers. Outliers should stand out, or your plot might mislead viewers.
- Assuming symmetry. If your data is skewed, the box plot will show it—don’t ignore the median’s position or whisker lengths.
FineBI’s workflow helps you avoid these mistakes. You get clear previews and can adjust your data before finalizing your chart. This way, your box plots always reflect your data accurately.
Create and Customize Box Plots in Box Plot Generator
Creating and customizing your box plots is where the real magic happens. With FineBI, you can turn your data into clear, professional visuals in just a few steps. Let’s walk through the process so you can see how easy it is to use a box plot generator for your next project.
Input steps
You don’t need to be a data expert to get started. FineBI’s workflow guides you from raw data to a polished box plot. Here’s how you can do it:
- Organize your data
Make sure your data set is complete and free of errors. Double-check for missing values or typos. - Sort your data
Arrange your numbers from smallest to largest. This helps FineBI find the median and quartiles quickly. - Find the median
Identify the middle value in your sorted data. FineBI can do this automatically, but it helps to know what’s happening behind the scenes. - Calculate quartiles
FineBI determines the first quartile (Q1) and third quartile (Q3) for you. These values show where most of your data sits. - Draw the box
In FineBI, select the box-and-whisker plot chart type. Drag and drop your data fields into the right spots. - Add whiskers
FineBI extends the whiskers to the smallest and largest values, leaving out any outliers. - Spot outliers
The tool highlights outliers using statistical rules based on your data’s spread.
FineBI's drag-and-drop interface makes each step simple. You can preview your box plot as you go, so you always know what your chart will look like.
Customization options
Once you have your basic box plot, you can make it your own. FineBI and other free online tools offer a range of customization features. Here’s a quick overview:
| Customization Aspect | Description |
|---|---|
| Fonts | Edit the font style used in the box plot. |
| Colors | Change the color scheme to match your brand. |
| Labels | Add or adjust labels for clarity. |
| Legend | Modify the legend to fit your needs. |
| Border | Adjust the border style for emphasis. |
| Size | Change the overall size of the box plot. |
| Background | Edit the background for a clean look. |
| Shapes and Icons | Add shapes or icons to highlight key points. |
You can also switch between vertical and horizontal layouts, adjust how far the whiskers extend, or remove them if you want a different look. FineBI lets you fine-tune every detail, so your box plot fits perfectly with your report or presentation.
Tip: Use clear labels and contrasting colors to make your box plot easy to read. If you’re comparing groups, pick colors that help viewers spot differences quickly.
Download and share
After you finish customizing your box plot, you’ll want to share it or use it in a report. FineBI makes this step just as easy as the rest.
You can export your box plot by selecting the export option and choosing PDF. The exported file matches what you see on your screen, including all your customizations. If you use other free online tools like BoxPlotR, you can download your chart in formats such as EPS, PDF, or SVG. Some tools even let you download the underlying data as a CSV file.
- Export your box plot as a PDF for easy sharing.
- Download your chart in different formats depending on the tool.
- Share your dashboard or chart with your team directly from FineBI.
With these options, you can include your box plot in presentations, send it to colleagues, or keep a copy for your records. FineBI's publishing and collaboration features help you work with others and keep everyone on the same page.
Tips For The Best Box Plot Generator
When you use a box plot generator made easy for free online, you want your results to look sharp and accurate. Here are some tips to help you get the most out of FineBI and similar tools.
Data formatting
Getting your data in the right shape is the first step to a great box plot. FineBI makes this process simple, but you still need to follow some best practices. Take a look at these techniques:
| Technique | Description |
|---|---|
| Sorting values | Sort your data logically or by quartile values. This makes patterns easier to spot. |
| Meaningful x-axis placement | Place your x-axis at zero or use clear category labels. This helps viewers understand the plot. |
| Dataset size consideration | Use larger datasets for box plots. Small datasets can give misleading results. |
You should always check your data for errors before uploading. Clean, well-organized data leads to box plots that tell the right story.
Troubleshooting
Even with a box plot generator made easy for free online, you might run into a few bumps. Here’s a quick guide to common issues and how to fix them:
| Issue | Description | Solution |
|---|---|---|
| Incorrect Data Format | Data not organized for box plot creation. | Reorganize your data into the right columns or groups. |
| Missing Values | Some data points are missing or blank. | Fill in or remove missing values before uploading. |
| Outliers | Extreme values that skew your plot. | Decide if you want to keep, remove, or transform them. |
If you use FineBI, you can also run into technical issues like installation problems or startup errors. Make sure you follow the setup instructions and check for port conflicts or file errors if the software does not start.
Privacy and security
When you use a box plot generator made easy for free online, you want your data to stay safe. FineBI takes privacy and security seriously. You get enterprise-grade governance, role-based access control, and data masking for sensitive information. Only authorized users can see or share your box plots. FineBI also keeps audit logs, so you always know who accessed your data. If you work with confidential or regulated data, these features help you stay compliant and secure.
Tip: Always review your sharing settings before publishing or exporting your box plots. This keeps your data in the right hands.
With these tips, you can create accurate, attractive, and secure box plots every time.
You can see how a Box plot generator made easy for free online lets you create clear visuals in just a few clicks. FineBI stands out for its speed and simplicity, much like other beginner-friendly tools. You get results almost instantly. When you try these tools, you can visualize data distribution, spot outliers, and compare datasets with ease. The user-friendly design encourages you to experiment and build your data analysis skills. Come back to this guide whenever you need to create your next box plot.

Continue Reading About Box Plot
Mastering Boxplot: Meaning, Reading and Creating
16 Types of Chart for Effective Data Visualization
22 Different Types of Graphs in Data Visualization: A Practical Guide


FAQ

The Author
Lewis
Senior Data Analyst at FanRuan
Related Articles

10 Good Data Visualization Examples by Use Case: Sales, Surveys, Finance & Time-Series
If you are searching for $1 , you likely do not need another gallery of pretty charts. You need examples that help sales leaders hit targets, finance teams explain variance, operations managers monitor change, and analys
Yida Yin
Jun 15, 2026

12 Best Data Visualization Tools for 2026: Features, Pricing, Pros and Cons
$1 are software platforms that turn raw data into charts, dashboards, maps, and interactive visual stories for analysis and decision making. 12 best data visualization tools for 2026 at a glance
Lewis Chou
Apr 23, 2026

Top 8 Data Visualization softwares You Should Try in 2026
Compare the top 8 data visualization software for 2026, including FineReport, Tableau, Power BI, and more to find the best fit for your business needs.
Lewis
Mar 19, 2026