Introduction to Web Reporting
In 2026, web reporting tools, along with leading reporting software, have become essential for businesses to stay competitive. With data driving decisions, these tools allow you to create detailed reports, track performance, and uncover insights. Leading options like FineReport, Microsoft Power BI, Tableau, DashThis, and Zoho Analytics help you manage data effectively. Each tool offers unique features tailored to various needs, from visual analytics to automated reports. Choosing the right solution ensures you maximize efficiency and make informed decisions for your organization. Before further reading you can take a glance at FineReport here.
Key Takeaways
- Web reporting tools are important for businesses in 2026. They turn data into useful ideas for better decisions.
- Automated reports save time and cut mistakes. This lets teams plan smarter instead of doing manual work.
- Live data updates help teams work together and keep reports current. This allows faster reactions to business changes.
- Picking an easy-to-use tool makes learning simple. It helps users make reports quickly without needing special skills.
- Keeping data safe is very important. Choose tools with strong security and rules to protect private information.
Why Web Reporting Tools Are Essential in 2026
The Role of Web Reports in Modern Businesses
Web reports play a critical role in helping businesses thrive in 2025. They transform raw data into actionable insights, enabling you to make informed decisions. Organizations rely on best reporting tools ——enterprise-class reporting tools——to monitor performance, track KPIs, and identify growth opportunities. These tools simplify data analysis and reporting, ensuring that you can focus on strategic planning rather than manual data handling.
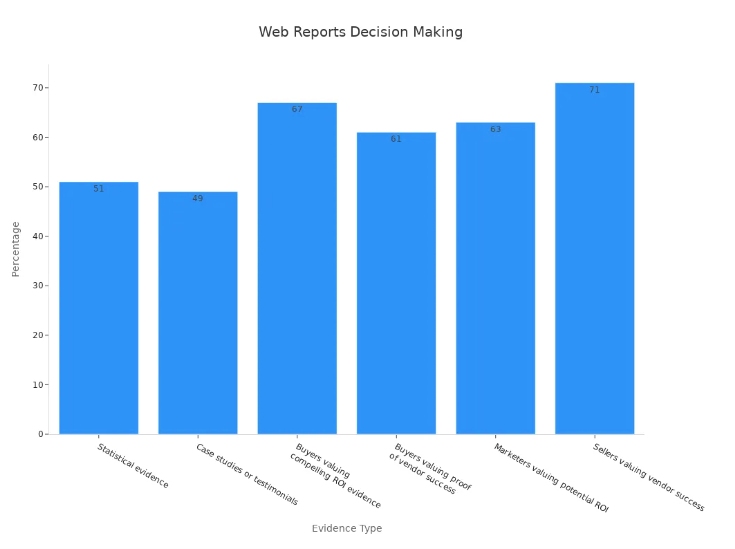
📊 Did you know?
A recent study revealed that 51% of businesses value statistical evidence from web-based reports, while 67% prioritize tools that demonstrate a compelling ROI.
Web-based reports also enhance collaboration by centralizing data and making it accessible to your team in real time. This ensures that everyone stays aligned and works towards common goals.
Benefits of Using Online Tools to Create Management Reports
Using online tools to create management reports offers several advantages. These tools automate report generation, saving you time and reducing errors. They also provide real-time insights into project statuses, helping you make quick and effective decisions.
Modern management reporting tools, powered by advanced reporting tools software, excel in data visualization, allowing you to create dynamic and visually appealing reports. They integrate seamlessly with third-party systems, centralizing data from various departments. This eliminates duplication and ensures that your reports communicate the right information.
Additionally, online reporting software supports interactive features, enabling you to drill down into data and uncover deeper insights. This interactivity makes it easier to identify trends and respond to changes in your business environment.

Trends Driving the Demand for Web Reporting Tools in 2026
Several trends are fueling the demand for web reporting tools in 2026. The exponential growth in data generation has made traditional reporting methods obsolete. Businesses now require AI-powered tools that automate data handling and provide predictive analytics. These tools enable you to make swift, data-driven decisions.
The rise of remote work has also increased the need for online tools to create management reports. Teams need access to real-time data and interactive reports, regardless of their location. Web-based reports meet this demand by offering cloud-based solutions that ensure seamless collaboration.
Finally, the focus on data security and privacy has led to the development of robust reporting software. These tools protect sensitive information while providing the flexibility and scalability needed for modern businesses.
Key Features to Look for in Web Reporting Tools
Customization and Flexibility
Customization and flexibility are essential when choosing a web reporting tool. These features allow you to tailor the software to your specific needs, making reporting processes more efficient. For instance:
- Customizable dashboards let you focus on metrics that align with your goals.
- Flexible tools ensure reports remain relevant to your organization's objectives.
- Advanced visualization options simplify complex data, making insights easier to understand.
By adjusting features to match your requirements, you can create reports that resonate with your audience and support better decision-making. A tool that adapts to your needs ensures you stay ahead in a competitive environment.
Integration with Other Software and Platforms
A robust web reporting tool integrates seamlessly with your existing systems. This capability streamlines data collection and enhances efficiency. Key integration features include:
| Feature | Description |
|---|---|
| Integration | Automatically pulls data from various systems for consistent reporting. |
| Visuals | Creates visually appealing reports, surpassing traditional tools like Excel. |
| Data Handling | Combines qualitative and quantitative data effortlessly. |
| Scheduling | Automates report generation while allowing for on-demand updates. |
| Export Options | Supports multiple formats like PDF, Excel, and CSV for easy sharing. |
These features ensure your reports are not only accurate but also accessible to stakeholders across different platforms. Integration simplifies workflows and enhances collaboration within your team.
Real-Time Data Updates and Collaboration
Real-time data updates keep your reports accurate and relevant. A tool with this feature ensures you always have the latest insights at your fingertips. For example:
- Real-time data integration refreshes reports instantly, providing up-to-date information.
- Regular updates maintain the relevance of your insights.
- Collaboration features allow you to share reports with your team and gather feedback efficiently.
These capabilities foster teamwork and enable faster decision-making. With real-time updates, you can respond to changes quickly and keep your business on track.
User-Friendly Interface and Ease of Use
A user-friendly interface is crucial for any web reporting tool. It ensures that you can navigate the software effortlessly and focus on generating insights rather than struggling with the tool itself. A well-designed interface minimizes the learning curve, allowing you to create reports quickly and efficiently.
Usability testing highlights the importance of intuitive design in web tools:
- Poor usability can harm your brand's reputation, as users often judge credibility based on design and functionality.
- Frustration caused by a clunky interface can lead to negative perceptions of your organization.
- Testing reveals not only user feedback but also emotional responses like confusion or delight during use.
When choosing a tool, look for features like drag-and-drop functionality, customizable dashboards, and clear navigation. These elements make it easier for you to tailor reports to your needs without requiring extensive technical expertise. A user-friendly tool empowers you to focus on decision-making rather than technical challenges.
Security and Data Privacy Considerations
In 2025, security and data privacy are non-negotiable for web reporting tools. With the rise in cybercrime, protecting sensitive information has become a top priority. A secure tool safeguards your data while ensuring compliance with industry standards.
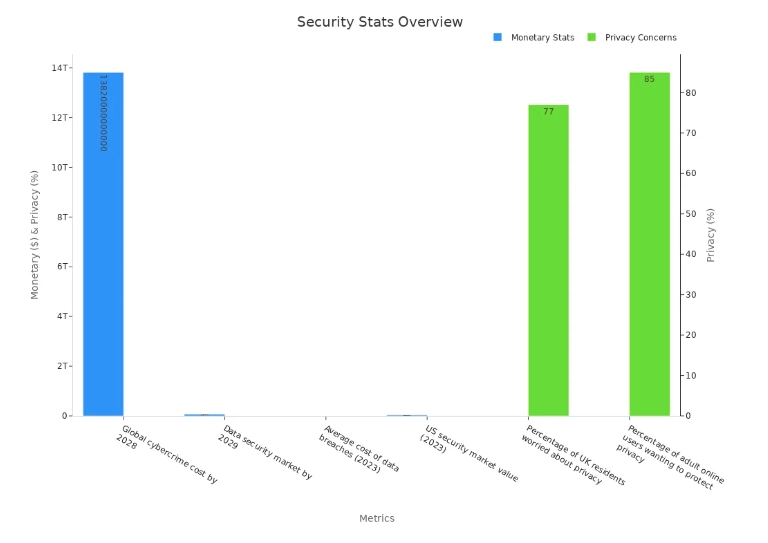
Data breaches can have severe consequences. Nearly 45% of Americans have experienced compromised personal information in the past five years. Additionally, 64% of users blame companies for data loss, and 80% of affected consumers stop doing business with the organization.
To protect your data, choose tools with robust encryption, role-based access controls, and compliance with global privacy regulations. These features ensure your reports remain secure and build trust with your stakeholders.
Top Tools for Web Reporting Creation in 2026
FineReport: Features, Pricing, and Ideal Use Cases
FineReport stands out as a powerful tool for creating web-based reports. It offers a flexible report designer that simplifies report generation with drag-and-drop functionality. You can connect to multiple data sources, enabling seamless integration for comprehensive reporting. FineReport excels in dynamic reporting, allowing you to compare budget versus actual values, which enhances predictive accuracy. Its advanced data visualization reporting tools provide over 70 chart styles, making it easier to present actionable insights.
This tool is particularly effective for marketing operations. It helps you focus on key indicators like sales, costs, and profits. FineReport also supports the establishment of a marketing KPI system, crucial for performance evaluation. Business leaders benefit from its ability to present operational indicators in various formats. Pricing for FineReport is tailored to enterprise needs, making it a cost-effective solution for medium to large organizations.
Ideal for IT professionals and BI engineers, FineReport is perfect for creating management reports that require customization and scalability. Its interactive features and real-time data updates make it a top choice for enterprises aiming to streamline report management tools.

Microsoft Power BI: Features, Pricing, and Ideal Use Cases
Microsoft Power BI is a leading name in the world of data visualization and analytics. It offers robust features like seamless integration with other Microsoft products and real-time data updates. You can create interactive reports that provide deep insights into your business operations. Power BI’s user-friendly interface ensures that even non-technical users can generate reports effortlessly.
| Feature/Metric | Microsoft Power BI | Looker |
|---|---|---|
| Pricing Structure | Per-user monthly or annual fee | Custom pricing via direct sales |
| Unique Features | Data visualization, integration | Advanced analytics, custom dashboards |
| User Satisfaction | High ratings across platforms | Moderate ratings |
Power BI’s pricing is based on a per-user model, making it accessible for businesses of all sizes. It is ideal for organizations that need a scalable solution for management reports. Whether you are a small business or a large enterprise, Power BI’s capabilities cater to diverse reporting needs.
Tableau: Features, Pricing, and Ideal Use Cases
Tableau is another top contender in the realm of web report creation. Known for its high performance and mobile-friendly design, Tableau allows you to create visually stunning and interactive reports. It offers extensive customer resources and easy upgrades, ensuring a smooth user experience. However, it requires some SQL knowledge, which might pose a challenge for beginners.
| Advantages | Disadvantages |
|---|---|
| High Performance | Poor Versioning |
| Mobile-Friendly | No automatic refreshing of reports |
| Extensive customer resources | Need manual effort |
| Excellent mobile support | Not a comprehensive solution |
| Easy to upgrade | No version control |
| Low cost | Requires SQL knowledge |
Tableau’s pricing is competitive, making it a popular choice for businesses focused on data visualization and analytics. It is best suited for organizations that prioritize mobile-friendly, interactive report creation and have the technical expertise to leverage its full potential.
DashThis: Features, Pricing, and Ideal Use Cases
DashThis is a specialized tool designed for marketing teams that need streamlined web-based reports. It simplifies report generation by pulling data from multiple marketing platforms into a single dashboard. This feature makes it ideal for teams managing campaigns across diverse channels. DashThis supports scheduled reporting, ensuring you deliver consistent updates to stakeholders without manual intervention.
Key advantages of DashThis include its broad platform connections and affordability. It integrates seamlessly with popular marketing tools, making it a budget-friendly option for small to mid-sized teams. Its user-friendly interface allows you to get started quickly, even if you lack technical expertise. However, DashThis has some limitations. It offers basic insight generation and lacks advanced analytics features. Teams requiring highly interactive dashboards or granular insights may find it less suitable.
DashThis works best for marketing professionals who prioritize efficiency over customization. It excels in creating management reports that focus on key performance indicators like ad spend, click-through rates, and conversions. While it may not satisfy design-focused teams, its simplicity and reliability make it a valuable addition to your reporting toolkit.
Zoho Analytics: Features, Pricing, and Ideal Use Cases
Zoho Analytics is a versatile platform that combines robust reporting capabilities with advanced analytics. It offers a range of features tailored to businesses of all sizes. You can create interactive dashboards and management reports that provide actionable insights. Zoho Analytics supports over 50 default reports in its basic plan, with higher-tier plans offering even more options.
The platform’s pricing structure is competitive, catering to various business needs. Plans range from Basic to Premium, each offering unique features like email scheduling and API units. For instance, the Premium plan supports up to 100 email schedules and 30,000 API units per day, making it ideal for large-scale operations.
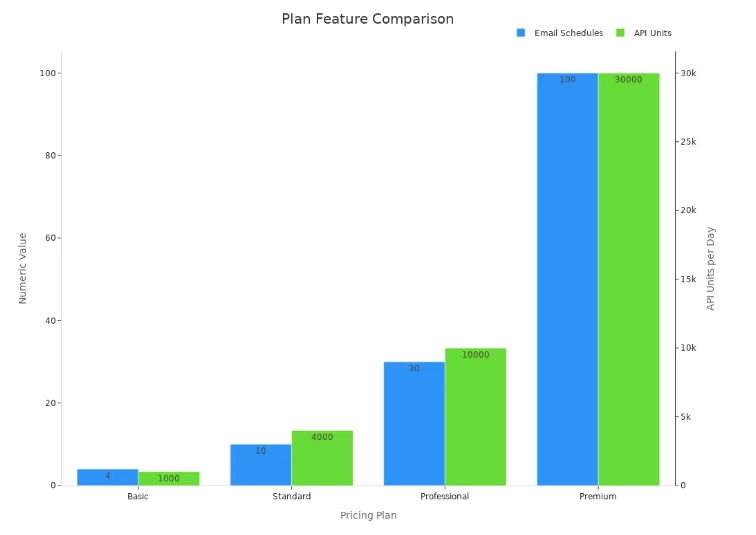
Zoho Analytics is perfect for businesses that need scalable reporting solutions. It suits teams that require detailed reports and advanced analytics without compromising on ease of use. Whether you’re a small business or a large enterprise, Zoho Analytics helps you uncover insights and make data-driven decisions.
Comparison of the Top Web Reporting Tools

Overview of Pricing, Features, and Target Users
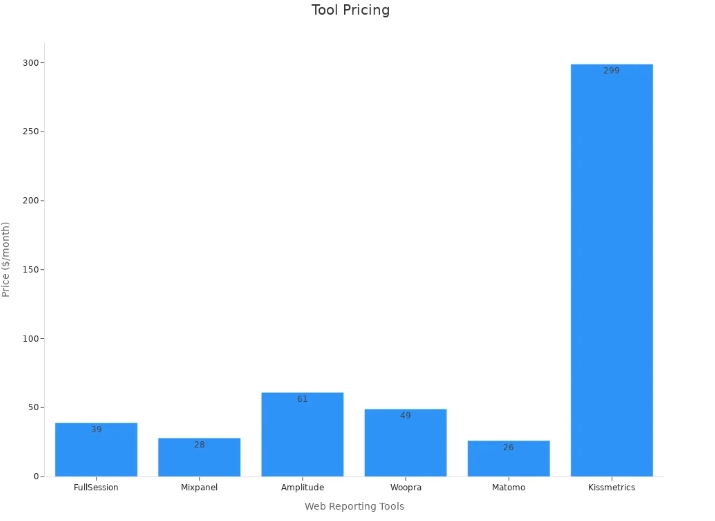
When comparing web reporting tools, pricing, features, and target users play a significant role in determining the best fit for your needs. Each tool offers unique capabilities tailored to specific business requirements. Here's a quick comparison:
| Tool | Monthly Pricing | Real-time Tracking | Heatmaps | Session Recordings | Conversion Funnel Analysis | Error Tracking | Customer Feedback Tools |
|---|---|---|---|---|---|---|---|
| FullSession | $39 | ✔ | ✔ | ✔ | ✔ | ✔ | ✔ |
| Mixpanel | $28 | ✔ | ✘ | ✘ | ✔ | ✘ | ✘ |
| Google Analytics | Free | ✔ | ✘ | ✘ | ✔ | ✘ | ✘ |
| Amplitude | $61 | ✔ | ✘ | ✘ | ✔ | ✘ | ✘ |
| Woopra | $49 | ✔ | ✔ | ✘ | ✔ | ✘ | ✔ |
| Heap | Free | ✔ | ✘ | ✘ | ✔ | ✘ | ✘ |
| Adobe Analytics | Custom pricing | ✔ | ✘ | ✘ | ✔ | ✘ | ✘ |
| Matomo | $26 | ✔ | ✔ | ✔ | ✔ | ✘ | ✘ |
| Kissmetrics | $299 | ✔ | ✘ | ✘ | ✔ | ✘ | ✘ |
For example, Mopinion starts at $259 monthly and is ideal for large enterprises. On the other hand, Qualaroo offers a more affordable option at $19 per month, making it suitable for smaller teams. Hotjar provides a free plan with limited responses and paid plans starting at $59 per month, catering to businesses that need basic reporting capabilities.
Strengths of FineReport and Other Tools
FineReport stands out among web reporting tools due to its robust features and user-friendly design. It simplifies report creation with drag-and-drop functionality, making it accessible even for non-technical users. Here’s how FineReport compares to others:
| Feature/Metric | FineReport Description |
|---|---|
| Ease of Use | Anyone can create reports or dashboards with stunning data visualization. |
| Integration Capabilities | Simplify deployment and integration, lower operation and maintenance cost. |
| Data Visualization Options | Provide 19 categories and over 50 styles of self-developed HTML5 charts, with cool 3D and dynamic effects. |
| Data Entry Function | Improves the efficiency of updating real-time data. |
| Customization | Open APIs enable IT to customize reporting systems easily and quickly. |
| Data Source Combination | In one click, you can combine data from multiple data sources for comprehensive analysis. |
| Reporting Design Modes | Build impressive reports and dashboards within 10 minutes with three reporting design modes and drag & drop ease. |
| Support for Databases | Support all mainstream databases. |
| Data Input Controls | Rich controls make it easy to input massive data via forms, with thoughtful functions such as data validation and temporary storage. |
FineReport’s strengths lie in its ability to handle complex reporting needs while maintaining simplicity. Its advanced visualization options and real-time data updates make it a top choice for enterprises. Other tools like Tableau excel in mobile-friendly designs, while Power BI integrates seamlessly with Microsoft products. DashThis focuses on marketing-specific reports, and Zoho Analytics offers scalability for growing businesses.
Choosing the right web report tool is crucial for achieving your business goals. The right reporting solution simplifies data analysis, enhances decision-making, and improves operational efficiency. Among the available options, FineReport stands out for its flexibility, advanced visualization, and seamless integration capabilities. It empowers enterprises and IT professionals to create dynamic reports tailored to their needs.
Evaluate your specific requirements before selecting a tool. FineReport offers a comprehensive solution that adapts to diverse reporting demands. Explore its features to unlock the full potential of your data and drive smarter decisions.
Now Click the banner below to try FineReport for free and empower your enterprise to transform data into productivity!
Continue Reading about Reporting tools
15 Best Software Reporting Tools for 2026
Top 10 Data Reporting Tools for Business Intelligence
Top 12 OLAP Reporting Tools for Business Intelligence in 2026
Unveiling the Top 20 Business Reporting Tools of 2026
FAQ
What is the best web reporting tool for enterprises?
FineReport is an excellent choice for enterprises. It offers advanced features like real-time data updates, customizable dashboards, and seamless integration with multiple data sources. Its drag-and-drop interface simplifies report creation, making it ideal for IT professionals and BI engineers.
Can I use these tools without technical expertise?
Yes, many tools like Microsoft Power BI and DashThis are user-friendly. They feature intuitive interfaces and drag-and-drop functionality. These tools allow non-technical users to create reports effortlessly. However, tools like Tableau may require some technical knowledge, such as SQL.
How do web reporting tools ensure data security?
Most tools prioritize data security through encryption, role-based access controls, and compliance with global privacy standards. For example, FineReport uses robust security measures to protect sensitive information, ensuring your data remains safe and accessible only to authorized users.
Are these tools suitable for small businesses?
Yes, tools like Zoho Analytics and DashThis cater to small businesses. They offer affordable pricing plans and essential features like interactive dashboards and automated reporting. These tools help small teams manage data effectively without requiring a large budget.
Can I integrate these tools with existing software?
Absolutely! Most web reporting tools, including FineReport and Power BI, support integration with various platforms. This feature allows you to pull data from multiple sources, ensuring consistent and comprehensive reporting across your organization.


The Author
Lewis
Senior Data Analyst at FanRuan
Related Articles

What Is Business Management? A Real-World Guide to Strategy, Operations, Finance, and People
$1 is the discipline of turning goals into results. It connects strategy with execution, money with decisions, and people with performance. Whether a company has 5 employees or 50,000, strong management is what keeps pri
Lewis Chou
Jun 24, 2026

What Recruiters Look for in a Data Analysis Portfolio: 10 Criteria to Score Yours Fast
A $1 is not judged like a school assignment. It is judged like a hiring shortcut. Recruiters, hiring managers, and analytics leads use it to answer one question fast: Can this person solve business problems with data in
Lewis Chou
May 29, 2026

What Is Data Analytics Consulting? Beginner’s Guide to Services, Deliverables, and Business Value
$1 helps organizations turn raw data into decisions they can trust. For many business leaders, the challenge is not a lack of data. It is a lack of clarity. Reports conflict, teams track different KPIs, dashboards are un
Lewis Chou
Jun 03, 2026