Introduction
Web reports are a powerful tools for presenting, analyzing, and sharing data online. They transform raw data into actionable insights, helping you make informed decisions and achieve data-driven success. For those wondering what is data platform, they refer to the robust underlying infrastructure that supports data management and analytics. Businesses increasingly rely on web-based reporting tools to simplify complex data and enhance productivity. In fact, many companies now integrate data reporting software as part of their suite of essential business tools. For example, web-based tools automate data integration, saving time and reducing errors. They also centralize data from multiple sources, ensuring accuracy and clarity in effective data reports.
Organizations generate vast amounts of data daily, with 80%-90% being unstructured. Without robust solutions, managing this data becomes overwhelming. Web-based reporting tools like FineReport address this challenge by offering advanced visualization options, real-time updates, and tailored dashboards. These features ensure you stay ahead in today’s fast-paced, data-driven environment. FineReport takes the lead in this area. Now you can click and book a demo here.
Understanding Web Reports
What are Web Reports?
Web reports are a digital tools that allow you to present, analyze, and share data online. It transforms raw information into meaningful insights, enabling you to make informed decisions. Unlike traditional reports, web reports are dynamic and interactive. They provide real-time updates, ensuring that the information you access is always current.
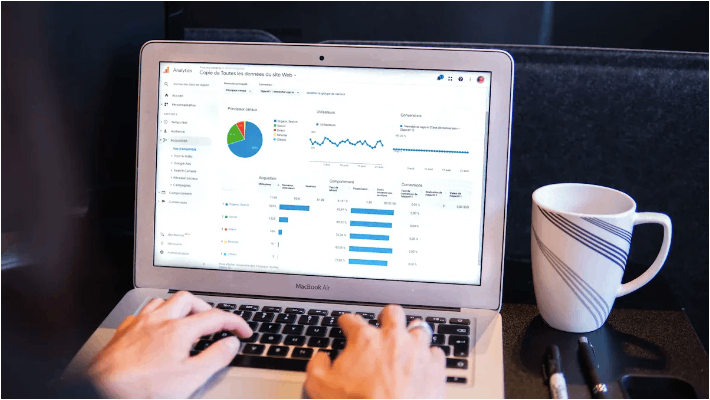
Web reports are essential in today’s fast-paced world of data analysis. They help you simplify complex datasets and uncover patterns that might otherwise go unnoticed. For example, web analytics tools measure and report web data to improve website effectiveness. These tools also track visitor numbers, page views, and user behavior, giving you a clear picture of traffic trends and campaign performance.

Key Features of Web Report Tools
Modern web-based reporting tools come equipped with advanced features that make data analysis more efficient and insightful. Here are some key features you should look for:
| Feature | Description |
|---|---|
| Ease of Use | Intuitive interfaces allow you to work with data and create reports effortlessly. |
| Data Visualization | A variety of options, such as charts and dashboards, make reports engaging and easy to understand. |
| Data Blending | Combine data from multiple sources to create comprehensive reports. |
| Real-time Collaboration | Share insights and collaborate with your team in real time. |
| Data Security and Governance | Protect sensitive information with role-based access control and compliance with regulations. |
These features not only enhance the reporting process but also ensure that your data remains secure and accessible. Tools like FineReport excel in offering these capabilities, making them ideal for businesses aiming to streamline their reporting workflows.
How Web Reports Facilitate Data-Driven Insights
Web reports play a crucial role in helping you uncover actionable insights from raw data. They enable you to visualize trends, identify opportunities, and address challenges effectively. Businesses across industries have leveraged web reports to achieve remarkable outcomes:
- Procter & Gamble optimized inventory and improved forecast accuracy, saving $1.2 billion annually.
- Bank of America increased mobile banking engagement by 15% with Erica, an AI assistant, enhancing customer satisfaction by 20%.
- Google reduced cooling energy consumption in data centers by 40%, achieving significant cost savings.
- UPS saved $400 million annually by optimizing delivery routes with its ORION algorithm.
These examples highlight how web reports empower you to make data-driven decisions. By automating the reporting process, you can save time, customize reports to meet specific needs, and quickly discover valuable insights. Additionally, integrating visualization tools allows you to create interactive dashboards that simplify complex data.
Web reports also improve collaboration by enabling real-time sharing of insights. This fosters teamwork and ensures that everyone stays aligned with organizational goals. With tools like FineReport, you can automate report generation, track trends, and build effective strategies, all while staying up to date with the latest data.
The Role of Web Reports in Data Analysis
Simplifying Complex Data for Better Decisions
Web reports simplify complex datasets, making it easier for you to extract meaningful insights and make informed decisions. They transform raw data into visual formats like charts, graphs, and dashboards, which are easier to interpret. For example, a construction report with interactive filters and net bid value tracking provides real-time insights, helping you manage bids more efficiently. Similarly, marketing reports display metrics such as CTR and CPC over time, enabling you to refine your strategies. Sales dashboards compare high-level metrics and analyze historical data, offering comprehensive insights for strategic planning.
| Example Type | Key Features | Benefits for Decision-Making |
|---|---|---|
| Construction Report | Interactive filters, net bid value tracking | Provides real-time insights for efficient bid management |
| Marketing Report | Visual metrics like CTR, CPC, and campaign performance | Enables targeted marketing strategies |
| Sales Dashboard | High-level metrics comparison, historical data analysis | Supports strategic sales decisions |
The visual nature of web reports allows you to grasp data insights at a glance. Interactive elements let you focus on specific data points, while real-time updates ensure you always work with the latest information. These features empower you to make data-driven decisions confidently and efficiently.
Real-Time Data Access and Updates
Accessing real-time data is crucial in today’s fast-paced environment. Web reports provide this capability, ensuring you always have the most current information at your fingertips. Whether you’re monitoring sales performance, tracking inventory, or analyzing customer behavior, real-time data keeps you ahead of the curve. For instance, a retail manager can use real-time dashboards to monitor stock levels and avoid shortages. Similarly, a marketing team can track campaign performance in real time, adjusting strategies to maximize ROI.
Real-time data access also enhances operational efficiency. It eliminates the delays associated with traditional reporting methods, allowing you to respond quickly to changes. By integrating tools like FineReport, you can automate data updates and ensure your reports reflect the latest trends. This level of responsiveness is essential for making timely, data-driven decisions. Now you can click the link and try FineReport for free here.
Enhancing Collaboration Through Shared Insights
Web reports foster collaboration by enabling teams to share insights in real time. When everyone has access to the same data, it becomes easier to align goals and work together effectively. For example, a web reporting tool can improve communication across departments by providing a centralized platform for sharing data insights. Teams can collaborate on projects, discuss findings, and make collective decisions based on accurate, up-to-date information.
Shared insights also promote transparency and accountability. When data is accessible to all stakeholders, it creates a culture of trust and openness. This collaborative approach not only improves teamwork but also leads to better decision-making. With tools like FineReport, you can create interactive dashboards that allow team members to explore data independently, fostering a sense of ownership and engagement.
Tip: Encourage your team to use web reports during meetings. Real-time data sharing can spark meaningful discussions and lead to more effective strategies.

Benefits of Web Reports for Data-Driven Decision Making

Improved Accuracy and Efficiency in Reporting
Web reports enhance accuracy and efficiency in business reporting by automating repetitive tasks and reducing human errors. They allow you to track key metrics, such as process performance, and identify areas for improvement. For instance, tracking Key Performance Indicators (KPIs) helps you evaluate the efficiency of business processes. This systematic approach ensures you can weigh options, project outcomes, and implement targeted strategies to streamline operations.
| Indicator Type | Description |
|---|---|
| Key Performance Indicators (KPIs) | Metrics that measure and track the performance of business processes, allowing organizations to evaluate efficiency and effectiveness. |
By leveraging web reports, you can save time and focus on analyzing data-driven insights rather than manually compiling information. This efficiency leads to faster decision-making and improved outcomes.
Enhanced Transparency and Accountability
Transparency is a cornerstone of effective data-driven decision making. Web reports provide clear visibility into workflows, ensuring all stakeholders have access to accurate and up-to-date information. This visibility fosters accountability by allowing you to monitor progress and address inconsistencies promptly. For example, digital monitoring of processes increases executive confidence in operations and reduces disruptions caused by a lack of clarity.
- Enhanced transparency improves product marketing and customer viability.
- Clear workflows reduce inconsistencies and improve operational efficiency.
- Feedback mechanisms engage stakeholders, promoting accountability.
Organizations that prioritize transparency often experience better collaboration and trust among teams. Web reports make this possible by centralizing data and enabling real-time sharing of insights.
Supporting Strategic Planning and Forecasting
Web reports play a vital role in strategic planning and forecasting by providing actionable insights. They help you analyze trends, predict outcomes, and make informed decisions. Companies like Lotte.com and Cementos Argos have successfully used web reports to address challenges and achieve significant results.
| Company | Challenge | Solution | Results |
|---|---|---|---|
| Lotte.com | Understanding shopping cart abandonment | Implemented customer experience analytics to analyze behavior | Increased customer loyalty and $10 million in sales after addressing checkout issues. |
| Cementos Argos | Seeking competitive advantage and better decisions | Created a business analytics center and invested in data science teams | Standardized finance processes and gained deeper insights into customer behavior. |
These examples highlight how web reports empower you to align strategies with business goals. By integrating real-time data and advanced analytics, you can anticipate market changes and stay ahead of the competition.
Best Practices for Creating Effective Web Reports
Define Clear Objectives and Metrics
To create effective reporting, you must start by defining clear objectives and metrics. These guide your efforts and ensure alignment with your organization’s goals. For example, benchmarks and targets provide direction, helping you focus on what matters most. They also motivate teams and foster a results-driven culture.
| Evidence Description | Implication |
|---|---|
| Benchmarks and targets provide a clear direction, helping teams focus their efforts. | They align efforts with the company's vision, making it easier to track progress. |
| Clear targets keep employees motivated and accountable. | This fosters engagement and a results-driven culture within the organization. |
| Benchmarks help standardize performance assessment. | Ensures fairness in performance evaluation across different teams in large organizations. |
| Clear targets and benchmarks provide insights into performance. | Leaders can make informed decisions on resource allocation and strategic adjustments. |
When you establish evaluation criteria for metrics, you ensure they remain relevant and accurate. Specific metrics also highlight strengths and weaknesses, guiding your decision-making process. This clarity helps you visualize your data effectively and make data-driven decisions.

Ensure Data Quality and Consistency
Data quality and consistency are critical for successful web reporting. Reliable data builds trust and ensures accurate insights. According to Forbes, 84% of CEOs worry about the integrity of the data they use for decision-making. This highlights the importance of maintaining high standards for data quality.
Focus on attributes like accuracy and completeness to ensure your data is reliable. Data integrity adds context and relationships, making the information more actionable. For example, keeping your data up to date fosters trust and encourages reuse. Providing explanations for unavailable data helps users understand gaps and promotes transparency. Additionally, making data available through an API allows for flexible, real-time access, which is especially useful for large datasets.
By prioritizing data quality, you enhance the user experience and ensure your reports remain valuable tools for data-driven insights.
Leverage Advanced Visualization Tools in FineReport
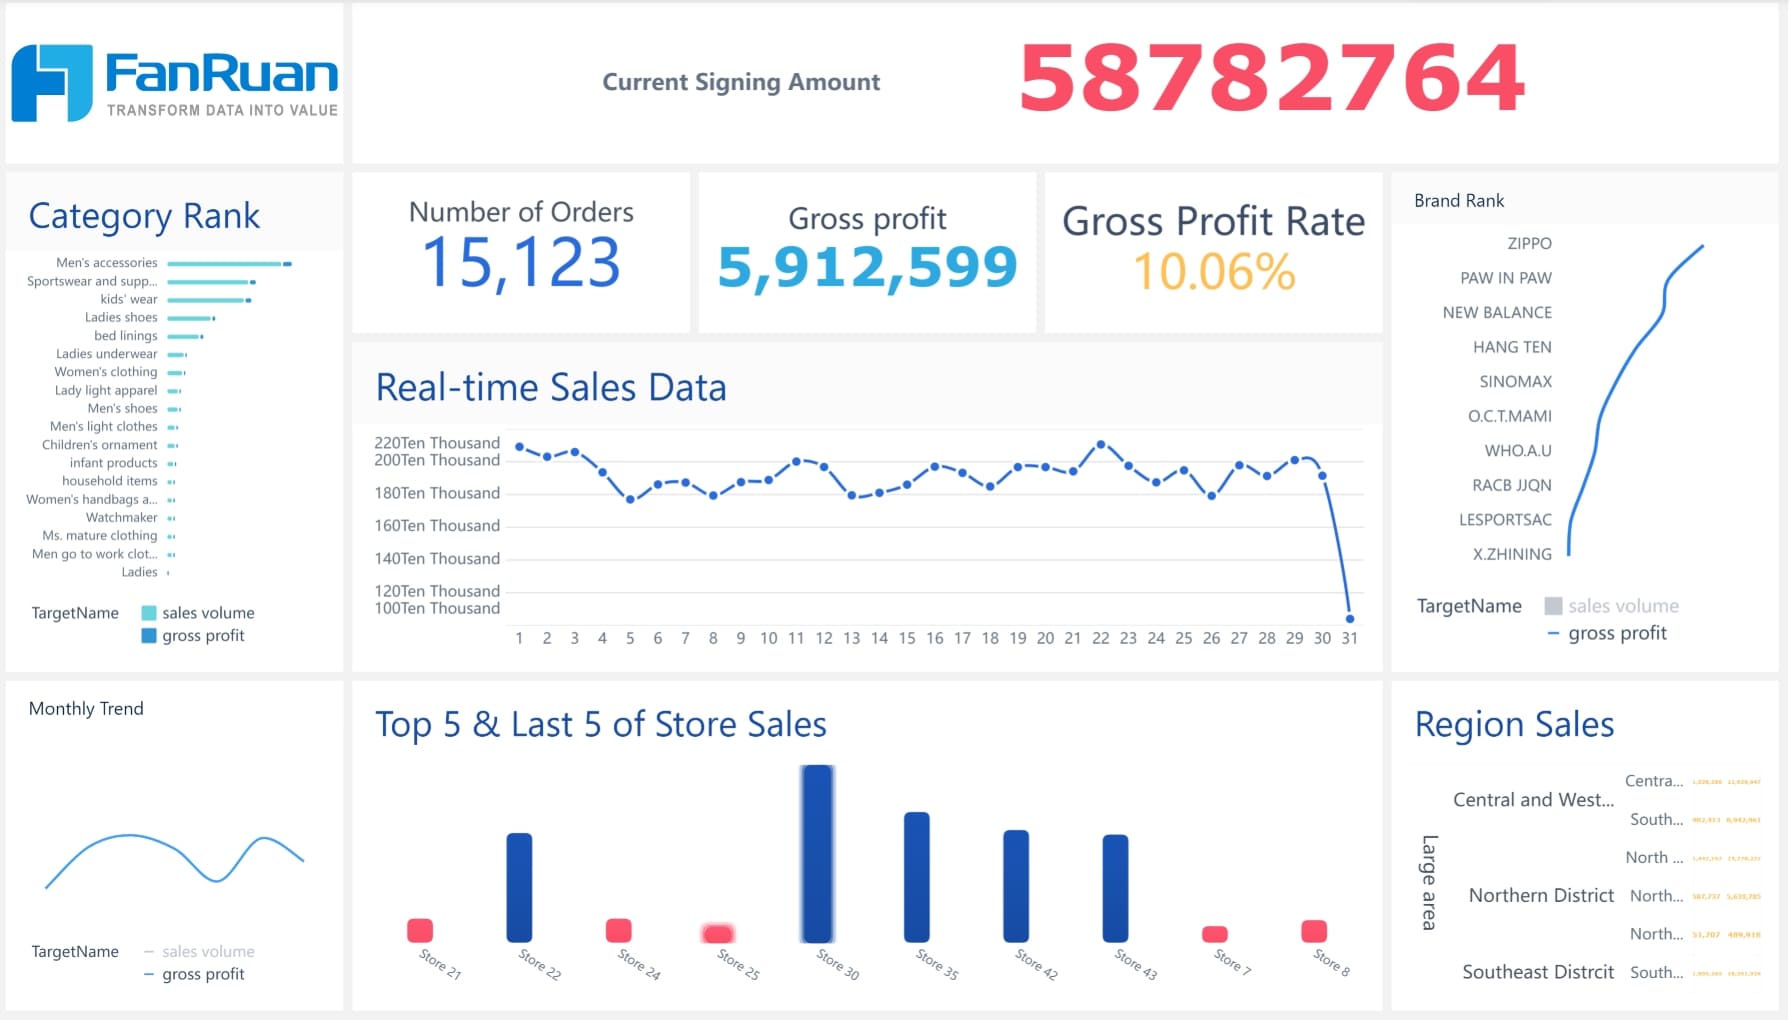
Choosing the right data visualizations is essential for creating impactful web reports. Tools like FineReport offer advanced visualization options that simplify complex datasets. With over 70 chart styles and interactive dashboards, FineReport helps you present data in engaging and meaningful ways.
Interactive dashboards improve the user experience by allowing you to explore data dynamically. For instance, you can drill down into specific metrics or filter data to focus on key insights. FineReport also supports geographical data mapping and third-party chart integrations, giving you the flexibility to customize your reports.
To visualize your data effectively, use charts and dashboards that align with your objectives. FineReport’s drag-and-drop interface makes it easy to create stunning visualizations without extensive technical skills. By leveraging these tools, you can transform raw data into actionable insights and enhance your decision-making process.
Tip: Regularly update your visualizations to reflect the latest trends and maintain relevance.
Regularly Update and Maintain Reports for Relevance
Keeping your web reports updated ensures they remain relevant and valuable for decision-making. Outdated reports can lead to incorrect conclusions and missed opportunities. Regular updates allow you to reflect the latest data and adapt to changing business needs.
Start by scheduling periodic reviews of your reports. This helps you identify outdated information and replace it with current data. For example, if your sales report includes last year’s figures, update it with this year’s performance metrics. Consistent updates ensure your reports align with your organization’s goals and provide actionable insights.
You should also monitor the accuracy of your data sources. Errors in data collection or integration can compromise the reliability of your reports. Use tools like FineReport to automate data synchronization and reduce the risk of manual errors. Automation not only saves time but also ensures your reports always display accurate and up-to-date information.
Tip: Set reminders to review your reports monthly or quarterly. This habit keeps your data fresh and your insights relevant.
Additionally, consider user feedback when maintaining your reports. Ask your team if the reports meet their needs or if they require additional metrics. Incorporating feedback improves the usability of your reports and ensures they serve their intended purpose.
By regularly updating and maintaining your reports, you enhance their reliability and relevance. This practice empowers you to make informed decisions based on the most accurate and current data available.
Leveraging Web Reports for Smarter Decisions with FanRuan
Integrating FineReport for Seamless Reporting
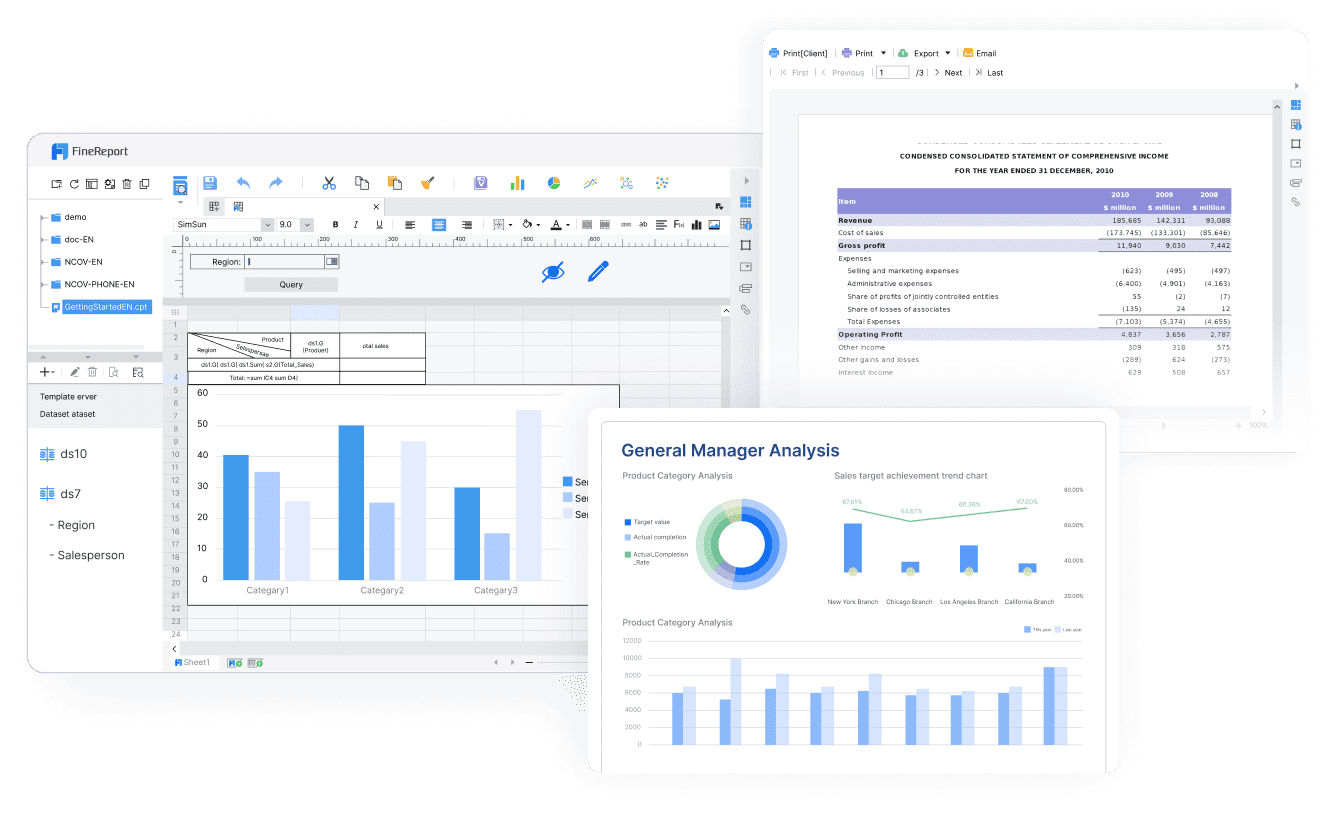
FineReport simplifies reporting by integrating data from multiple sources into a unified platform. Its drag-and-drop interface allows you to create detailed reports without needing advanced technical skills. You can connect FineReport to various databases, spreadsheets, and external systems, ensuring all your data is centralized and accessible. This integration eliminates the hassle of switching between tools, saving you time and effort.
FineReport also supports real-time updates, ensuring your reports always reflect the latest data. For example, you can monitor sales performance or inventory levels without delays. The software’s advanced visualization tools transform raw data into interactive dashboards, making it easier to uncover actionable insights. By using FineReport, you can streamline your reporting process and focus on making smarter decisions.


Identifying Key Metrics and KPIs for Decision-Making
Defining the right metrics and KPIs is essential for effective decision-making. Start by identifying the goals you want to achieve. For instance, if you aim to improve customer satisfaction, track metrics like Net Promoter Score (NPS) or customer retention rates. These indicators provide valuable insights into your progress and highlight areas for improvement.
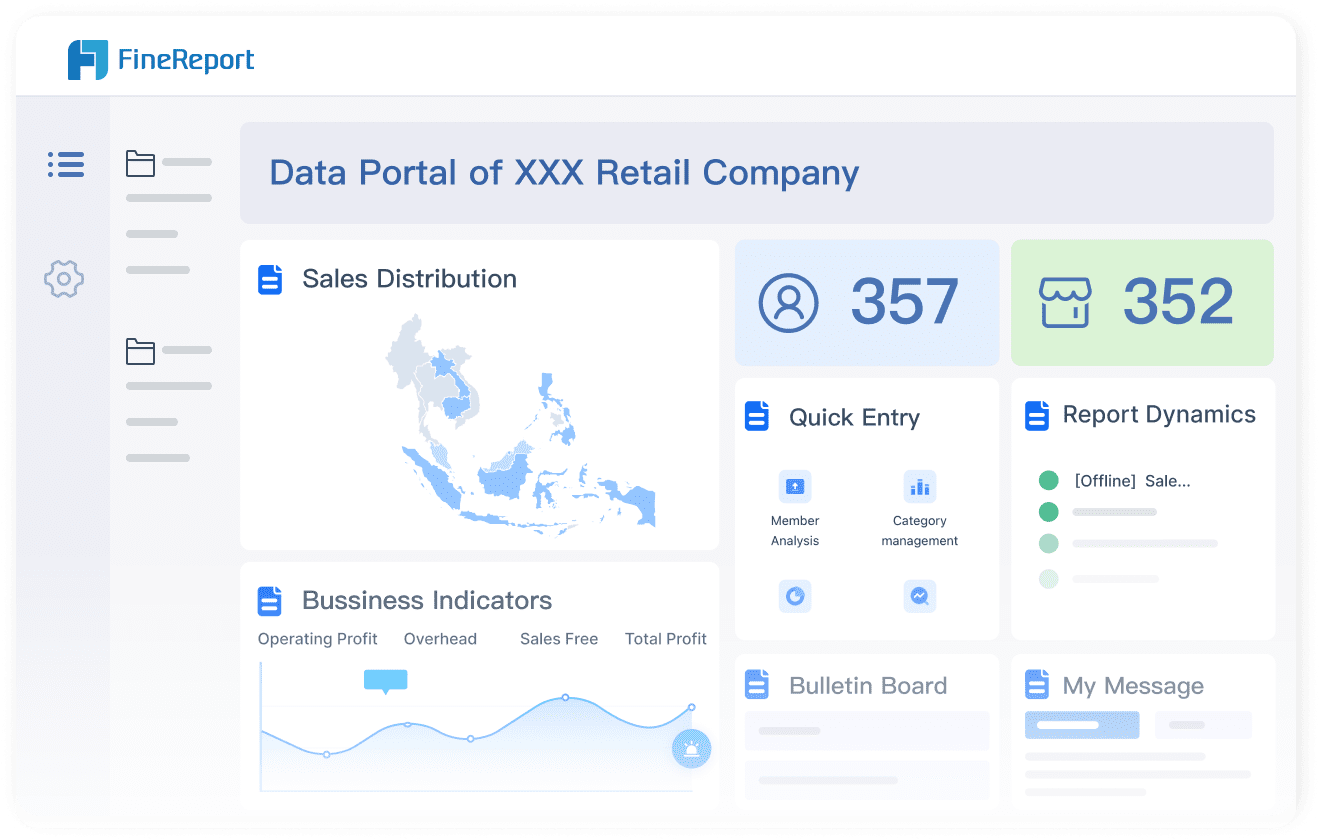
FineReport helps you visualize these metrics in an easy-to-understand format. You can create dashboards that display real-time data, allowing you to monitor performance at a glance. This approach ensures you stay aligned with your objectives and make informed decisions based on accurate insights.
Training Teams to Use Web-Based Report Tools Effectively
To maximize the benefits of web reports, train your team to use tools like FineReport effectively. Start by organizing workshops or tutorials that cover the basics of data integration and report creation. Encourage team members to explore the software’s features, such as interactive dashboards and real-time updates.

Provide hands-on practice sessions where your team can work with real data. This approach builds confidence and ensures they understand how to use the tool to generate meaningful insights. Regular training sessions also keep your team updated on new features, ensuring they continue to use the software efficiently.
Tip: Assign a dedicated team member as a FineReport expert. They can assist others and ensure smooth adoption of the tool across your organization.
Continuously Monitoring and Refining Data-Driven Strategies
Monitoring and refining your data-driven strategies is essential for achieving long-term success. By continuously evaluating performance metrics, you can identify areas for improvement and adapt to changing circumstances. This approach ensures your strategies remain effective and aligned with your goals.
Regular monitoring allows you to track progress and measure the impact of your initiatives. For example, a financial institution improved operational efficiency by 30%, enhanced compliance accuracy by 40%, and increased customer satisfaction scores by 25% within a year of implementing performance monitoring strategies. Similarly, a manufacturing company achieved a 20% boost in production efficiency, reduced defect rates by 30%, and improved supply chain reliability by 25% by focusing on tailored transformation metrics. These results highlight the value of refining your strategies based on real-time data insights.
To refine your strategies effectively, start by setting up a system for continuous feedback. Use tools like FineReport to automate data collection and analysis. This ensures you always have access to accurate and up-to-date information. Analyze trends and patterns to identify what works and what needs adjustment. For instance, if a marketing campaign underperforms, use the data to pinpoint weaknesses and make necessary changes.
Tip: Schedule regular strategy reviews to ensure your efforts stay relevant. Involve your team in these discussions to gain diverse perspectives and foster collaboration.
Refining your strategies also helps you stay competitive. By responding quickly to market changes, you can seize new opportunities and mitigate risks. Continuous improvement not only enhances efficiency but also builds resilience, enabling you to navigate challenges with confidence.
Web reports have transformed how you analyze and share data, enabling smarter business decisions. They simplify complex datasets, provide real-time insights, and foster collaboration. Businesses that embrace analytics often outperform their competitors. For example:
| Statistic | Description |
|---|---|
| 62% of retailers | Report that analytics provides a competitive advantage. |
| 63% of cross-industry respondents | State that data analytics gives them a competitive edge. |
| Insight-driven businesses | Expected to take $1.8 trillion annually from less-informed competitors by 2021. |
Tools like FineReport make reporting seamless by integrating data from multiple sources and offering advanced visualization options. These features help you uncover actionable insights and align strategies with your goals. Data-driven organizations grow faster and achieve better outcomes.

- 62% of retailers find analytics creates a competitive advantage.
- Insight-driven businesses are projected to grow at an average of 30% annually.
Adopting web-based reporting tools empowers you to stay competitive, make informed decisions, and drive success in today’s data-driven world. Now Click the banner below to try FineReport for free and empower your enterprise to transform data into productivity!
Continue Reading about Reporting Tools
25 Best Reporting Tools in 2024 and How to Choose
2024's Best Excel Reporting Tools that Reaches Far Beyond Excel


FAQ

The Author
Lewis
Senior Data Analyst at FanRuan
Related Articles

What Is Business Management? A Real-World Guide to Strategy, Operations, Finance, and People
$1 is the discipline of turning goals into results. It connects strategy with execution, money with decisions, and people with performance. Whether a company has 5 employees or 50,000, strong management is what keeps pri
Lewis Chou
Jun 24, 2026

What Recruiters Look for in a Data Analysis Portfolio: 10 Criteria to Score Yours Fast
A $1 is not judged like a school assignment. It is judged like a hiring shortcut. Recruiters, hiring managers, and analytics leads use it to answer one question fast: Can this person solve business problems with data in
Lewis Chou
May 29, 2026

What Is Data Analytics Consulting? Beginner’s Guide to Services, Deliverables, and Business Value
$1 helps organizations turn raw data into decisions they can trust. For many business leaders, the challenge is not a lack of data. It is a lack of clarity. Reports conflict, teams track different KPIs, dashboards are un
Lewis Chou
Jun 03, 2026