Business Intelligence
What Is a Customer Intelligence Dashboard? A Practical Framework to Unify CRM, Marketing, and Service Data
Lewis Chou
Apr 28, 2026
A customer intelligence dashboard is not just another reporting screen. It is an operating layer for teams that need one reliable view of the customer across marketing, sales, service, billing, and product activity. If you are an operations director, revenue leader, IT manager, or customer success lead, the pain is familiar: data lives in separate tools, handoffs break down, and teams make decisions from partial context.
The business value is straightforward. A customer intelligence dashboard helps teams answer critical questions faster:
- Which leads are most likely to convert?
- Which accounts are expanding versus drifting toward churn?
- Where are service issues hurting renewal or upsell?
- Which campaigns drive pipeline, not just clicks?
- Which customer segments need immediate intervention?
When CRM, marketing, and service data are unified in one place, teams stop arguing over numbers and start acting on insight.

All dashboards in this article were generated by FineBI.
What Is a Customer Intelligence Dashboard?
A customer intelligence dashboard is a unified analytics interface that consolidates customer signals from multiple systems into one view. In practical terms, it combines data from CRM platforms, marketing automation tools, customer support systems, billing records, and sometimes product usage platforms to show how customers move from prospect to active account to loyal advocate—or churn risk.
In plain language, it tells your business what customers are doing, how they are feeling, what they are worth, and what your teams should do next.
Unlike a standard reporting dashboard, which often tracks one department’s outputs, a customer intelligence dashboard is cross-functional by design. A marketing dashboard may show campaign performance. A sales dashboard may show pipeline stages. A support dashboard may show ticket backlog. A customer intelligence dashboard connects all of them so the organization can see cause and effect across the full customer lifecycle.
That distinction matters.
A standard dashboard answers questions like:
- How many MQLs did marketing generate?
- How many open opportunities are in pipeline?
- What is the average first response time in support?
A customer intelligence dashboard answers broader, more valuable questions like:
- Which campaigns generate leads that actually retain?
- Are long onboarding delays causing more support escalations?
- Do low product adoption and rising ticket volume predict churn?
- Which service issues are reducing expansion in strategic accounts?
For revenue teams, unified visibility improves targeting and prioritization. For customer success and service leaders, it reveals risk earlier. For executives, it provides a single view of growth, retention, and operational performance without forcing each team to defend a different version of the truth.
Why Unifying CRM, Marketing, and Service Data Matters
Disconnected systems create operational drag. Most companies do not suffer from a lack of customer data. They suffer from customer data fragmentation.
Marketing sees engagement but not service history. Sales sees opportunities but not product adoption. Support sees complaints but not account value or renewal date. Leadership gets delayed reports stitched together manually, often after the moment to act has passed.
The Risks of Disconnected Systems
When CRM, marketing, and service tools are not unified, several problems show up quickly:
- Inconsistent customer records: The same customer may appear under different names, emails, accounts, or IDs across systems.
- Delayed decisions: Teams wait on manual exports, spreadsheet matching, or analyst intervention.
- Fragmented customer journeys: No one sees the complete path from first touch to closed revenue to support history.
- Broken handoffs: Sales may pass an account to onboarding without critical campaign, promise, or qualification context.
- Weak accountability: Each function reports success in isolation, even when downstream results are poor.
These issues are not just technical. They directly affect conversion rates, response times, retention, and executive confidence.
How a Shared Customer View Improves Handoffs
A shared dashboard improves execution across the full lifecycle:
- Lead generation to sales follow-up: Sales can prioritize leads based on actual engagement quality, source, fit, and intent.
- Sales to onboarding: Implementation teams can see the promises made during the sales process and prepare accordingly.
- Onboarding to support: Service teams gain context on customer tier, product mix, usage milestones, and risk signals.
- Support to account management: Customer success can spot recurring issues before they impact renewal or expansion.
This visibility reduces friction between teams. It also replaces reactive management with coordinated decision-making.
Business Outcomes Teams Typically Expect
When built correctly, a customer intelligence dashboard usually supports measurable outcomes such as:
- Better campaign targeting
- Faster lead routing and follow-up
- Higher sales conversion efficiency
- Improved onboarding visibility
- Quicker support response and resolution
- Better account prioritization
- Stronger retention and expansion
- More accurate revenue forecasting
Key Metrics (KPIs)
For teams evaluating whether a customer intelligence dashboard is delivering value, these are the most important KPIs to track:
- Lead-to-opportunity conversion rate: Measures how effectively marketing-qualified demand turns into pipeline.
- Opportunity-to-win rate: Shows sales efficiency and quality of opportunity selection.
- Customer acquisition cost (CAC): Tracks the cost to acquire new customers across channels.
- Time to first response: Measures service responsiveness after a ticket or request is created.
- Average resolution time: Indicates operational efficiency in resolving customer issues.
- Customer satisfaction score (CSAT): Captures post-interaction customer sentiment.
- Product adoption rate: Measures usage of key features or workflows after onboarding.
- Renewal rate: Shows the percentage of customers who continue at the end of the contract period.
- Expansion revenue rate: Tracks upsell and cross-sell growth within existing accounts.
- Churn rate: Measures customer loss and helps quantify retention risk.
- Forecast accuracy: Compares projected outcomes to actual results for planning confidence.
- Dashboard adoption rate: Measures how consistently teams use the dashboard in live decision-making.
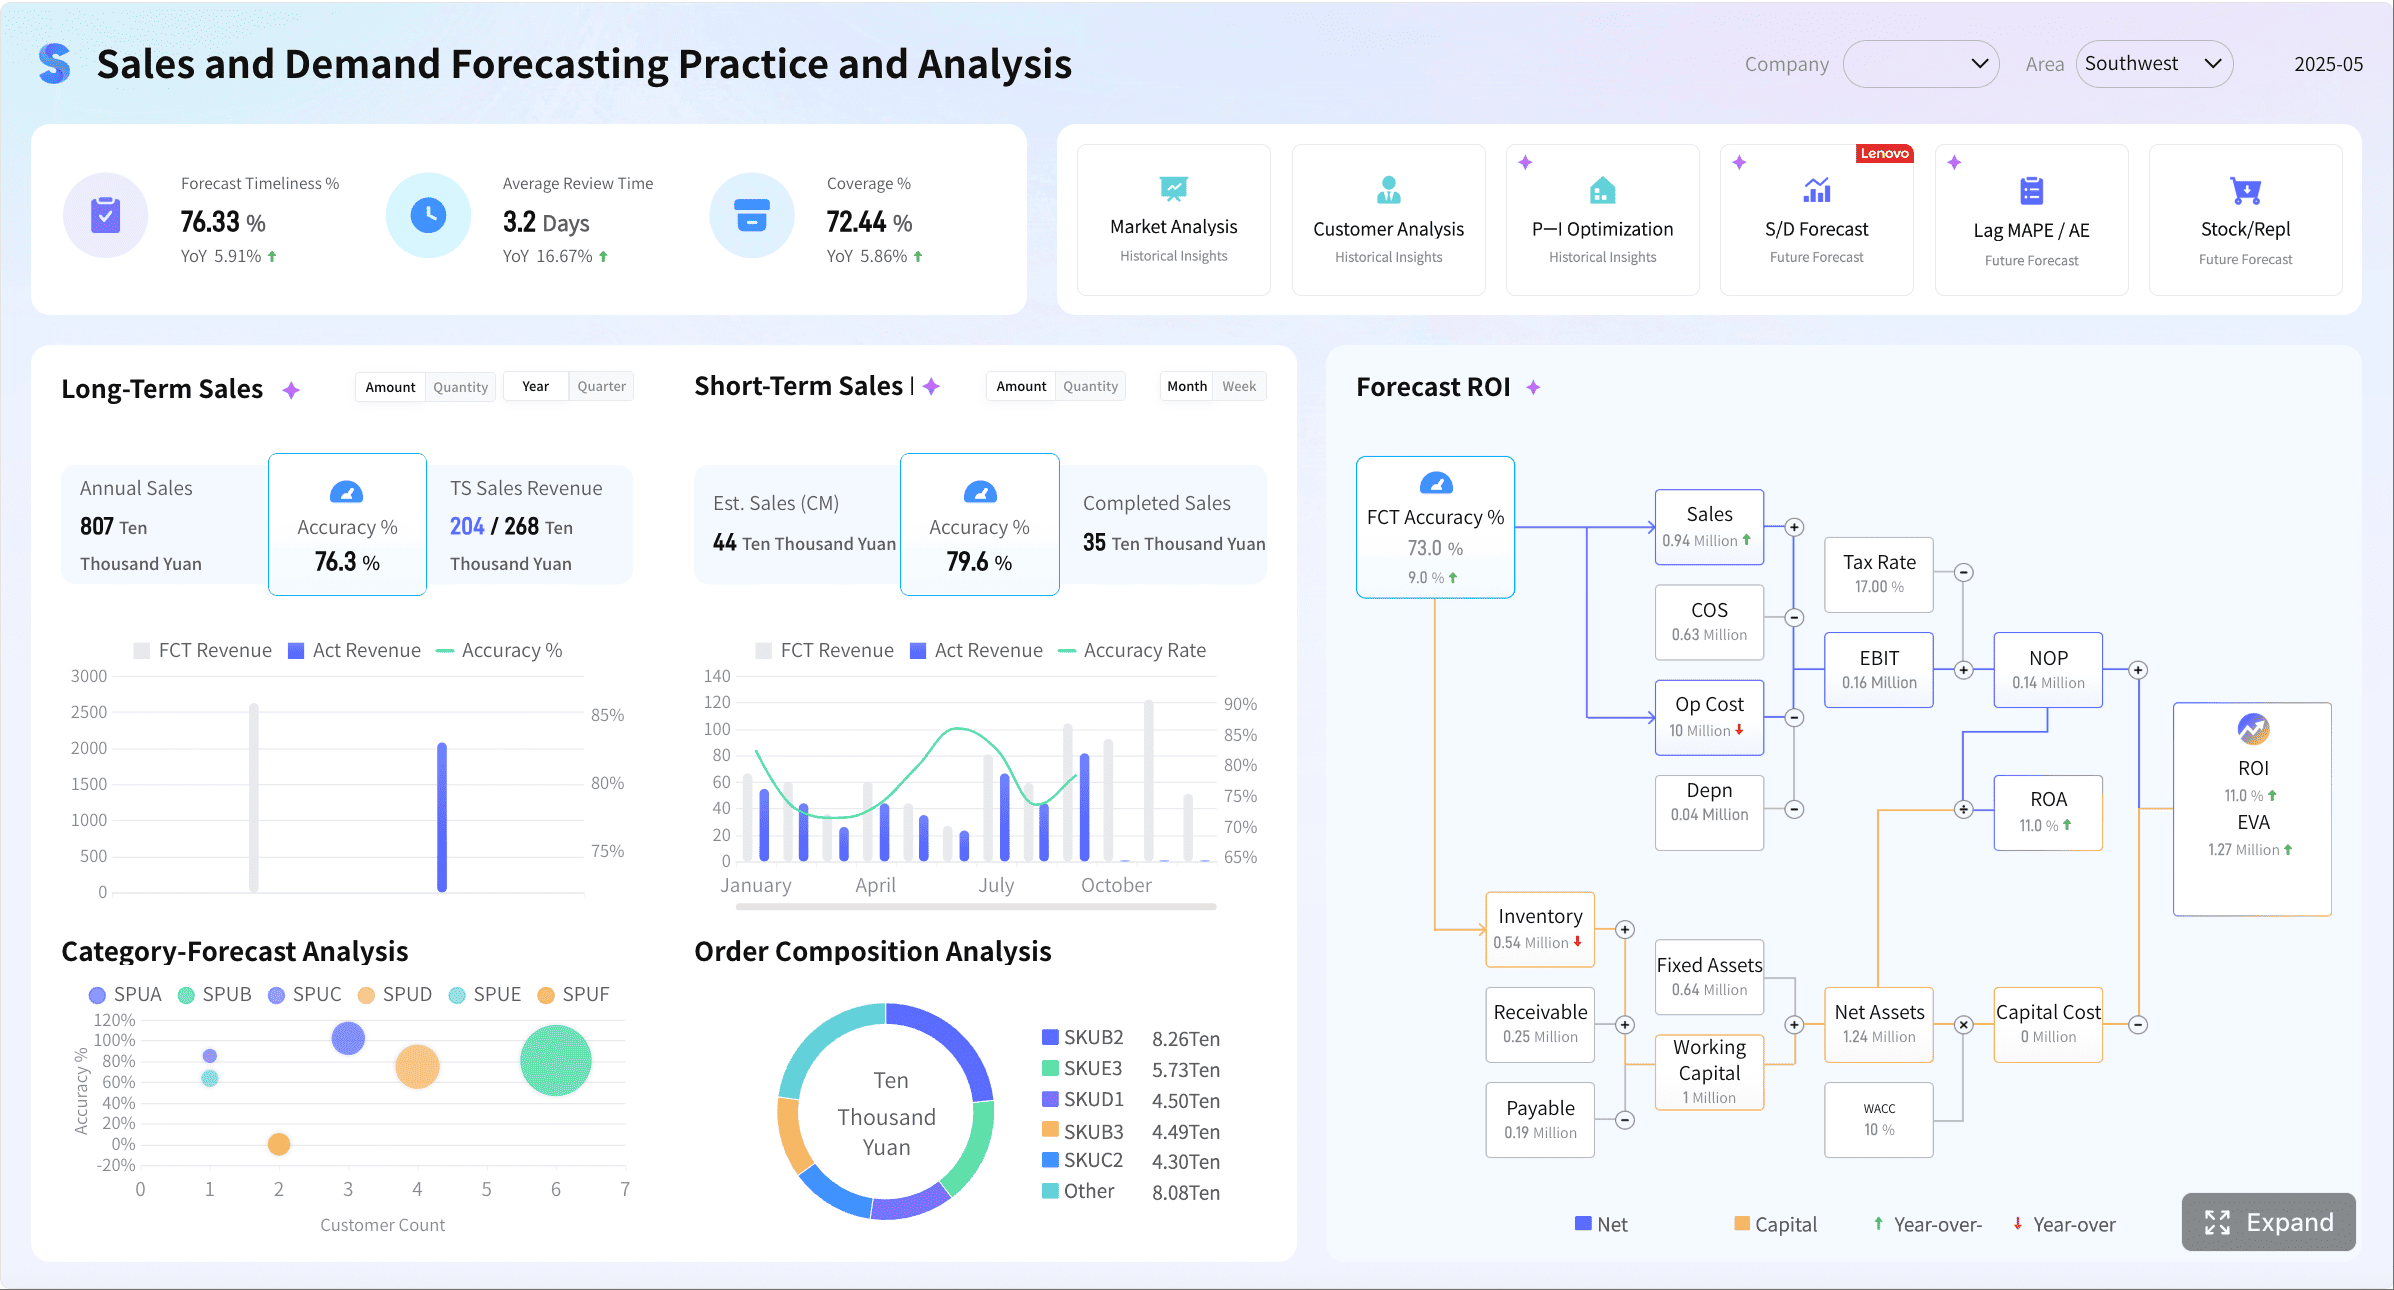 Figure 1: Customer Intelligence Sales Dashboard created with FineBI
The Core Components of an Effective Customer Intelligence Dashboard
A customer intelligence dashboard only becomes useful when it combines the right data, the right metrics, and the right triggers for action.
Data sources and integrations
The foundation is integration. Most dashboards fail because they visualize incomplete data rather than connected data.
Core systems that typically feed a customer intelligence dashboard include:
- CRM: Accounts, contacts, opportunities, lifecycle stages, owner assignments
- Marketing automation: Campaign engagement, email activity, lead scores, form fills, attribution data
- Customer support systems: Cases, response times, escalations, SLA performance, issue categories
- Billing and finance systems: Contracts, invoices, payment status, plan tiers, expansion history
- Product usage platforms: Login frequency, feature adoption, usage depth, seat utilization
- Customer success tools: Health scores, renewal dates, playbooks, risk flags
- Web analytics and event tracking: Visits, conversion paths, content engagement, trial behavior
Why identity resolution matters
If one platform identifies a customer by email, another by account ID, and another by billing contact, the dashboard will produce distorted insights. Identity resolution links those records so one customer or account appears consistently across systems.
Without this, metrics like retention risk, campaign influence, or service burden become unreliable.
Why data freshness matters
Some teams can operate with daily refreshes. Others need hourly or near real-time views. A service intelligence use case may require immediate visibility into case spikes or SLA breaches, while an executive trend dashboard can often tolerate longer refresh intervals.
The right answer depends on the decision being supported.
Why consistent definitions matter
“Customer,” “active account,” “qualified lead,” and “churned user” often mean different things across departments. A strong dashboard enforces standard definitions so the business is not comparing incompatible numbers.
Full-funnel metrics and customer views
An effective customer intelligence dashboard should connect the full customer lifecycle, not just one stage.
That means covering:
- Awareness: Reach, visits, engagement, content consumption
- Acquisition: Leads, MQLs, source quality, campaign influence
- Pipeline: Opportunities, stage progression, sales velocity, win rate
- Conversion: Closed revenue, conversion ratios, CAC efficiency
- Adoption: Activation milestones, usage frequency, feature adoption
- Service quality: Ticket volume, SLA attainment, CSAT, resolution trends
- Expansion: Upsell pipeline, account growth, cross-sell conversion
- Churn: Risk flags, contractions, cancellation patterns, retention trends
A full-funnel view is what turns a dashboard into a strategic tool. For example, a campaign may appear successful at the top of the funnel, but if those customers generate more support burden and renew at lower rates, leadership needs to know.
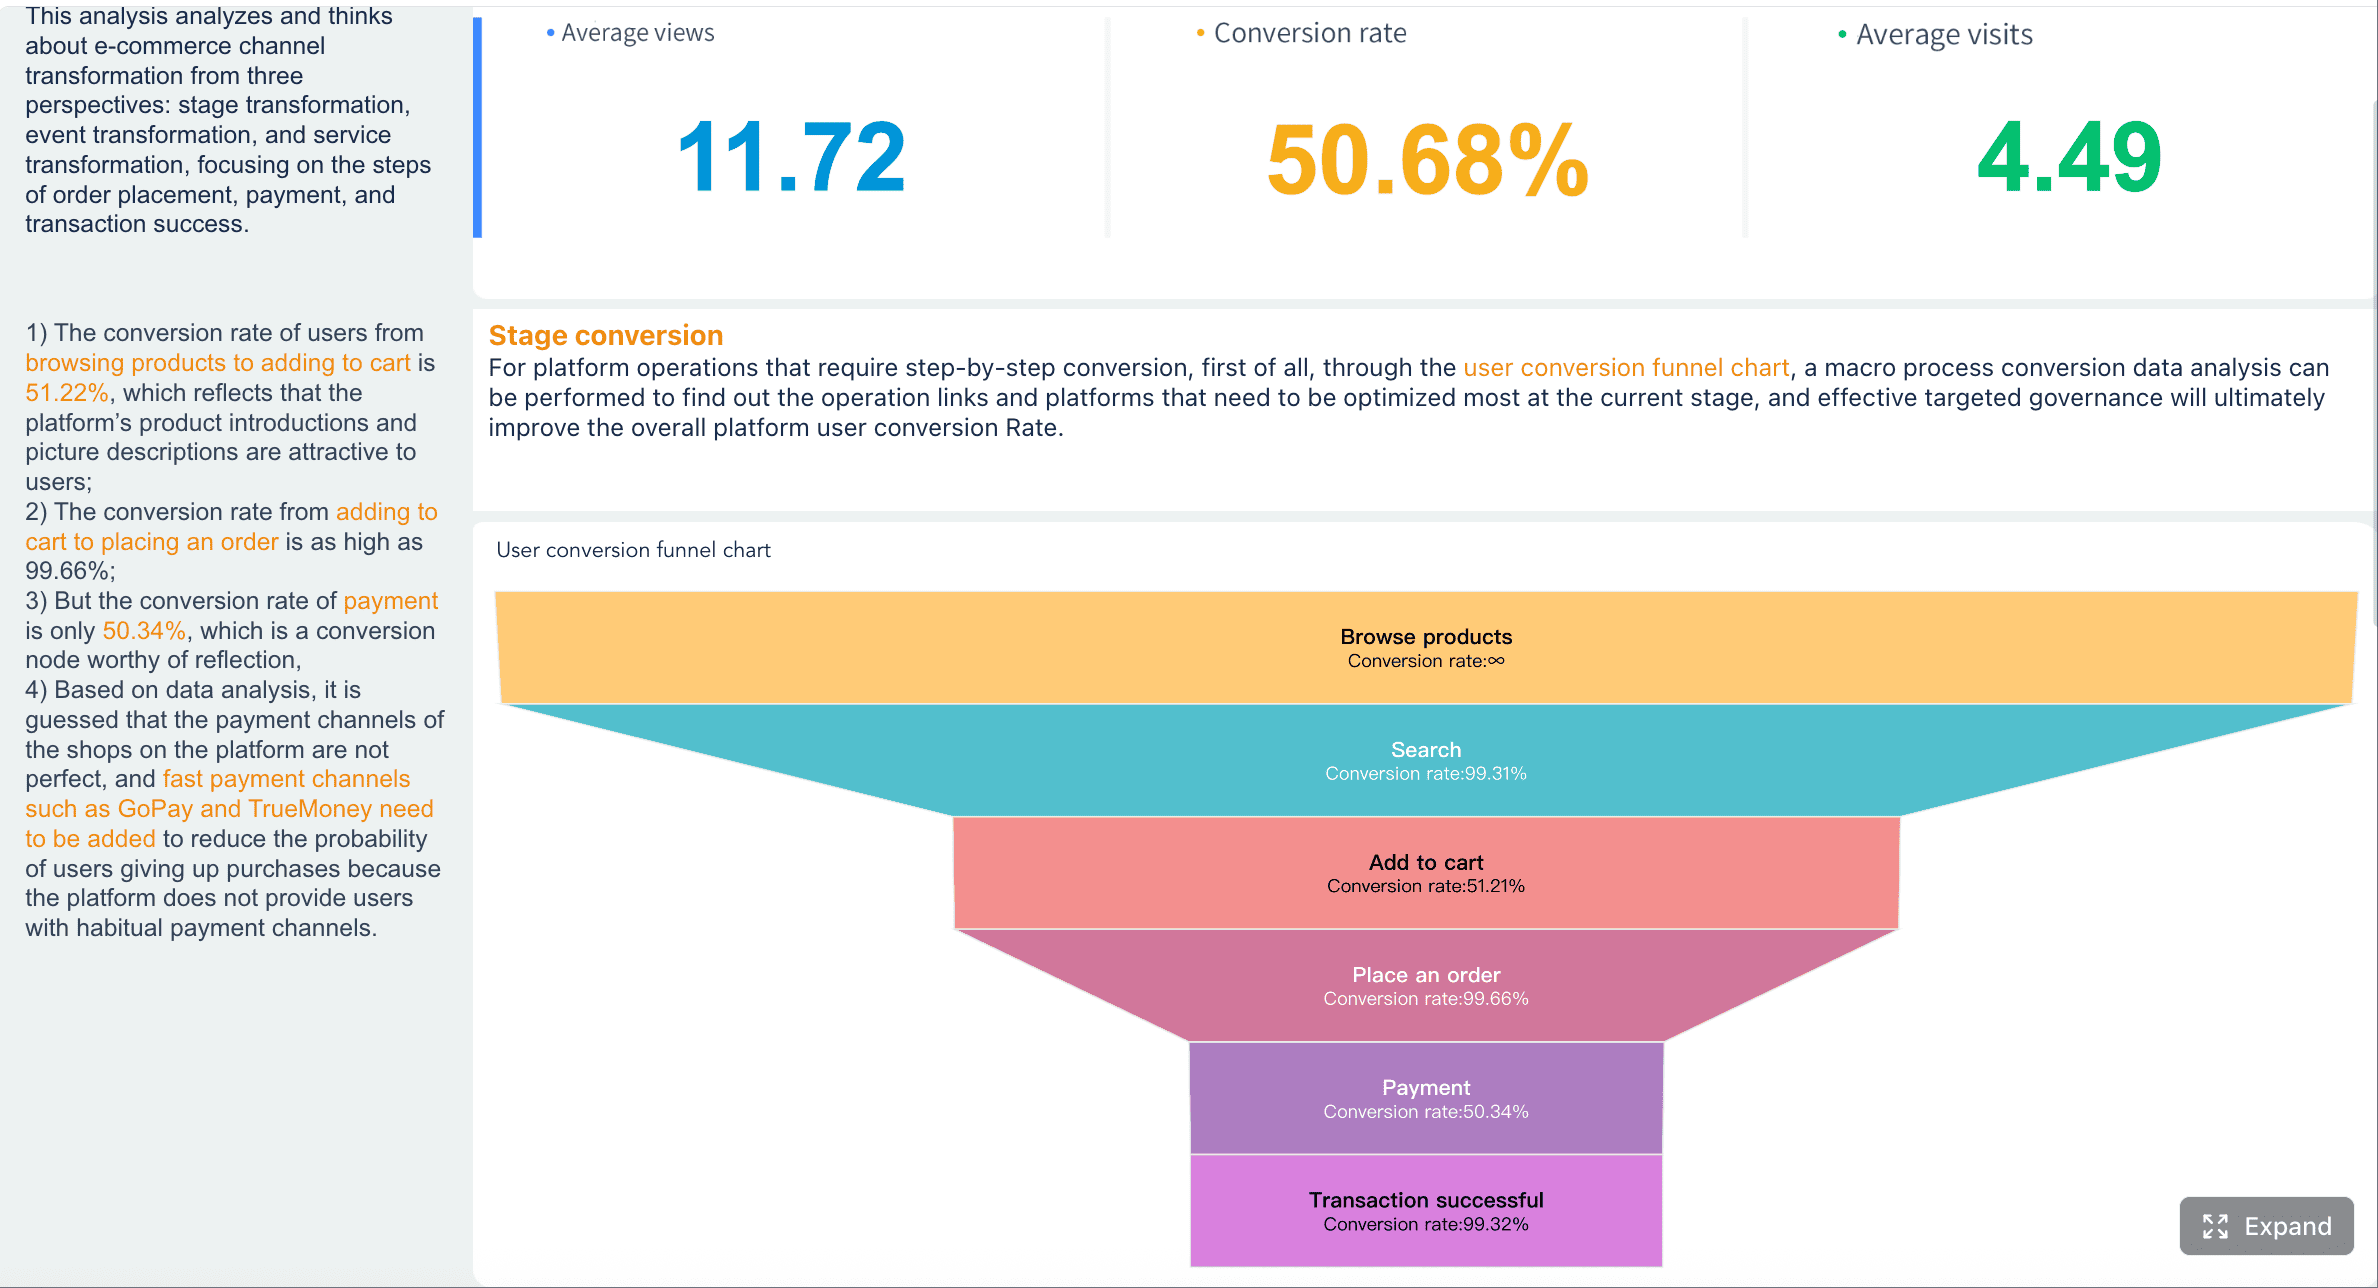 Figure 2: Conversion Funnel created with FineBI
That is where downstream linkage matters. The best dashboards show how early signals affect later business outcomes.
Alerts, segmentation, and decision support
Static dashboards are useful for monitoring. Intelligent dashboards are useful for action.
Three capabilities make the difference:
Filters and segmentation
Teams should be able to segment by:
- Account tier
- Region
- Industry
- Customer cohort
- Campaign source
- Product line
- Lifecycle stage
- Support severity
- Renewal window
This allows decision-makers to isolate patterns quickly instead of relying on one blended average.
Account health views
A high-value dashboard should surface account health using a mix of leading and lagging indicators, such as:
- Declining usage
- Rising support volume
- Low CSAT
- Missed onboarding milestones
- Contract renewal proximity
- Payment issues
- Reduced engagement from key contacts
Automated alerts
Waiting for a weekly review is too late for many risks. Automated alerts can flag:
- Sudden drop in product usage
- Spike in service backlog for strategic accounts
- Campaign segments with unusually low conversion quality
- SLA breaches by customer tier
- Accounts showing combined churn indicators
This moves teams from reactive reporting to proactive intervention.
A Practical Framework to Build a Customer Intelligence Dashboard
Building a customer intelligence dashboard should start with business decisions, not visuals. The right sequence is strategy, data model, workflow design, then dashboard design.
Start with business questions, not charts
Before selecting charts or KPIs, define the decisions the dashboard must support.
For each function, ask:
- What decisions need to be made weekly or daily?
- What signals are currently missing?
- Where do teams rely on instinct because data is fragmented?
- Which operational handoffs fail most often?
Common high-value use cases include:
- Lead qualification: Which leads deserve immediate follow-up?
- Account prioritization: Which accounts offer the highest revenue potential or risk?
- Retention risk detection: Which customers show early warning signs of churn?
- Service escalation: Which support patterns require urgent management attention?
- Executive oversight: Which trends affect growth, retention, and delivery risk?
If the dashboard cannot clearly support these decisions, it is too broad or too superficial.
Standardize the data model
This is where many projects become difficult. A dashboard is only as trustworthy as the model underneath it.
Define common fields across systems, including:
- Customer ID
- Account ID
- Contact role
- Lifecycle stage
- Opportunity stage
- Attribution source
- Renewal date
- Product plan
- Support tier
- Region and segment
- Revenue classification
Then establish governance:
- Who owns each metric?
- Which system is the source of truth for each field?
- How are duplicates resolved?
- How often is data validated?
- What quality thresholds must be met before release?
Without clear ownership and data quality controls, user trust collapses quickly.
Design for action
A dashboard should not merely summarize the past. It should direct the next move.
That means designing views that highlight:
- Trends over time
- Sudden anomalies
- Accounts requiring action
- Segments outperforming or underperforming
- Drill-down paths to root cause
For example, a headline KPI showing a drop in renewal likelihood is not enough. Users should be able to click into the impacted account segment, identify the common service issue or adoption gap, and route action to the correct team.
Design principles that work well:
- Use summary metrics for quick scanning
- Add cohort or trend views for context
- Surface exceptions, not just averages
- Include owner and account-level drill-down
- Show recommended next actions when possible
Roll out and refine over time
Do not attempt to launch the perfect enterprise dashboard on day one. Start with a minimum useful version that solves a small number of important cross-functional decisions.
A practical rollout approach looks like this:
- Launch one executive summary view and one operational view.
- Validate metric logic with real users.
- Monitor which widgets are actually used.
- Remove low-value visual clutter.
- Expand only after trust and adoption are established.
This phased approach is more effective than a massive dashboard release that overwhelms users and exposes unresolved data issues.
Best Practices for Implementation
As a practical consultant’s checklist, these are the most effective ways to implement a customer intelligence dashboard successfully:
-
Prioritize one or two business-critical use cases first.
Start with decisions tied directly to revenue, retention, or service performance. Avoid trying to solve every data problem at once. -
Create a shared metric dictionary before design begins.
Lock definitions for lifecycle stages, churn, attribution, and service metrics early. This prevents endless reporting disputes later. -
Build account-level drill-down from the start.
Executives may need summaries, but operational teams need to move from KPI to account, case, or campaign detail immediately. -
Add alert logic for leading indicators, not just lagging outcomes.
Waiting until churn or missed SLA is visible is too late. Trigger alerts from behavior shifts, backlog spikes, or usage decline. -
Review adoption monthly and retire unused views.
Dashboard sprawl reduces trust. If a view is not driving decisions, simplify it or remove it.
Common Customer Intelligence Dashboard Types and Real-World Examples
Not every customer intelligence dashboard should look the same. The right design depends on the audience and the decisions they own.
Customer insights dashboards for executive visibility
Executive dashboards should provide high-level visibility into growth, retention, satisfaction, and operational risk. They are not meant to replace deeper operational tools. Their role is to show whether the customer engine is healthy.
Typical executive views include:
- Pipeline growth and conversion trends
- Revenue by segment
- Renewal and churn trends
- Customer satisfaction and service quality
- Product adoption health
- Risk concentration across strategic accounts
What makes these dashboards useful is clarity. Senior leaders need a concise cross-functional summary with enough drill-down to ask sharper questions, not a wall of metrics.
Service intelligence dashboards for support teams
Service leaders need a more operational dashboard. A strong service intelligence dashboard helps them manage workload, monitor service quality, and identify repeat failure patterns before they damage customer relationships.
Common metrics include:
- Case volume by queue and severity
- First response time
- Average resolution time
- SLA attainment
- Escalation rate
- CSAT by team or issue type
- Top recurring issue categories
- Backlog aging
- Ticket trends among high-value accounts
When connected to CRM and revenue data, these dashboards become much more valuable. Support leaders can see not just how many cases are open, but which issues affect the most important customers and which patterns could threaten renewal.
Business intelligence examples that connect teams
The most useful BI examples are not the prettiest dashboards. They are the ones that reveal patterns across departments and make ownership obvious.
Consider a few realistic scenarios:
Example 1: Campaign quality versus downstream service load
Marketing launches a successful acquisition campaign with strong conversion volume. The dashboard later shows that the same cohort has low adoption and high support case volume. Leadership can now investigate whether messaging, targeting, or onboarding expectations are misaligned.
Example 2: Product adoption as a renewal predictor
Customer success teams notice that accounts with low feature adoption and rising case escalations renew at far lower rates. The dashboard helps define a proactive retention playbook for at-risk accounts 90 days before renewal.
Example 3: Sales promises versus onboarding delays
Sales closes deals quickly, but onboarding duration stretches due to implementation complexity that was not captured in the CRM. A unified dashboard surfaces the mismatch between pipeline velocity and delivery readiness, helping operations tighten qualification and handoff rules.
What makes these examples valuable is not the technology alone. It is the presence of:
- Clear cross-functional ownership
- Shared metric definitions
- Drill-down to accountable teams or accounts
- Design that points to action, not just observation
How to Choose the Right Platform and Measure Success
Choosing a platform for a customer intelligence dashboard is not simply a BI tool decision. It is a data integration, governance, usability, and scale decision.
What to look for in a customer intelligence platform
Enterprise teams should evaluate platforms across six core areas:
Integration depth
The platform should connect well to your core systems, including CRM, marketing automation, service, finance, and product usage data. Native connectors help, but so does flexibility for custom integration.
Visualization flexibility
Different audiences need different views. Executives want summary trends. Operations teams need granular workflows. The platform should support both.
Governance and data control
Look for:
- Centralized semantic definitions
- Row-level or role-based permissions
- Auditability
- Version control
- Data lineage visibility
These capabilities are especially important for enterprise reporting trust.
Automation
A strong platform should automate refresh schedules, alerts, recurring distribution, and ideally some workflow triggers. Manual reporting work is exactly what this dashboard should reduce.
Permissions and security
Support, sales, finance, and leadership often require different data access levels. A platform must support secure access by role, region, team, or account ownership.
Scalability
The platform should handle growing data volumes, more use cases, additional business units, and evolving governance requirements without becoming brittle or expensive to maintain.
A practical evaluation approach for 2026 and beyond
For teams reviewing platform options in 2026 and beyond, use a practical evaluation method:
- Define the top three business use cases first.
- Map the required data sources and refresh needs.
- Test dashboard usability with both executives and frontline managers.
- Validate governance and permission controls early.
- Estimate total maintenance effort, not just licensing cost.
- Pilot with a small, measurable workflow before enterprise rollout.
This avoids buying a visually impressive platform that fails under real operational complexity.
Metrics that show the dashboard is working
A customer intelligence dashboard is successful when it changes behavior and improves outcomes. Track these measures after rollout:
- Adoption rate: Are teams using the dashboard regularly in meetings and daily workflows?
- Decision speed: Are lead routing, account prioritization, or escalation decisions happening faster?
- Data accuracy: Are fewer reporting disputes and reconciliation issues occurring?
- Forecast confidence: Are leadership teams more confident in pipeline, renewal, and service projections?
- Retention impact: Are at-risk accounts being identified earlier and saved more often?
- Service improvement: Are SLA performance, response times, and issue resolution trends improving?
- Cross-functional alignment: Are marketing, sales, and service teams operating from common metrics?
The strongest signal is simple: teams begin acting on insights instead of relying on instinct, isolated spreadsheets, or delayed analyst support.
Build Faster and Scale Smarter with FineBI
Building a customer intelligence dashboard manually is possible, but it is rarely simple. You need integrated pipelines, standardized metrics, governance rules, role-based access, automation logic, and dashboard designs that work for multiple stakeholders. That complexity is why many projects stall between proof of concept and trusted enterprise use.
This is where FineBI becomes the practical choice.
Instead of assembling the full workflow from scratch, teams can use FineBI to utilize ready-made templates and automate this entire workflow. That means faster deployment, more consistent metric design, and less dependence on manual reporting cycles.
 Get Ready-to-Use Dashboard Templates in Fine Gallery
FineBI helps enterprise teams by enabling them to:
- Connect data across CRM, marketing, service, and other business systems
- Build unified dashboards with flexible visualization for different roles
- Standardize metrics and improve governance
- Automate refreshes, alerts, and recurring reporting
- Support secure access and scalable self-service analytics
- Accelerate rollout with reusable dashboard templates
For organizations that want a customer intelligence dashboard without months of custom development overhead, FineBI offers the faster path to a trusted, action-oriented analytics environment.
The strategic takeaway is clear: define the business decisions, unify the data model, design for action, and then use a platform that reduces implementation friction. Building this manually is complex; use FineBI to utilize ready-made templates and automate this entire workflow.
FAQs
It brings customer data from CRM, marketing, service, billing, and sometimes product tools into one view. That helps teams understand behavior, value, risk, and the next best action across the full customer lifecycle.
A regular BI dashboard usually reports on one team or one function. A customer intelligence dashboard is cross-functional, showing how marketing, sales, onboarding, support, and retention affect each other.
Without a shared view, teams work from partial records and handoffs break down. Unifying the data improves lead prioritization, service context, retention visibility, and trust in reported numbers.
Common metrics include lead-to-opportunity conversion, win rate, customer acquisition cost, time to first response, resolution time, churn risk, renewal rate, and expansion revenue. The best mix depends on your goals across acquisition, service, and retention.
It is most useful for revenue operations, sales leaders, marketing teams, customer success managers, support leaders, and executives. Any team that needs a reliable customer view to act faster can benefit from it.


The Author
Lewis Chou
Senior Data Analyst at FanRuan
Related Articles

ERP Reporting Explained: What It Is, How It Works, and Why Enterprise Teams Rely on It
ERP reporting is the process of turning data inside your enterprise resource planning system into usable business insight. For finance leaders, operations directors, supply chain managers, and IT teams, that matters beca
Yida Yin
Jun 25, 2026
8 Best Restaurant Reporting Software Tools for 2026: Compare FineReport, Toast, SpotOn & More
$1 is a highly customizable business intelligence and reporting platform that helps restaurants turn POS, labor, inventory, finance, and multi location data into real time dashboards and decision ready reports. 8 Best Re
Yida Yin
Jun 24, 2026

Database Reporting Architecture: When to Use a Reporting Database vs Your Operational System
$1 is not just about pulling data into a dashboard. It is an architecture decision that affects application performance, reporting speed, data trust, and how confidently your teams can make decisions. If you are an IT ma
Yida Yin
Jun 24, 2026