A retail business dashboard is a visual tool that helps store owners, managers, and retail teams track the numbers that matter most in one place. Instead of checking separate systems for sales, inventory, staffing, and customer activity, a dashboard brings that information together so teams can quickly see how the business is performing and where action is needed.
For modern retailers, speed matters. A store can lose revenue because of a stockout, poor staffing during busy hours, or a promotion that is not converting as expected. A well-designed retail business dashboard makes those issues easier to spot early, helping stores improve performance, reduce waste, and make better decisions every day.
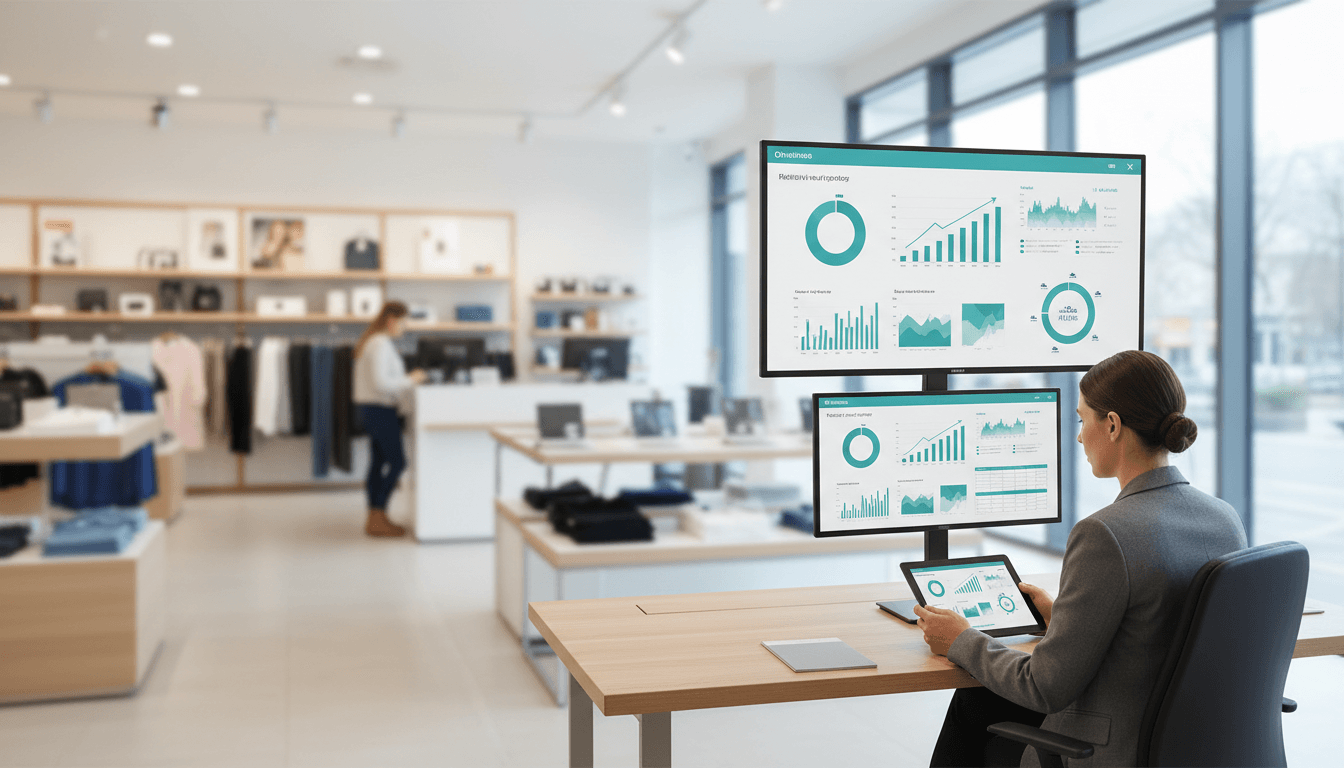
A retail business dashboard is a centralized screen or interface that displays key retail metrics in a simple, visual format. It usually includes charts, tables, trend lines, alerts, and KPI cards that show current performance at a glance.
In simple terms, it is the control center for a retail operation.
Rather than pulling data manually from multiple systems, a dashboard combines information from:
This gives retail teams one clear view of what is happening across the business.
A retail business dashboard is especially useful because store performance depends on many connected factors. For example, rising foot traffic is good, but if conversion rate drops, sales may still underperform. Likewise, strong demand does not help much if top-selling items are out of stock. A dashboard helps teams understand these relationships instead of looking at each number in isolation.
It is also important to understand how a dashboard differs from a report or spreadsheet:
A spreadsheet can hold data, and a report can explain performance, but a dashboard is designed for quick monitoring and fast decisions. That is what makes it so valuable in retail, where conditions can change hour by hour.
The best retail business dashboard focuses on the metrics that directly affect profit, efficiency, and customer experience. While every retailer has different priorities, most dashboards include four major categories of KPIs.
Sales metrics are the core of any retail business dashboard because they show how effectively the store is generating revenue.
Important sales and revenue metrics include:
These metrics help retailers answer practical questions such as:
For example, a store may show strong total sales, but if gross margin is declining, discounting or poor product mix could be hurting profitability. That is why sales should never be viewed on revenue alone.
Inventory is one of the biggest cost and performance drivers in retail. Too little stock leads to missed sales. Too much creates cash flow pressure and markdown risk.
A useful retail business dashboard should track:
These metrics help stores maintain balance. High sell-through may be a positive sign, but if it is paired with frequent stockouts, replenishment may be too slow. Low inventory turnover may suggest overbuying or weak demand. Shrinkage can reveal operational problems that quietly reduce profit.
Product-level visibility is especially valuable for identifying:
Retail performance is not only about products and sales totals. It is also about understanding customer behavior and the effectiveness of promotions.
Key customer and marketing metrics include:
These KPIs can reveal why performance is changing.
For instance:
Retailers that monitor customer metrics alongside sales metrics get a fuller view of store health and can improve both acquisition and retention.
Store operations have a direct effect on revenue, service quality, and cost control. That is why operational KPIs belong on a retail business dashboard as well.
Common staff and operations metrics include:
These indicators help store leaders balance service and efficiency.
For example, cutting labor costs too aggressively may hurt customer support and reduce conversion. On the other hand, overstaffing can reduce profitability if traffic does not justify payroll levels. Monitoring labor cost together with sales per employee gives a clearer picture of staffing effectiveness.
Return rate is another important operational metric. A rising return rate may suggest product quality issues, inaccurate product descriptions, or problems with customer expectations. Checkout wait time matters because long lines can create abandoned purchases and poor customer experiences.
Different dashboards serve different users. Store associates, inventory planners, and executives all need a different level of detail. Here are some common examples of how a retail business dashboard can be used in practice.
A daily store performance dashboard is built for store managers and frontline leaders who need to make fast decisions throughout the day.
It often highlights:
This type of dashboard helps managers answer immediate questions such as:
If sales drop sharply during a high-traffic period, the dashboard may show whether conversion has fallen, whether checkout wait times are too long, or whether top items are out of stock. That allows a manager to take action in real time instead of waiting until the day is over.
An inventory management dashboard is focused on product flow and stock health. It is especially useful for buyers, inventory planners, operations teams, and store managers.
Typical elements include:
This dashboard helps retailers reduce both stockouts and excess inventory. For example, if a product is selling faster than expected, the dashboard can flag low-stock risk early. If another item has high on-hand inventory and weak sell-through, the team can plan markdowns or shift stock to another location.
Supplier timing is another major benefit. If a vendor has a long lead time, replenishment decisions need to happen sooner. A dashboard makes these timing issues more visible so the business can respond before shelves go empty.
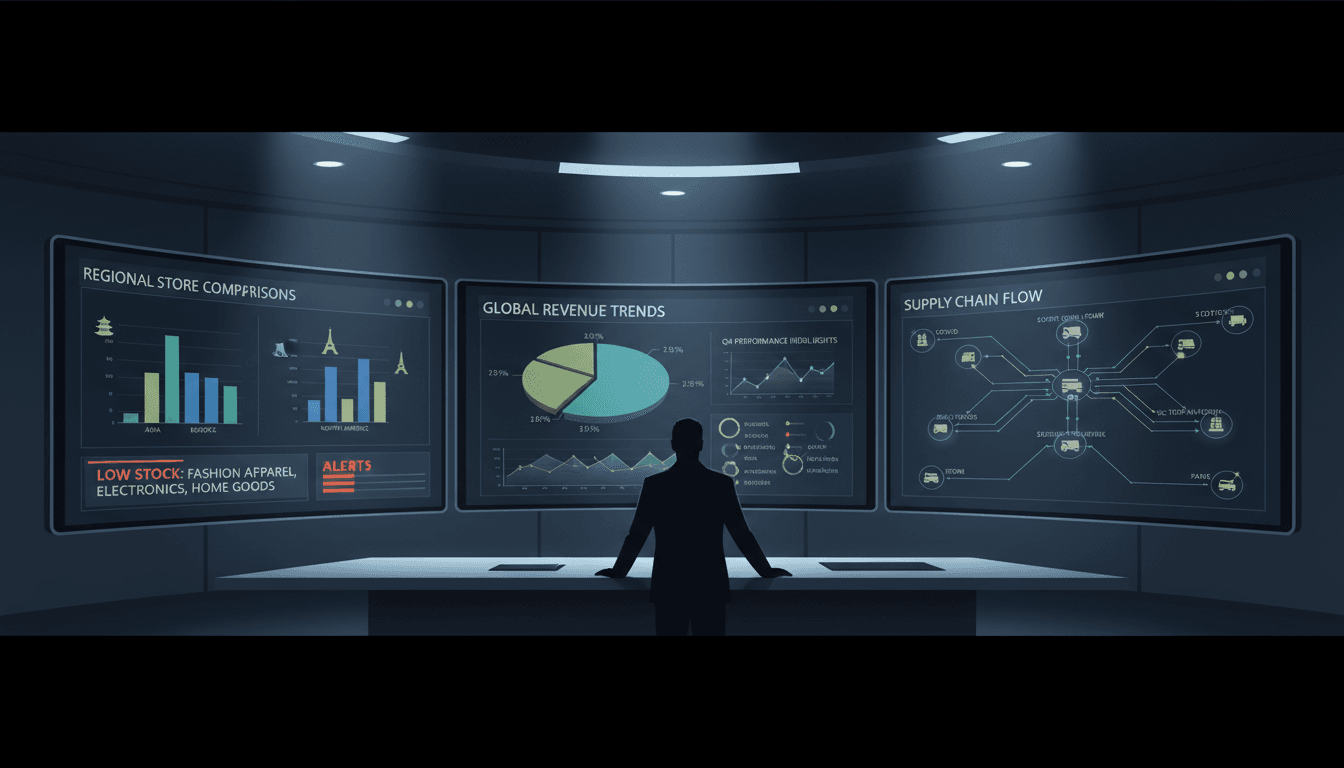
A multi-store executive dashboard gives regional managers, directors, and business owners a high-level view across locations.
It usually compares:
This type of retail business dashboard is useful for identifying which stores need attention and why.
For example, one store may be exceeding its sales goal but showing unusually high labor cost. Another may have strong traffic but weak conversion. A third may be underperforming because of repeated stockouts in top categories. By comparing locations side by side, leaders can find best practices, spot risks, and allocate support more effectively.
Exception alerts are especially helpful at the executive level. Instead of reviewing every metric for every store in detail, leaders can focus on locations that fall outside expected ranges.
A retail business dashboard delivers value far beyond convenience. It improves visibility, speed, and alignment across the organization.
One of the biggest benefits is faster decision-making with real-time visibility into store performance. When data updates quickly, teams do not have to wait for end-of-day reports to know what is happening. They can respond to issues while there is still time to change the outcome.
Another major benefit is better inventory control and fewer lost sales from stock issues. Dashboards make it easier to see low-stock trends, slow-moving items, and imbalances between stores. That leads to smarter replenishment and less revenue lost to empty shelves.
Retail dashboards also create clearer accountability for teams, managers, and store leaders. When KPIs are visible and shared, expectations become easier to understand. Each person can see how their actions affect performance, whether the goal is improving conversion, reducing shrinkage, or increasing average order value.
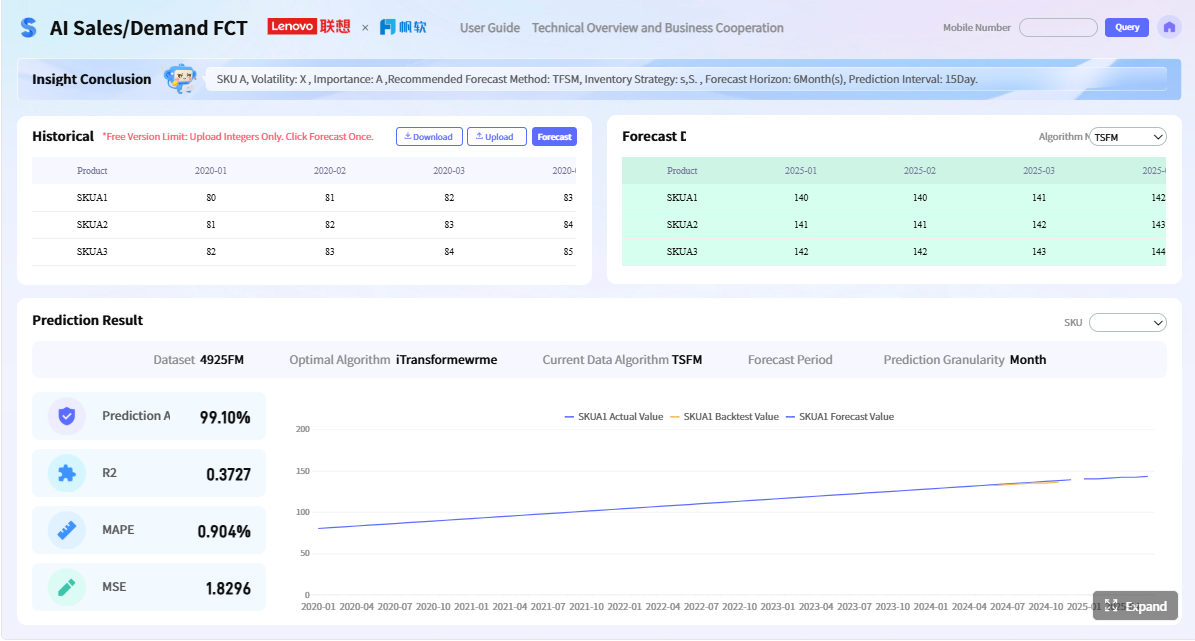
A strong dashboard also supports better forecasting and planning based on historical trends. By reviewing patterns over time, retailers can improve staffing schedules, prepare for seasonal demand, set more accurate targets, and make smarter purchasing decisions.
Additional benefits often include:
In short, a retail business dashboard helps turn data into action.
Not all dashboards are equally useful. The best one is not necessarily the one with the most charts. It is the one that helps the right people make better decisions quickly and consistently.
When evaluating a retail business dashboard, look for features that improve usability and decision-making.
Important features include:
Other useful features may include:
A dashboard should make complex retail data easier to understand, not harder. Clear design and relevant metrics matter as much as technical capability.
Retailers often reduce the value of a dashboard by using it poorly. Some of the most common mistakes include:
Another common issue is using the same dashboard for every role. Executives usually need summary trends and exceptions, while store managers need operational detail. If the dashboard is not tailored to the user, it becomes less actionable.
It is also a mistake to focus only on lagging indicators like monthly revenue without including leading indicators such as traffic, conversion, stock availability, or staffing coverage. Leading indicators help teams prevent problems, not just review them later.
If you are implementing a retail business dashboard for the first time, start simple.
A practical approach is to:
For many retailers, a strong starting set of KPIs includes:
From there, you can expand based on the needs of the business.
It also helps to assign ownership. Someone should be responsible for reviewing dashboard accuracy, monitoring trends, and making sure insights turn into action. Teams should know what steps to take when a KPI goes off target.
Finally, review the dashboard regularly and improve it over time. As the business changes, your metrics and dashboard design should evolve too.
A retail business dashboard is one of the most useful tools for improving store performance. It gives retailers a clear, connected view of sales, inventory, customer behavior, and operations, all in one place. That visibility makes it easier to spot problems early, identify opportunities, and keep teams focused on the metrics that drive results.
Whether you manage a single store or a growing chain, the right dashboard can help you make faster decisions, improve inventory control, and strengthen accountability across the business. Start with the core KPIs, keep the dashboard focused, and use the insights consistently. When done well, a retail business dashboard becomes more than a reporting tool. It becomes a daily guide for smarter retail performance.
A retail business dashboard brings sales, inventory, customer, and operational data into one visual view so teams can monitor performance quickly. It helps store managers spot issues early and make faster decisions.
A strong retail dashboard usually tracks sales, gross margin, average order value, stock levels, sell-through rate, stockouts, foot traffic, conversion rate, and promotion results. The best mix depends on the store’s goals and daily decisions.
A dashboard is designed for fast, ongoing monitoring with visual KPIs that update regularly. Reports and spreadsheets are more useful for detailed review, manual analysis, or historical records.
Inventory metrics help retailers avoid stockouts, reduce overstock, and protect cash flow. They also show which products are moving quickly, which items are underperforming, and where replenishment is needed.
It improves store performance by making trends and problems easier to see, such as falling conversion, weak margins, or poor promotion results. With clearer visibility, teams can respond faster and improve revenue, efficiency, and customer experience.
The Author
Eric
Related Articles
How to Build a Salesforce KPI Dashboard: Pipeline, Forecast, and Win-Rate Metrics for Revenue Leaders
Learn to build a Salesforce KPI dashboard for revenue leaders. Track pipeline coverage, forecast accuracy, and win-rate metrics to drive better decisions.
Lewis Chou
May 11, 2026

Warehouse Metrics Dashboard: A Scenario-Based Guide for Operations Directors to Turn Live KPIs Into Daily Decisions
Learn how operations directors use warehouse metrics dashboards to monitor KPIs like throughput and labor cost to improve efficiency.
Yida Yin
May 11, 2026

12 Email Marketing Dashboard Examples for Executives: KPI Views That Tie Campaigns to Pipeline and Revenue
Executives do not need another email report full of opens, clicks, and subject line winners. They need $1 examples that answer harder business questions: Which programs are creating pipeline? Which campaigns are influenc
Yida YIn
Jan 01, 1970


