Business reporting is how organizations turn raw operational data into decisions, accountability, and follow-up. For executives, it provides visibility into whether the business is on plan. For analysts, it creates a structured way to communicate performance and exceptions. For IT teams, it establishes the governed reporting foundation that makes trusted decision-making possible.
In practice, business reporting is not just about sending out a spreadsheet or publishing a dashboard. It is the repeatable process of defining metrics, gathering and validating data, presenting results in the right format, and making sure the right people act on what the report shows.
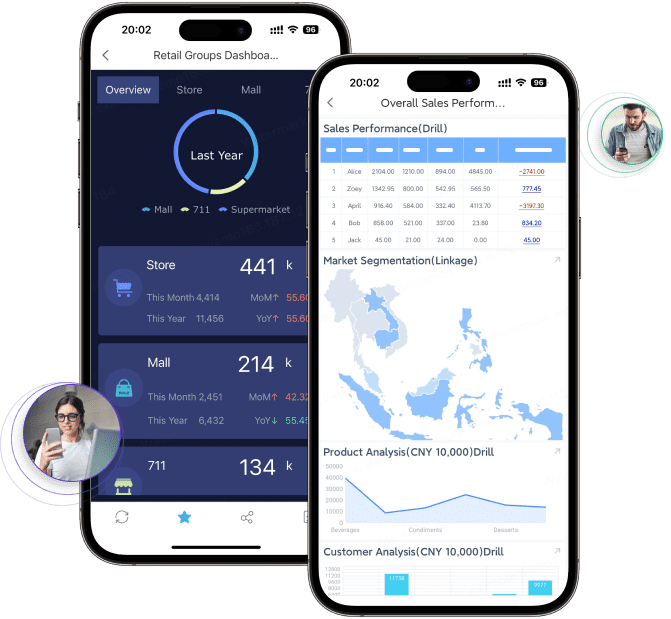
Today, that process is also being upgraded by AI. With FineReport + Dora, teams can ask for a report summary in chat, generate structured narratives from trusted report assets, receive scheduled briefings, and push exceptions to the right owner. That means reporting is no longer limited to people manually opening dashboards and writing updates. It becomes a more scalable, governed workflow for reporting consumption and follow-up.
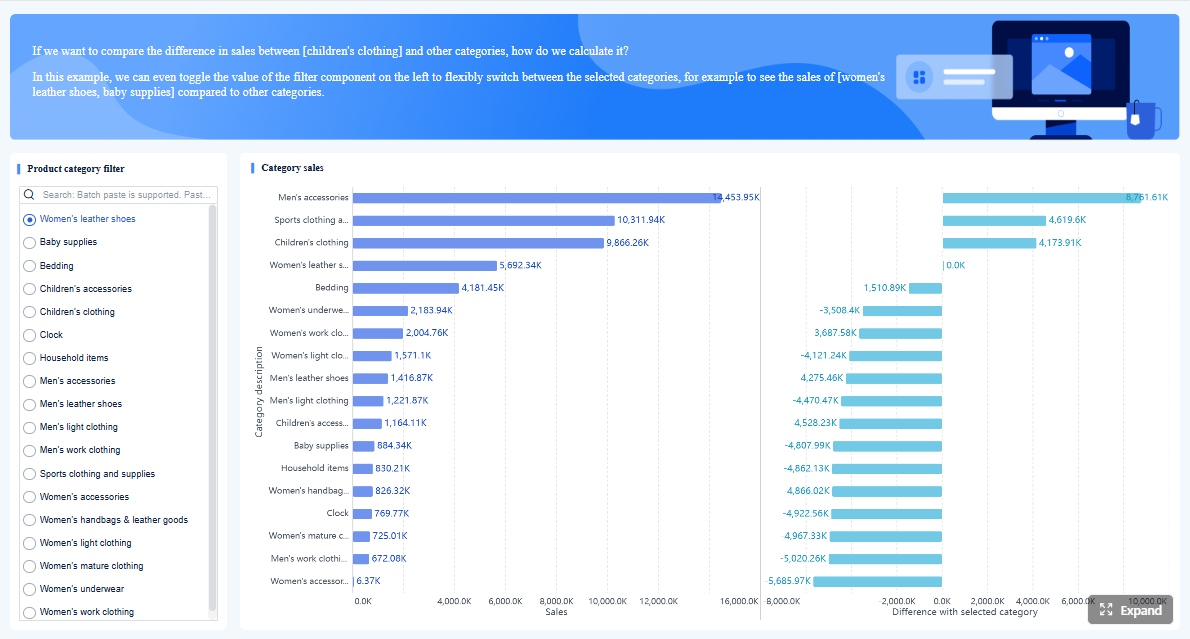 Click To Try The Dashboard
All reports in this article are built with FineReport
What business reporting is and why it matters
Business reporting is the structured practice of collecting, organizing, and presenting business information so leaders and teams can understand performance and take action. It sits between raw data and real decisions.
For different roles, the meaning is slightly different:
- Executives use business reporting to monitor outcomes, spot risks, and allocate resources.
- Analysts use it to transform data into evidence, trends, and recommendations.
- IT teams use it to provide secure, reliable, governed access to trusted reporting assets.
A good reporting system answers a few basic questions clearly:
- What happened?
- Compared with what?
- Why does it matter?
- Who needs to respond?
- What should happen next?
Without that structure, organizations often end up with too many disconnected reports, inconsistent KPI definitions, delayed updates, and unclear ownership. Reporting becomes noise instead of guidance.
How reporting turns operational data into decisions, accountability, and action
Operational systems generate data constantly: orders, invoices, tickets, production events, approvals, customer interactions, and financial entries. That data is useful only when it is translated into business meaning.
Reporting does that translation by organizing information into business-ready views such as:
- daily operations status
- weekly sales performance
- monthly financial variance
- compliance status updates
- risk and exception summaries
This is what makes reporting essential. It creates a shared version of truth that decision-makers can use to evaluate performance, hold owners accountable, and drive follow-up.
For example:
- A late delivery report helps operations leaders intervene before service levels worsen.
- A margin variance report helps finance identify cost pressure and pricing issues.
- A compliance status report helps management reduce regulatory exposure.
- A vendor risk report helps procurement and risk teams review third-party exposure.
In each case, the report is not the final goal. The goal is better action.
The difference between routine reporting, analysis, dashboards, and business intelligence
These terms are related, but they are not identical.
- Routine reporting is recurring communication of business performance using defined formats and schedules. Examples include daily operations reports, weekly pipeline updates, and monthly management packs.
- Analysis goes deeper into causes, drivers, scenarios, and implications. It often begins where a report identifies a problem or opportunity.
- Dashboards provide visual monitoring of KPIs and trends, often in near real-time or periodic refresh cycles. They are useful for ongoing visibility.
- Business intelligence is the broader capability that includes data integration, modeling, governance, reporting, dashboards, and analytics.
A useful way to think about it:
- Reporting tells you what is happening.
- Analysis helps explain why it is happening.
- Dashboards help monitor how things are moving.
- BI provides the platform and governance that make all of it reliable.
With FineReport as the reporting foundation, organizations can build formatted reports, management reports, operational cockpits, and reporting workflows. Dora then upgrades how people consume and act on those assets through natural-language query, structured summaries, alerting, and follow-up.
Core types of reports organizations rely on
Most organizations depend on several categories of business reporting. Each serves a different decision cycle, audience, and level of detail.
Operational reports
Operational reports track day-to-day performance, workflows, service levels, throughput, and exceptions. They help frontline managers and operations leaders see whether execution is on track.
Common examples include:
- order fulfillment status
- production output and downtime
- service response times
- inventory movement
- exception backlogs
- delivery delays
Report Element: Throughput and volume
Definition: Measures the number of transactions, units, tasks, or cases completed in a defined period.
Business value: Shows whether operations are keeping pace with demand and capacity expectations.
AI use: Dora can summarize throughput changes, compare performance across teams, and include this section in a scheduled operations briefing.
Report Element: SLA or service level performance
Definition: Tracks whether response, resolution, or delivery targets were met.
Business value: Helps leaders protect customer experience and identify process bottlenecks early.
AI use: Dora can explain missed service levels, highlight overdue items, and push exception alerts to responsible owners.
Report Element: Exception and backlog list
Definition: A structured list of delayed, failed, high-risk, or unprocessed items requiring attention.
Business value: Turns reporting into action by identifying what needs follow-up now.
AI use: Dora can retrieve exception lists from FineReport assets, summarize root patterns, and notify the right manager through governed AI workflow.
Financial and management reports
Financial and management reports summarize revenue, expenses, profitability, budgets, cash position, and variance against targets. They are essential for executives, finance managers, and business unit leaders.
Typical examples include:
- monthly P&L reports
- budget vs actual reports
- profitability by product or region
- cash flow summaries
- management board packs
- department cost reports
Report Element: Revenue performance
Definition: Tracks income generated over a period, often by product, region, channel, or customer segment.
Business value: Provides the top-line view needed for planning, forecasting, and growth decisions.
AI use: Dora can produce a structured revenue summary, explain major shifts, and answer follow-up questions in chat.
Report Element: Cost and expense variance
Definition: Compares actual spending against budget, prior period, or forecast.
Business value: Helps finance and business leaders control spending and identify cost pressure early.
AI use: Dora can highlight abnormal cost movements, explain variance sections, and include them in recurring management briefings.
Report Element: Profitability and margin
Definition: Measures how much profit remains after direct or total costs.
Business value: Supports pricing, portfolio, and performance optimization decisions.
AI use: Dora can summarize margin drivers, compare segments, and flag profitability exceptions for review.
Compliance and external reports
Compliance and external reports are designed for regulators, auditors, investors, lenders, boards, or other outside stakeholders. They require higher consistency, stronger controls, and clear ownership.
Examples include:
- regulatory disclosures
- ownership reporting
- risk reports
- audit submissions
- statutory financial reports
- external board and stakeholder reports
Report Element: Filing completeness and status
Definition: Shows whether required disclosures, supporting data, and approvals are complete and submitted on time.
Business value: Reduces regulatory risk and strengthens accountability.
AI use: Dora can monitor due items, summarize submission status, and send scheduled reminders or alerts.
Report Element: Risk exposure summary
Definition: Consolidates key areas of operational, financial, credit, or compliance risk.
Business value: Helps leadership identify concentration, escalation needs, and control gaps.
AI use: Dora can generate management-ready narratives from trusted risk reports and push exception summaries to owners.
Report Element: Approval and audit trail status
Definition: Records review steps, sign-offs, and version changes associated with formal reporting.
Business value: Supports control, traceability, and confidence in published information.
AI use: Dora can help users retrieve the latest approved report context and summarize pending review items.
Customer, market, and credit-related reports
These reports support commercial planning, account evaluation, partner review, and third-party business assessment.
Examples include:
- sales performance by region or segment
- customer retention reports
- account health summaries
- market performance tracking
- partner evaluation reports
- third-party credit and risk reviews
Report Element: Customer acquisition and retention
Definition: Measures new customers gained and existing customers retained over time.
Business value: Helps sales and customer teams evaluate growth quality and loyalty.
AI use: Dora can summarize trends, explain movement by region or segment, and prepare weekly commercial briefings.
Report Element: Pipeline and conversion performance
Definition: Tracks lead progression, opportunity value, close rates, and stage movement.
Business value: Supports forecasting and sales execution management.
AI use: Dora can answer natural-language questions about pipeline health and produce chart-based summaries from FineReport dashboards.
Report Element: Credit or third-party risk indicators
Definition: Shows payment behavior, exposure level, rating changes, or partner risk signals.
Business value: Helps organizations reduce loss exposure and improve partner selection.
AI use: Dora can detect threshold breaches, summarize risk changes, and push follow-up tasks to account or risk owners.
How the reporting process works from data to decision
Business reporting is not one activity. It is a managed process that connects business needs, data, presentation, review, and action.
Define audience, objectives, and metrics
Strong business reporting starts with the business question, not the chart.
Teams should define:
- who the report is for
- what decision the audience needs to make
- which KPIs matter
- how success will be judged
- what level of detail is appropriate
Executives usually need fewer metrics, more context, and a stronger focus on implications. Operational teams often need greater detail and faster cadence. Analysts need consistent metric definitions so comparisons remain meaningful over time.
This is where many reporting programs fail. They start by extracting available data instead of clarifying decision intent.
Gather, validate, and structure data
After objectives are clear, teams need to combine and prepare data from source systems such as ERP, CRM, finance systems, operational platforms, spreadsheets, and external data feeds.
This stage includes:
- mapping source systems
- standardizing KPI definitions
- reconciling business terms
- checking completeness and timeliness
- handling missing or conflicting values
- structuring data for report templates and dashboards
For IT teams, this is the foundation of trust. If metric logic changes across departments, executive reporting loses credibility quickly.
FineReport helps by providing the governed reporting layer where report templates, KPI logic, permissions, and operational cockpits can be standardized. That foundation matters even more when AI is introduced, because AI outputs are only as useful as the underlying report assets and semantic rules.
Build, review, and distribute reports
Once data is prepared, the report needs to be built in a format that matches the audience and use case.
Possible delivery formats include:
- formatted management reports
- board packs
- tabular operational reports
- interactive dashboards
- scheduled email distributions
- mobile-friendly views
- workflow-based approvals
The review process should be defined as well:
- who validates the numbers
- who approves release
- which version is official
- when it is distributed
- which users can access which sections
This is where enterprise reporting platforms outperform ad hoc file sharing. They improve consistency, reduce manual assembly, and preserve access control.
Turn reports into action
A report has limited value if nobody acts on it. Mature reporting processes connect findings to follow-up.
That means each report should ideally help answer:
- which items need attention
- who owns the response
- what threshold triggered concern
- when follow-up is due
- how progress will be tracked
This is also where AI can create real operating value. Instead of asking users to manually read every report, spot every issue, write every summary, and send every reminder, an enterprise Data Agent can help automate report consumption and exception follow-up in a governed way.
How an AI Data Agent Automates Report Consumption
Many organizations have already built reports and dashboards. The problem is not only report creation. The bigger issue is report consumption at scale.
Executives want summaries, not just pages. Managers want exception alerts, not just static data. Business users want quick answers without searching through dozens of reports. IT wants a controlled AI path that respects permissions, KPI definitions, and trusted assets.
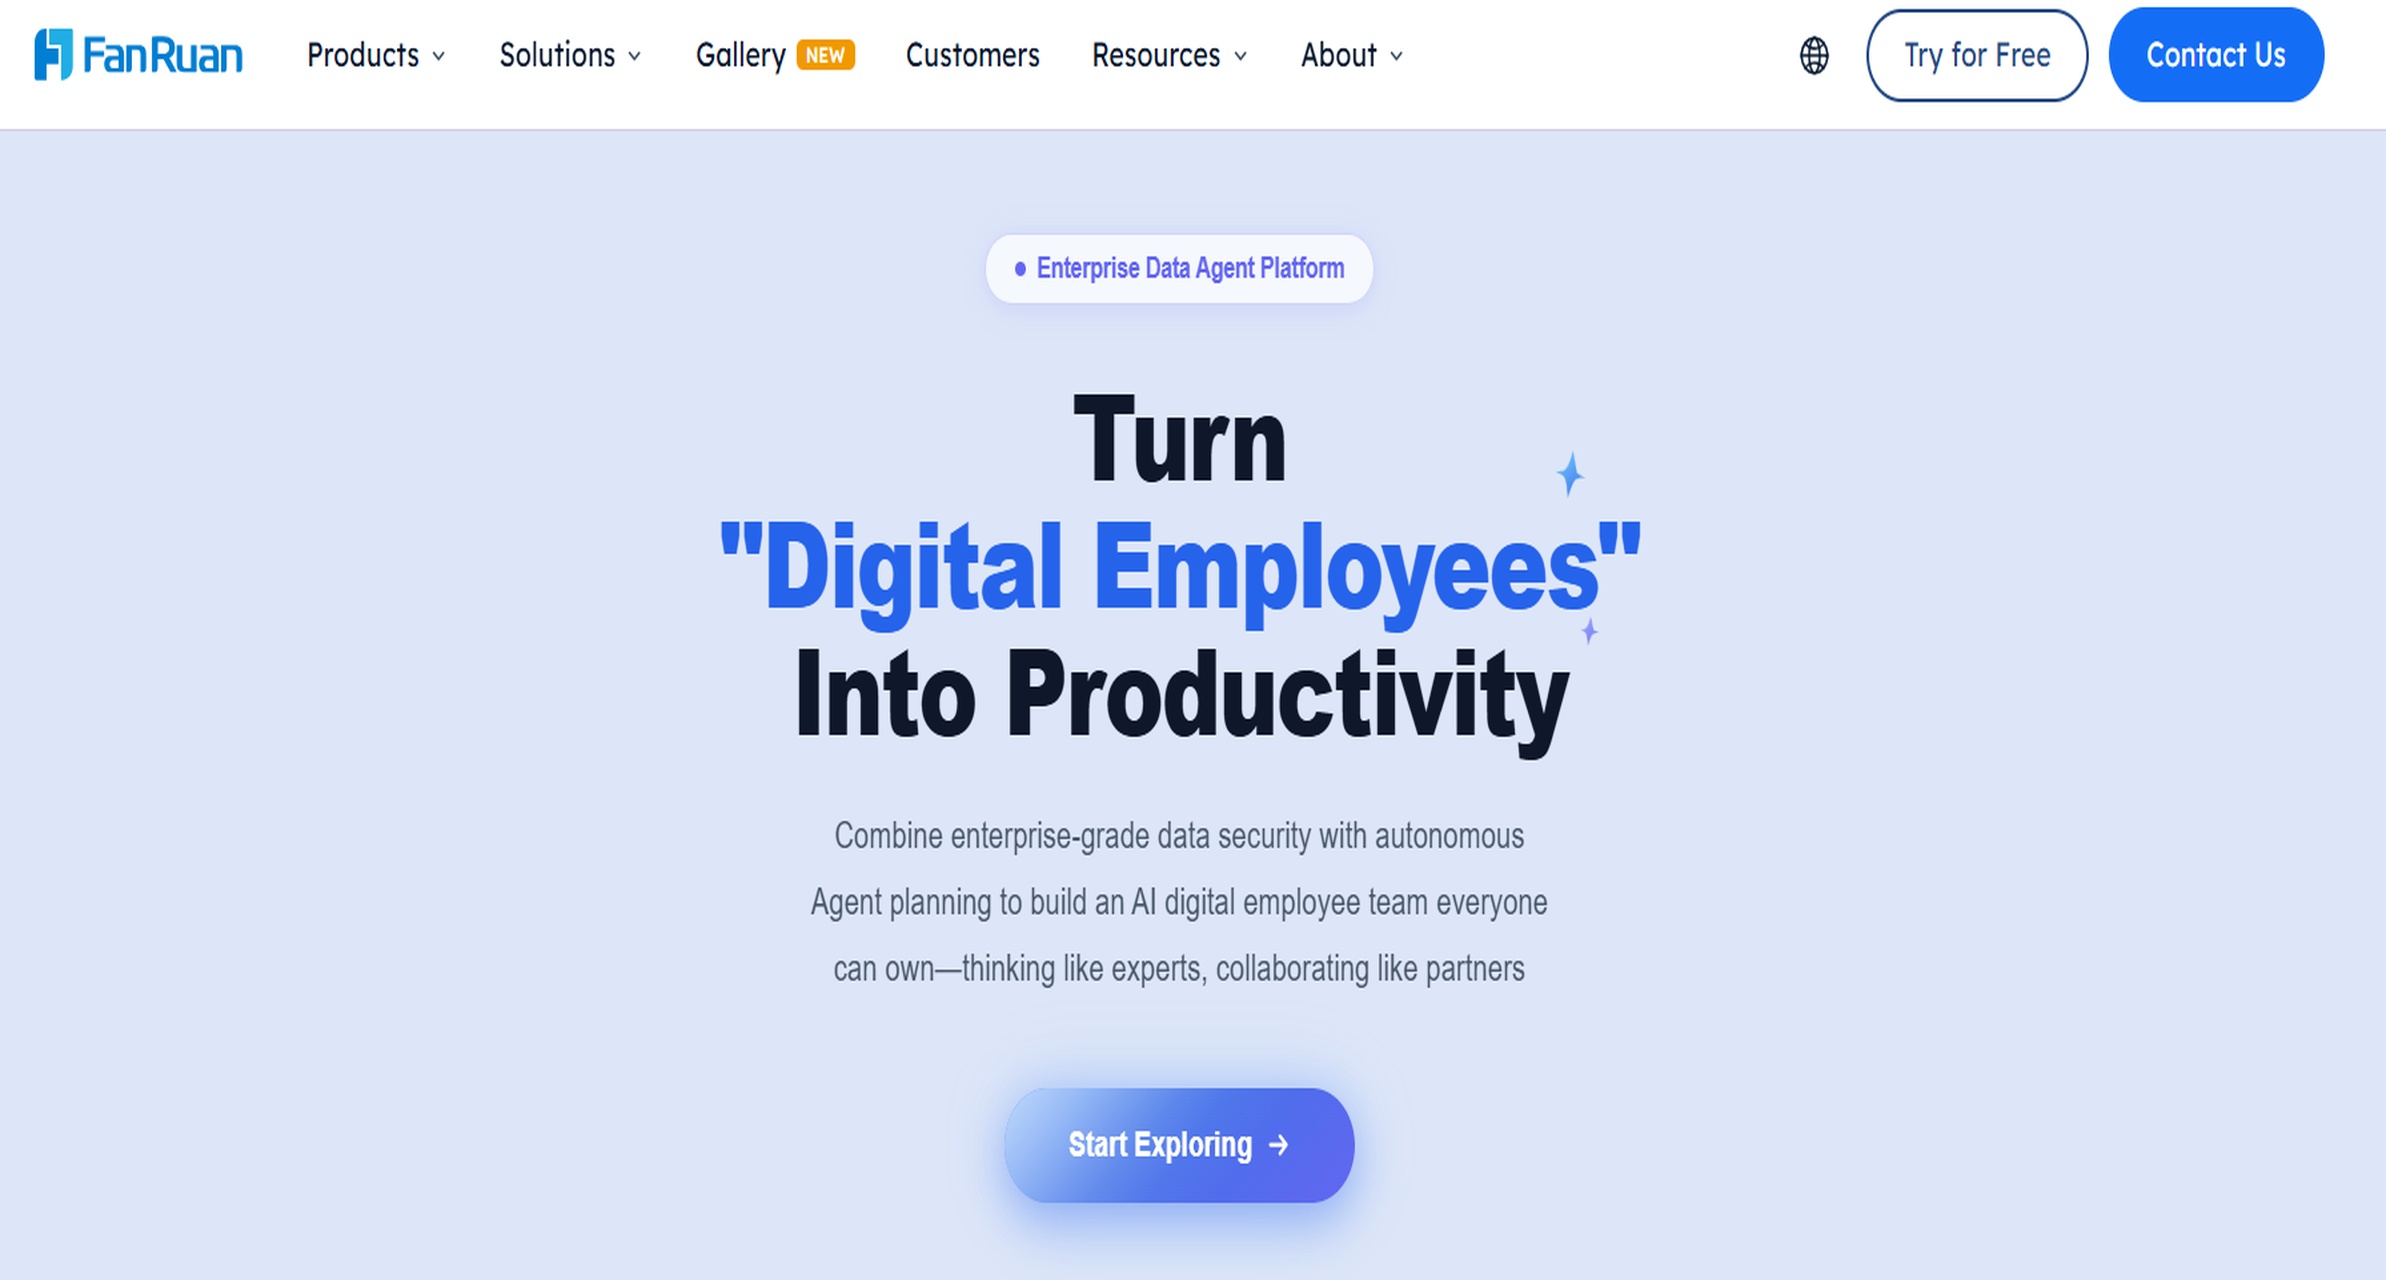
This is where Dora, FanRuan’s enterprise Data Agent platform, adds value on top of FineReport.
Dora should be positioned as a scenario-specific AI assistant or AI digital employee, not a generic chatbot. It works over trusted reporting assets and governed semantic rules to help people query, summarize, explain, push, and follow up on reporting outputs.
A strong fit for business reporting is the Daily Briefing Secretary combined with the Report Researcher and, in exception-heavy cases, the Risk Alert Officer.
A practical chat example
A business leader could ask:
“Summarize this month’s business reporting package, highlight abnormal cost changes, list missed operational targets, and identify the departments that need follow-up.”
Dora can use trusted FineReport outputs to respond with a structured report summary rather than a vague AI answer.
A 6-step AI workflow for reporting automation
-
Retrieve trusted FineReport report or operational cockpit data
Dora accesses the relevant formatted report, cockpit, KPI view, or exception list built in FineReport. -
Understand KPI definitions, filters, templates, and business terms
Dora works against governed semantic rules so terms like revenue, backlog, gross margin, or overdue rate are interpreted correctly. -
Generate a structured report summary through chat
Dora creates a clear management narrative, chart explanation, or section-by-section summary based on trusted report assets. -
Detect exceptions and abnormal changes
Dora checks defined thresholds, unusual movement, overdue items, or risk conditions relevant to the reporting scenario. -
Push summaries, alerts, and suggested follow-up
Dora can distribute periodic briefings, send exception notifications, and direct follow-up items to responsible users. -
Create review and follow-up records
Dora supports recurring reporting workflows by producing daily or weekly recap outputs and preserving action visibility.
The relevant Dora digital employee
For most business reporting scenarios, the best-fit Dora role is the Daily Briefing Secretary.
Its value is practical:
- prepares scheduled report summaries
- converts recurring reporting into readable management narratives
- reduces time spent manually opening, reviewing, and rewriting reports
- helps leaders prepare for meetings with faster context
- pushes the right summary to the right person at the right time
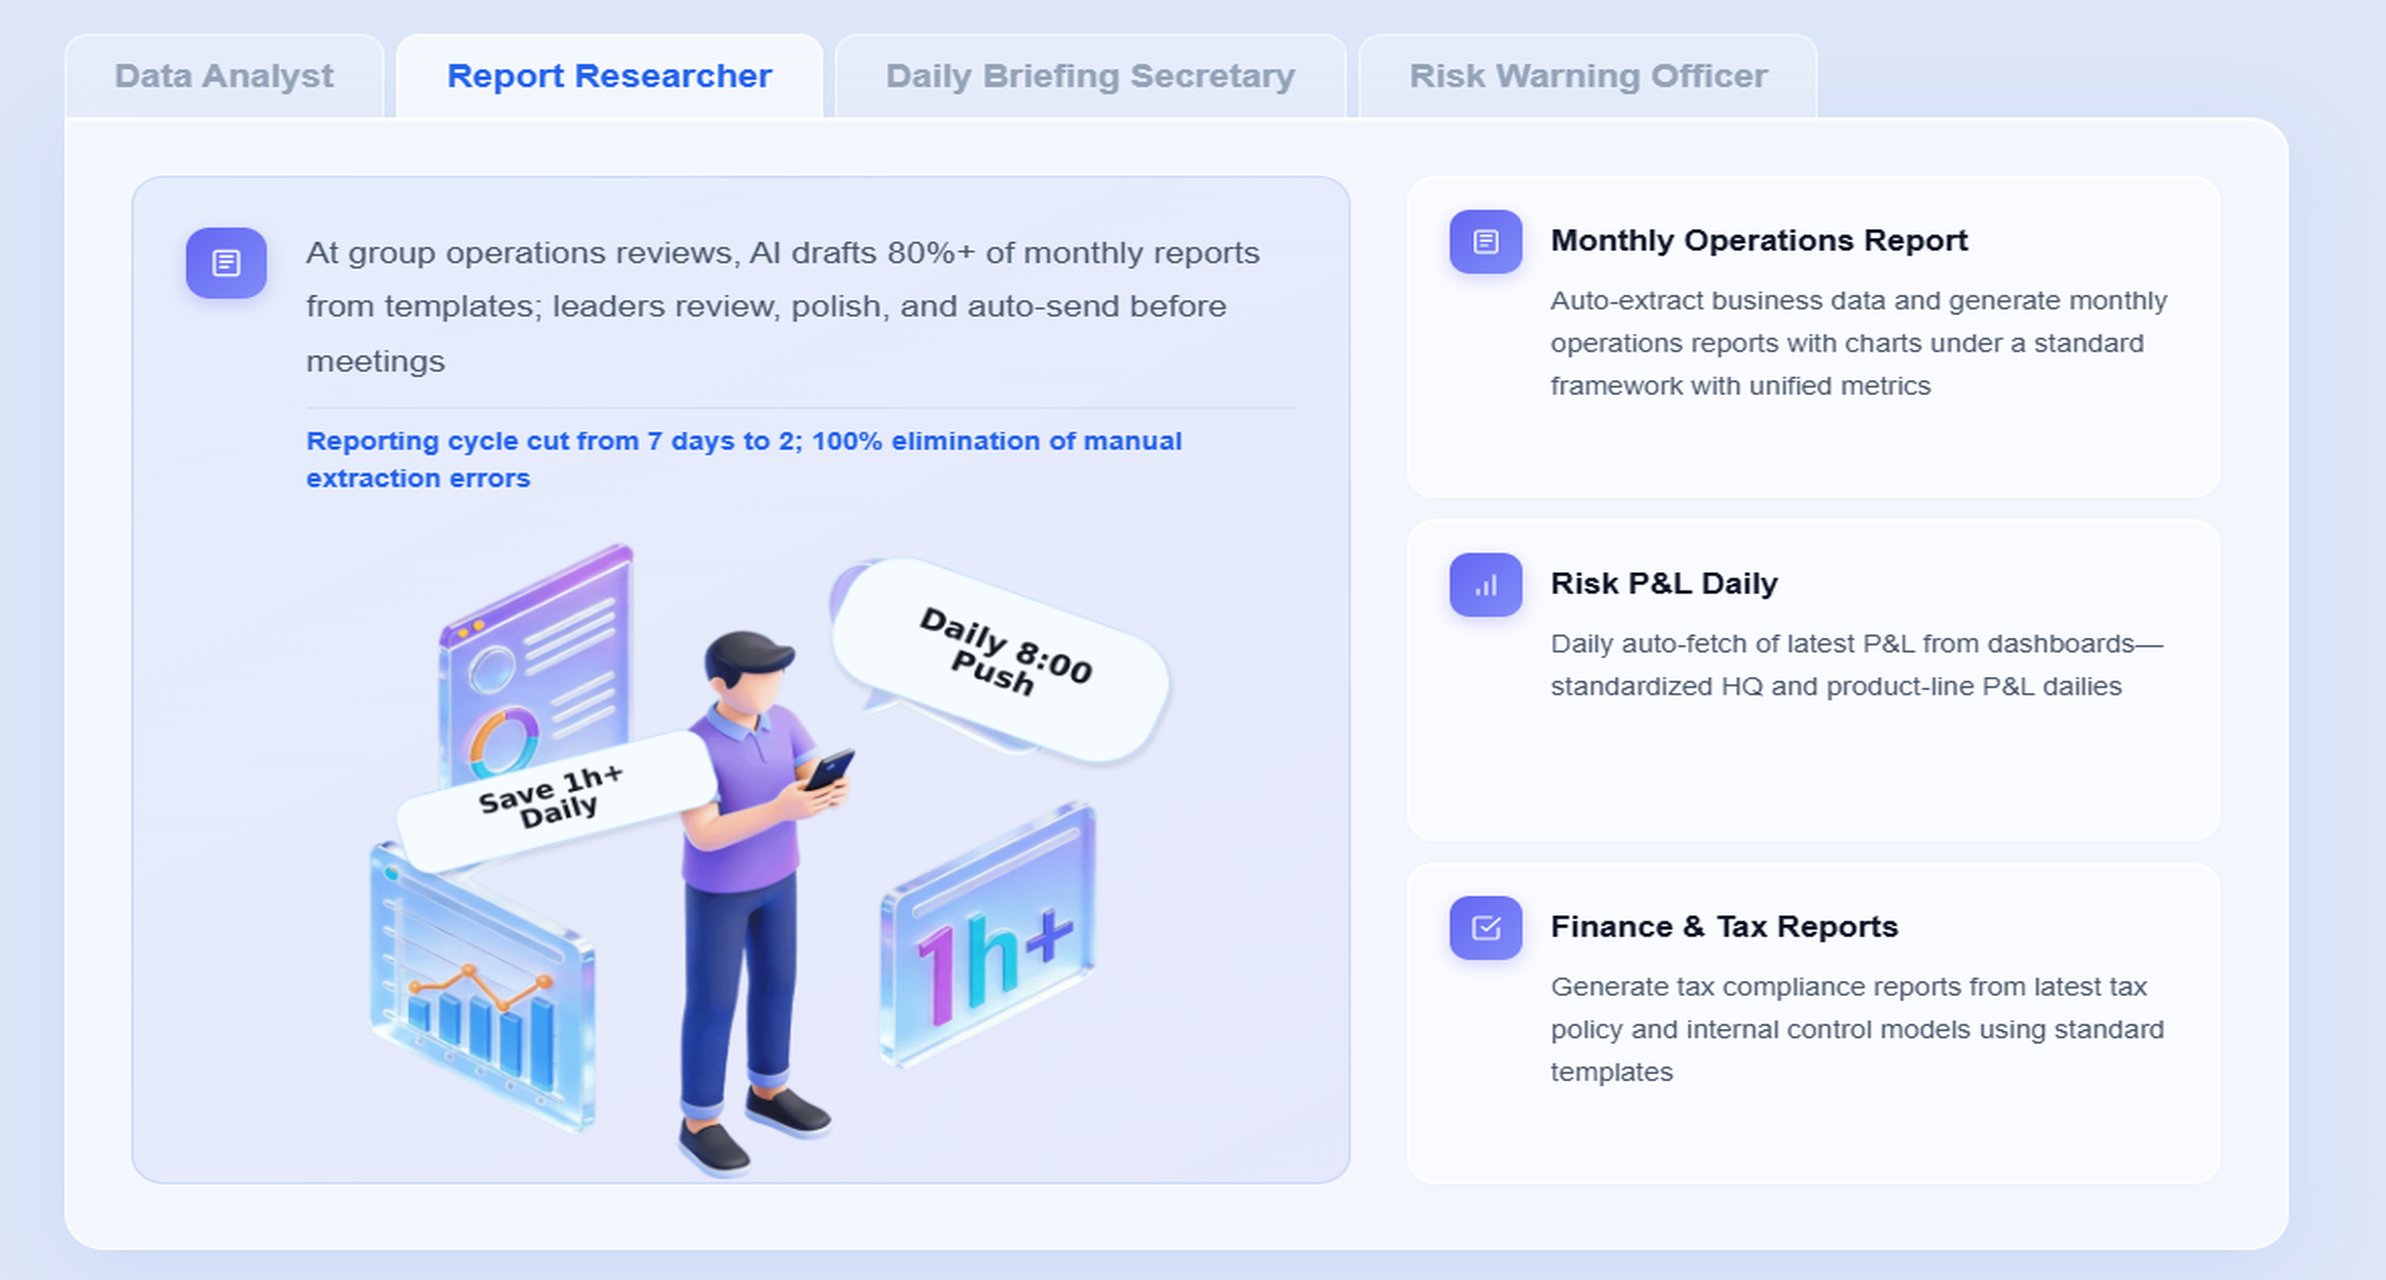
In more investigative scenarios, the Report Researcher helps users generate deeper structured summaries and explain charts. In exception-heavy workflows, the Risk Alert Officer can monitor thresholds and send follow-up alerts.
How FineReport provides the trusted reporting foundation
Dora works best when the reporting environment is already governed.
FineReport provides that foundation through:
- formatted enterprise reports
- management reports
- operational cockpits
- workflow-based reporting
- KPI standardization
- report templates
- access permissions
- scheduled reporting automation
This is important because AI reporting should not depend on uncontrolled prompts alone. Enterprise users need answers grounded in trusted report assets, permissions, and semantic definitions.
That is why FineReport builds the trusted reporting and operational cockpit foundation, while Dora turns that foundation into a scenario-specific AI assistant or digital employee.
How Dora improves execution beyond traditional reporting
Traditional reporting often stops at publication. Dora extends execution.
With Dora, users can:
- ask natural-language questions over trusted reporting assets
- retrieve reports, cockpits, metrics, and exceptions through chat
- receive structured report summaries and chart explanations
- get scheduled daily or weekly briefings
- receive exception alerts and push notifications
- support repeatable workflows through digital employees
- use Skills-based execution for more controllable and auditable AI workflows
This approach typically lands better in enterprises than feature-only AI comparisons because it is connected to real reporting scenarios, real governance, and real follow-up processes.
It also offers a more enterprise-ready Agentic BI path than raw prompt-only agents because it is designed for permissions, semantic rules, KPI governance, report templates, and stable workflow execution. That helps reduce token waste, improve response speed, and increase workflow stability without overpromising unsupported autonomy.
How to create useful reports that executives will actually use
The best business reporting is not the longest or most detailed. It is the most usable.
Focus on clarity, relevance, and context
Executives do not need every available number. They need the few numbers that explain performance, risk, and required decisions.
Useful reports should make clear:
- what changed
- compared with which baseline
- whether the change is good or bad
- what caused it
- what requires attention now
That means context matters as much as data. A 5% variance without explanation is less useful than a concise note that says the variance came from freight cost increases in two regions and requires pricing review.
Choose visuals and narrative carefully
Charts and tables should make patterns easier to understand, not harder.
Use:
- line charts for trends over time
- bar charts for comparisons
- tables for precise detail
- status indicators for thresholds and exceptions
- short commentary for interpretation
The narrative should be concise and decision-oriented. A short structured summary often works better than a page of descriptive text.
This is another area where Dora adds value. Instead of requiring analysts to manually write every recurring summary, Dora can generate structured report summaries and chart explanations from trusted FineReport assets, then route them for human review as needed.
Avoid common reporting mistakes
Common business reporting issues include:
- too many metrics in one report
- inconsistent KPI definitions across teams
- unclear ownership of follow-up
- outdated or stale data
- reports built for creators instead of decision-makers
- excessive visual clutter
- missing exception thresholds
- distribution without access governance
These problems reduce trust and lower adoption. People stop reading reports when they are hard to interpret or easy to dispute.
Use a simple report-writing structure
A practical structure works well across most business reporting use cases:
-
Purpose
Why the report exists and what decision it supports. -
Evidence
The key data, visuals, and comparisons. -
Implications
What the findings mean for performance, risk, or objectives. -
Next steps
What should happen next, who owns it, and when follow-up is due.
This structure is simple, but it aligns reporting with action. It also maps well to AI-assisted reporting narratives, where Dora can help draft the evidence and implication sections from standardized FineReport outputs.
Roles, tools, and governance behind effective reporting
Business reporting works only when ownership is clear and trust is built into the process.
What executives, analysts, and IT teams each own
Each role contributes something different.
Executives
- define decision priorities
- approve KPI focus
- evaluate business implications
- assign accountability for action
Analysts
- design report logic
- validate trends and comparisons
- translate data into explanation
- prepare narratives and recommendations
IT teams
- manage data connections
- maintain platform reliability
- enforce permissions and security
- support semantic layers, templates, and governance
In the AI era, IT’s role becomes even more strategic. IT moves from manually building every report to optimizing enterprise data connections, semantic layers, data quality, permission governance, report templates, and reusable agent Skills.
Reporting tools and delivery options
Organizations typically use a mix of tools, each with trade-offs.
- Spreadsheets are flexible but hard to govern at scale.
- Static slides and documents are familiar but often manual and slow to update.
- BI dashboards improve visibility and drill-down capability.
- Enterprise reporting platforms provide stronger formatting, distribution, workflow, and access control.
- AI-assisted reporting layers improve consumption, explanation, and follow-up when built on trusted reporting assets.
FineReport fits the enterprise reporting layer well because it supports formatted reports, complex reports, management packs, operational cockpits, data entry workflows, and enterprise reporting automation. Dora then helps organizations move from manual report consumption to AI-assisted query, summary, push, alert, and follow-up.
Governance, security, and trust
Reporting quality is not just a design issue. It is a governance issue.
Key governance areas include:
- data ownership
- KPI definitions
- documentation
- access control
- report version management
- approval workflow
- auditability
- exception rule design
These become even more important with AI. AI should respect the same FineReport access boundaries as human users. If the reporting foundation is weak, AI only makes the confusion faster.
That is why enterprises should think in layers:
- trusted data
- governed reports
- controlled semantic logic
- secure permissions
- AI assistant execution on top
Real-world examples and next steps
Business reporting is used in every industry, but the pattern is similar: leaders need a trusted view of performance, teams need a repeatable process, and action needs to follow.
Common reporting use cases across industries
Common cross-industry examples include:
- Board packs: executive summaries of strategy, finance, operations, and risk
- Sales performance updates: pipeline, conversion, regional targets, and account movement
- Compliance summaries: filing status, control issues, overdue actions, and audit preparation
- Vendor risk reviews: partner exposure, service performance, contract status, and issue escalation
- Manufacturing operations reports: output, downtime, yield, quality defects, and backlog
- Finance management reports: budget variance, profitability, cash, receivables, and forecast movement
In all of these scenarios, Dora is not an AI experiment. It is a landed digital employee for recurring reporting work such as monthly management reports, operation summaries, finance risk reports, quality anomaly alerts, and owner follow-up.
For business users, that means more timely report summaries, chat-based answers, scheduled briefings, and exception pushes without waiting for analysts or searching through reports.
How to evaluate and improve your current reporting approach
A practical reporting improvement review should ask:
- Which reports are actually used for decisions?
- Which ones are duplicated or stale?
- Where do KPI definitions conflict?
- Which reports take too much manual effort to prepare?
- Which exceptions are not triggering timely action?
- Where would scheduled summaries or AI-assisted report consumption save time?
A useful maturity roadmap often looks like this:
- Audit current reports and eliminate low-value duplication.
- Standardize KPI definitions, templates, and ownership.
- Strengthen data quality and report governance.
- Consolidate high-value reporting into trusted FineReport assets.
- Add Dora to automate report consumption, scheduled briefings, exception alerts, and follow-up.
Actionable Best Practices
Here are five practical ways to improve business reporting and make AI adoption land successfully in a real enterprise.
1. Standardize report templates, KPI definitions, and business terms
If finance, operations, and sales define the same metric differently, reporting confidence will erode fast. Establish a common reporting language first.
2. Start with high-value recurring reports
Do not try to automate every report at once. Start with monthly management packs, weekly operations summaries, finance variance reports, or exception-heavy workflows where reporting effort is repetitive and valuable.
3. Build a semantic layer inside the reporting workflow
AI works better when metrics, filters, dimensions, and business rules are governed. FineReport provides the reporting foundation; Dora performs better when that foundation includes clear semantics and report structure.
4. Preserve permission governance for AI outputs
AI summaries, chat answers, and pushed alerts should respect FineReport access boundaries. This is essential for enterprise fit, especially in finance, compliance, HR, and executive reporting.
5. Use human review for AI-generated report narratives and expand Skills gradually
AI-generated summaries should be reviewed early in rollout. Over time, organizations can expand Dora Skills for recurring scenarios such as Daily Briefing Secretary workflows, Report Researcher summaries, and Risk Alert Officer notifications.
FineReport + Dora Solution Pitch
Building this manually is complex. FineReport helps teams standardize trusted reports, operational cockpits, templates, and reporting workflows. Dora turns those assets into an AI assistant that can answer report questions in chat, generate structured summaries, push scheduled briefings, monitor exceptions, and follow up with responsible owners.
That combination matters because many enterprises do not just need better dashboards. They need a practical operating model for how reporting is produced, consumed, and acted on.
FineReport + Dora is not only a reporting upgrade; it is a practical fourth-generation Agentic BI path. FineReport provides governed reports and operational cockpits. Dora provides the AI assistant layer for scenario execution, with more controlled Skills, lower token waste, faster execution paths, and more stable workflows than prompt-only agents.

Get Ready-to-Use Dashboard Templates in Fine Gallery
The strongest Dora pitch is scenario + product + service: FineReport provides the trusted reporting foundation, Dora provides the AI digital employee, and implementation service connects data, governance, semantic setup, Skills, report templates, permissions, and rollout.
If your organization wants business reporting that is more trusted, more scalable, and easier to act on, this is the practical path: build the reporting foundation first, then upgrade report consumption with an enterprise Data Agent.
FAQs
Business reporting is the structured process of turning raw business data into clear information people can use to make decisions and take action. It usually includes defining metrics, validating data, presenting results, and assigning follow-up.
Executives use reports to monitor performance and risk, analysts use them to communicate trends and exceptions, and IT teams support trusted, governed access to data. Together, reporting helps the business align around facts instead of assumptions.
Business reporting focuses on recurring communication of performance in a defined format, while dashboards are mainly for ongoing KPI monitoring. Business intelligence is broader and includes the data integration, modeling, governance, and tools behind reporting.
Common types include operational reports, financial reports, performance reports, compliance updates, and exception summaries. Each supports a different audience, time frame, and decision cycle.
AI can help summarize reports, generate narratives, flag anomalies, and deliver scheduled updates to the right people. With tools like FineReport and Dora, it can make reporting faster to consume while still relying on governed report assets.


The Author
Yida Yin
FanRuan Industry Solutions Expert
Related Articles

ERP Reporting Explained: What It Is, How It Works, and Why Enterprise Teams Rely on It
ERP reporting is the process of turning data inside your enterprise resource planning system into usable business insight. For finance leaders, operations directors, supply chain managers, and IT teams, that matters beca
Yida Yin
Jun 25, 2026
8 Best Restaurant Reporting Software Tools for 2026: Compare FineReport, Toast, SpotOn & More
$1 is a highly customizable business intelligence and reporting platform that helps restaurants turn POS, labor, inventory, finance, and multi location data into real time dashboards and decision ready reports. 8 Best Re
Yida Yin
Jun 24, 2026

Database Reporting Architecture: When to Use a Reporting Database vs Your Operational System
$1 is not just about pulling data into a dashboard. It is an architecture decision that affects application performance, reporting speed, data trust, and how confidently your teams can make decisions. If you are an IT ma
Yida Yin
Jun 24, 2026