Investment reporting is how firms turn portfolio data into trusted information that people can actually use. For asset managers, fund administrators, advisors, family offices, and investors, the goal is not just to show numbers. It is to explain performance, clarify risk, document holdings, and support better decisions.
In practice, investment reporting usually includes operational dashboards, formatted investor reports, performance summaries, exposure views, and review workflows. Increasingly, firms also want an AI assistant upgrade on top of that reporting foundation. With FineReport + Dora, teams can ask for a report summary in chat, generate structured narratives from trusted report assets, receive scheduled briefings, and push exceptions to the right owner.
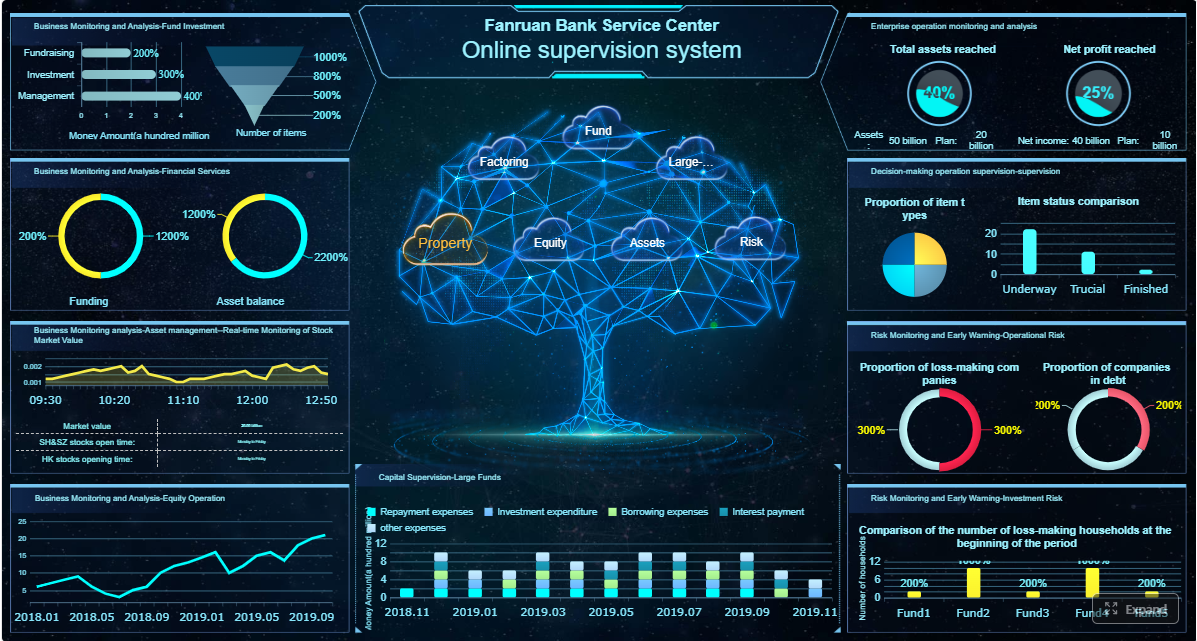 Click To Try The Dashboard
All reports in this article are built with FineReport
What investment reporting is and why it matters
Investment reporting is the process of collecting, calculating, organizing, and presenting investment information so stakeholders can understand how a portfolio or fund is performing, what risks it carries, and what is driving results.
In plain language, it answers questions such as:
- How did the portfolio perform this month, quarter, or year?
- Did it beat or lag its benchmark?
- What risks increased or decreased?
- What holdings and exposures are driving returns?
- What should the internal team or investor pay attention to next?
Different groups use investment reporting for different reasons:
- Asset managers use it to monitor portfolios, explain results, and communicate with clients.
- Fund administrators use it to support reconciled data, valuations, and formal reporting processes.
- Advisors and wealth managers use it to present portfolio updates in a client-friendly format.
- Institutional investors and limited partners use it to review performance, risk, and transparency.
- Internal operations, finance, and compliance teams use it to track timeliness, calculation quality, and distribution workflows.
Good investment reporting matters because it improves four things at once:
- Decision-making: Teams can act faster when performance, risk, and exposure are visible and comparable.
- Transparency: Investors gain confidence when reports are clear, consistent, and explain what changed.
- Compliance support: Standardized reporting reduces the chance of undocumented methods or inconsistent disclosures.
- Stakeholder communication: A well-structured report helps portfolio teams, operations, executives, and investors stay aligned.
It is also important to distinguish between two reporting purposes:
Internal reporting for operations
Internal reporting is built for teams that run the investment process. It often includes:
- reconciliations
- NAV and valuation checks
- portfolio exposures
- exception monitoring
- benchmark comparisons
- workflow status
- pending review items
This reporting tends to be more detailed, more frequent, and more operational.
Investor-facing reporting for clients and limited partners
Investor-facing reporting is built for communication and accountability. It usually emphasizes:
- portfolio summary
- performance over standard periods
- holdings or allocation overview
- risk context
- commentary
- outlook
- disclosures and methodology notes
This reporting must be easier to read, more polished, and more narrative-driven than internal management views.
FineReport is especially useful here because it supports both sides: operational cockpits for internal teams and formatted reports for external distribution. Dora then adds the AI assistant layer so users can consume those reports faster through chat, summaries, alerts, and follow-up.
The core components of investment reporting
The most useful investment reporting combines performance, risk, and holdings into one coherent picture. If any one of these is missing, the reader sees only part of the story.
Performance reporting
Performance reporting shows how an investment, portfolio, strategy, or fund has performed over time. It is usually presented across multiple periods, such as:
- month to date
- quarter to date
- year to date
- one year
- three years
- five years
- since inception
Benchmarks matter because returns mean little without context. A 6% return may look strong in isolation but weak if the strategy benchmark returned 9% over the same period.
Common performance views include:
- Gross returns: Performance before certain fees and expenses.
- Net returns: Performance after fees and expenses that affect investor outcomes.
- Cumulative returns: Total growth over a longer period.
- Benchmark-relative performance: Whether the strategy outperformed or underperformed its benchmark.
- Attribution analysis: What contributed to returns, such as sector allocation, security selection, currency, or duration effects.
Key performance report elements
-
Period return: The portfolio’s gain or loss for a defined time period.
Business value: Provides the core answer investors want first.
AI use: Dora can summarize monthly or quarterly return changes and explain whether performance improved or weakened versus prior periods. -
Benchmark comparison: A side-by-side comparison against a selected index or custom benchmark.
Business value: Helps readers judge whether results were strong for the strategy type.
AI use: Dora can generate a chart-based answer explaining relative outperformance or underperformance. -
Gross vs. net return view: Separate presentation of returns before and after fees.
Business value: Improves transparency and helps investors understand actual realized outcomes.
AI use: Dora can highlight which audience should review gross or net views and include both in a structured report summary. -
Attribution section: Breakdown of what drove results.
Business value: Moves the conversation from “what happened” to “why it happened.”
AI use: Dora can turn attribution tables into plain-English commentary for management or investor reports.
Risk reporting
Risk reporting provides the context needed to interpret returns properly. A high return achieved with excessive concentration, deep drawdowns, or weak liquidity may not be attractive for the intended investor profile.
Typical risk areas include:
- volatility
- maximum drawdown
- concentration by issuer, sector, or geography
- liquidity profile
- leverage, if relevant
- scenario or stress exposure
- duration or credit exposure for fixed income portfolios
- style or factor exposure where applicable
Risk reporting is essential because it answers whether the portfolio’s return came from disciplined positioning or from risks that may not be sustainable.
Key risk report elements
-
Volatility: A measure of how much returns fluctuate over time.
Business value: Helps readers understand how stable or unstable the return path has been.
AI use: Dora can explain rising volatility in plain language and compare current readings with historical ranges. -
Drawdown: The decline from a portfolio peak to a subsequent trough.
Business value: Shows downside experience more directly than average return figures.
AI use: Dora can flag unusual drawdowns and push summaries to risk owners or portfolio reviewers. -
Concentration: Exposure to a small number of holdings, sectors, or counterparties.
Business value: Highlights dependency risk that may not be obvious from top-line returns.
AI use: Dora can detect threshold breaches and include exception alerts in periodic briefings. -
Liquidity exposure: The ease or difficulty of exiting positions without major price impact.
Business value: Helps assess whether the portfolio can meet redemptions or reposition efficiently.
AI use: Dora can summarize liquidity buckets and highlight assets requiring closer review. -
Scenario exposure: Estimated impact under specified market or macro scenarios.
Business value: Helps investment teams and investors prepare for adverse conditions.
AI use: Dora can retrieve scenario tables from FineReport and convert them into a concise management narrative.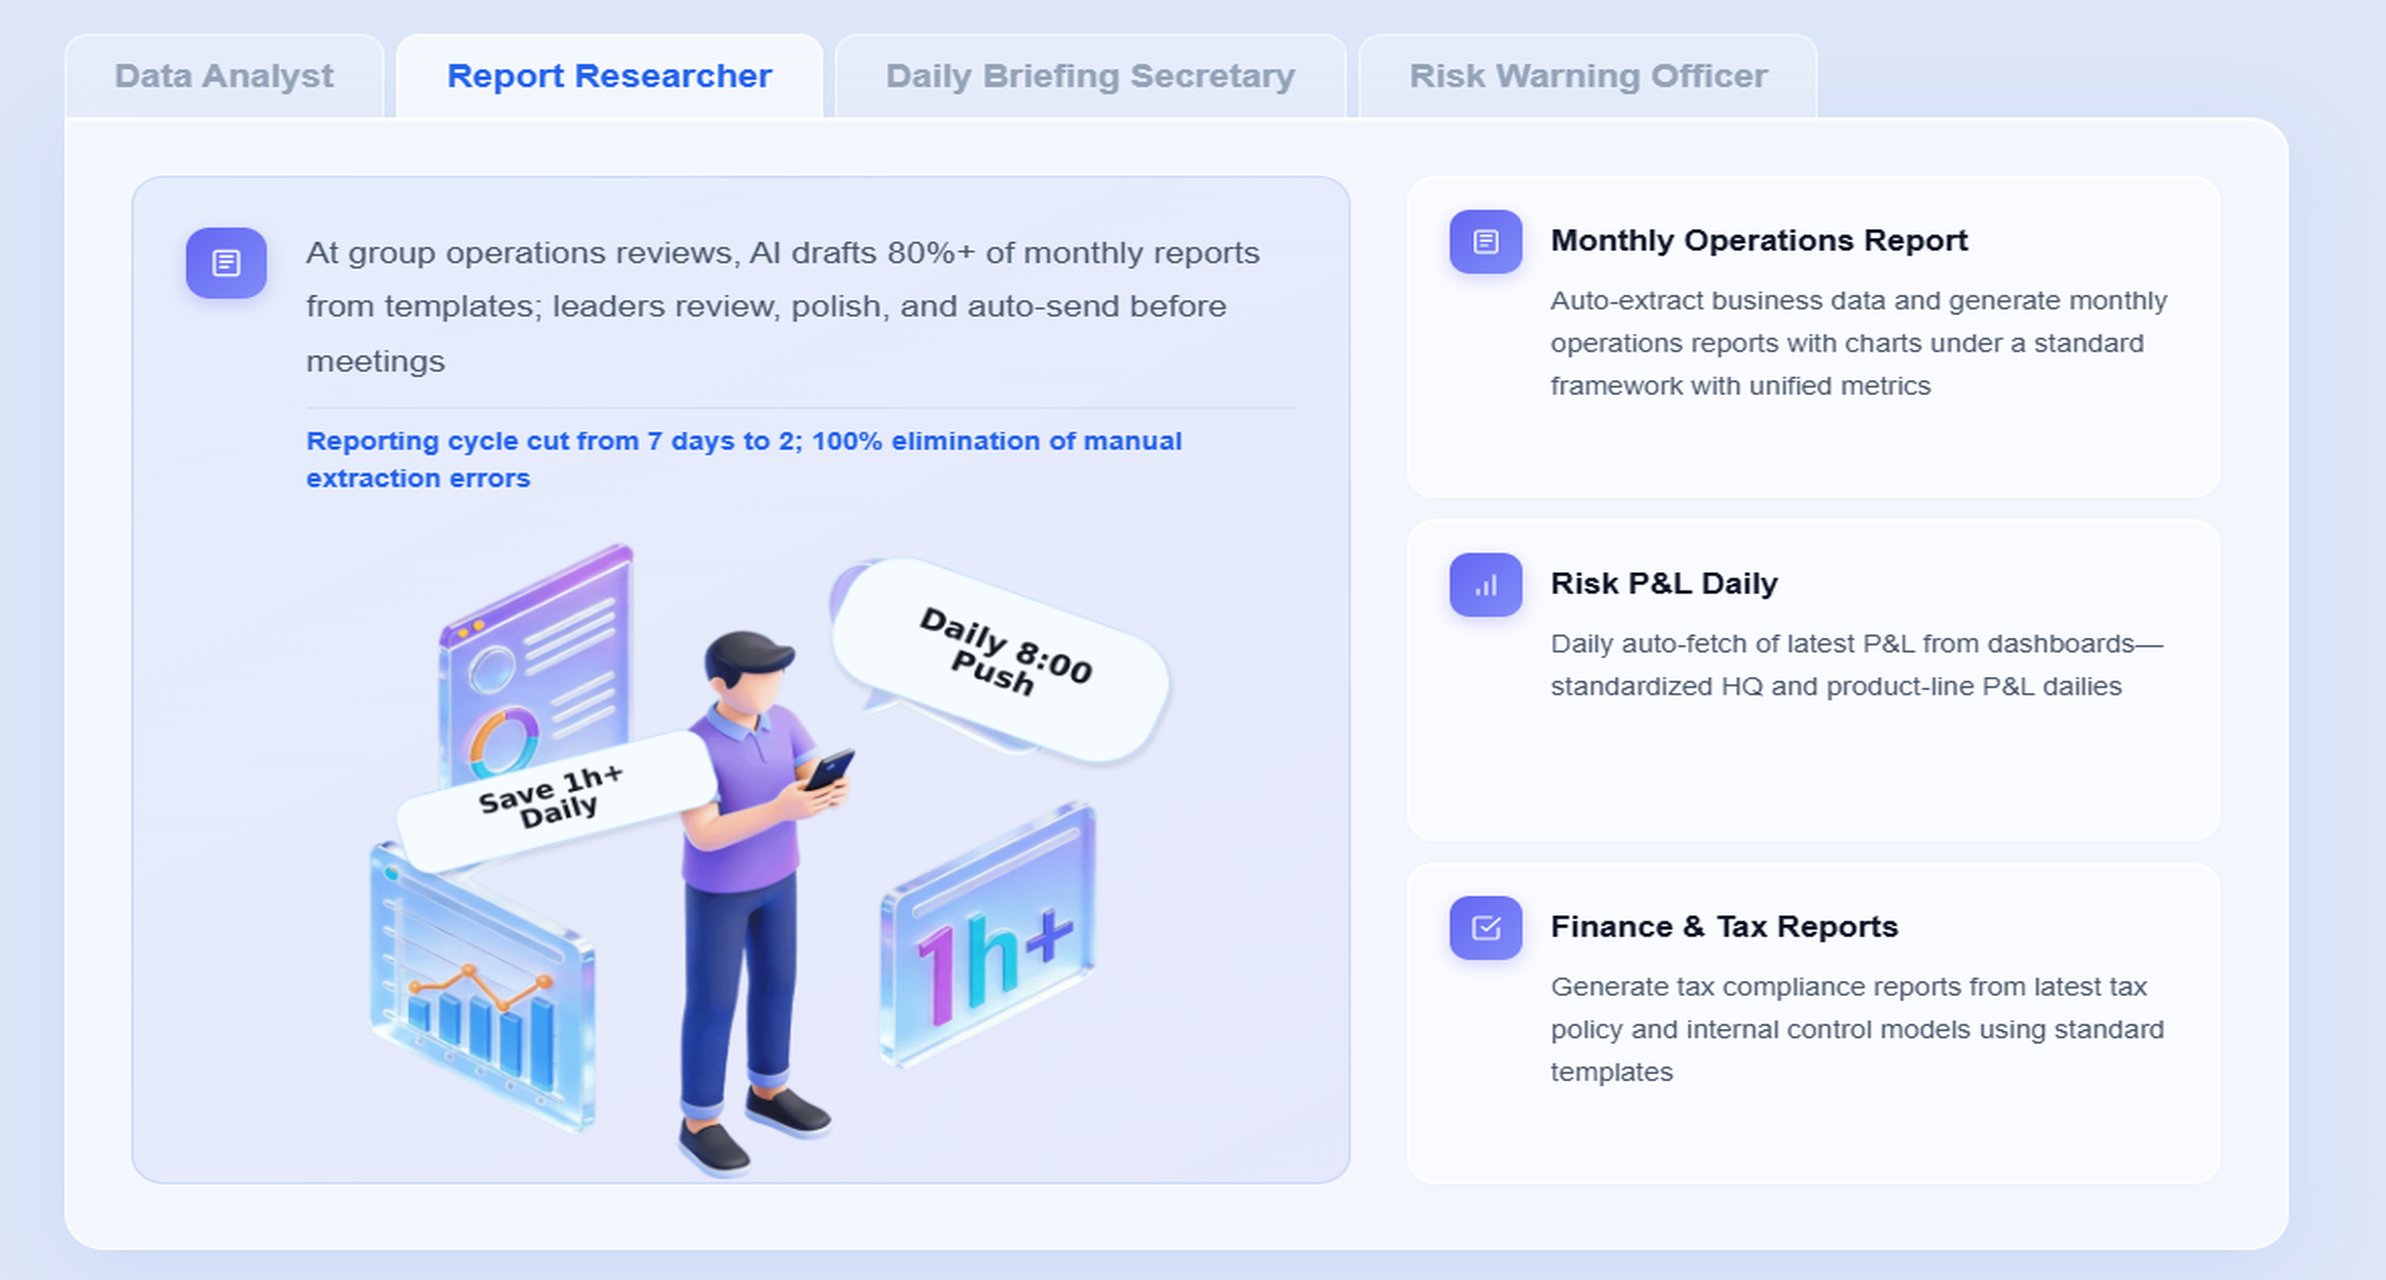
Holdings and exposure reporting
Holdings and exposure reporting shows what the portfolio actually owns and how capital is allocated. This helps the reader connect market behavior and portfolio outcomes.
Typical views include:
- individual holdings
- top positions
- sector allocation
- country or region allocation
- asset class mix
- currency exposure
- maturity or duration distribution
- long/short exposure where relevant
This area is critical because performance often becomes more understandable once the reader sees the underlying exposures.
Key holdings and exposure report elements
-
Holdings list: The securities, instruments, or funds currently held.
Business value: Provides baseline transparency into what drives performance and risk.
AI use: Dora can retrieve top holdings from FineReport and summarize major changes from the prior period. -
Sector allocation: Distribution of assets across industries or sectors.
Business value: Helps explain cyclical performance and concentration patterns.
AI use: Dora can explain why certain sectors contributed positively or negatively. -
Geographic allocation: Exposure by country or region.
Business value: Shows macroeconomic and political exposure that may affect returns.
AI use: Dora can produce region-level highlights for investor updates or IC meeting preparation. -
Asset class mix: Allocation across equities, fixed income, alternatives, cash, and other categories.
Business value: Helps investors assess alignment with mandate and risk profile.
AI use: Dora can compare actual allocation with target policy ranges and surface exceptions. -
Top positions: Largest individual exposures.
Business value: Shows where the portfolio is most dependent on individual names or themes.
AI use: Dora can push alerts when top-position concentration exceeds a governance threshold.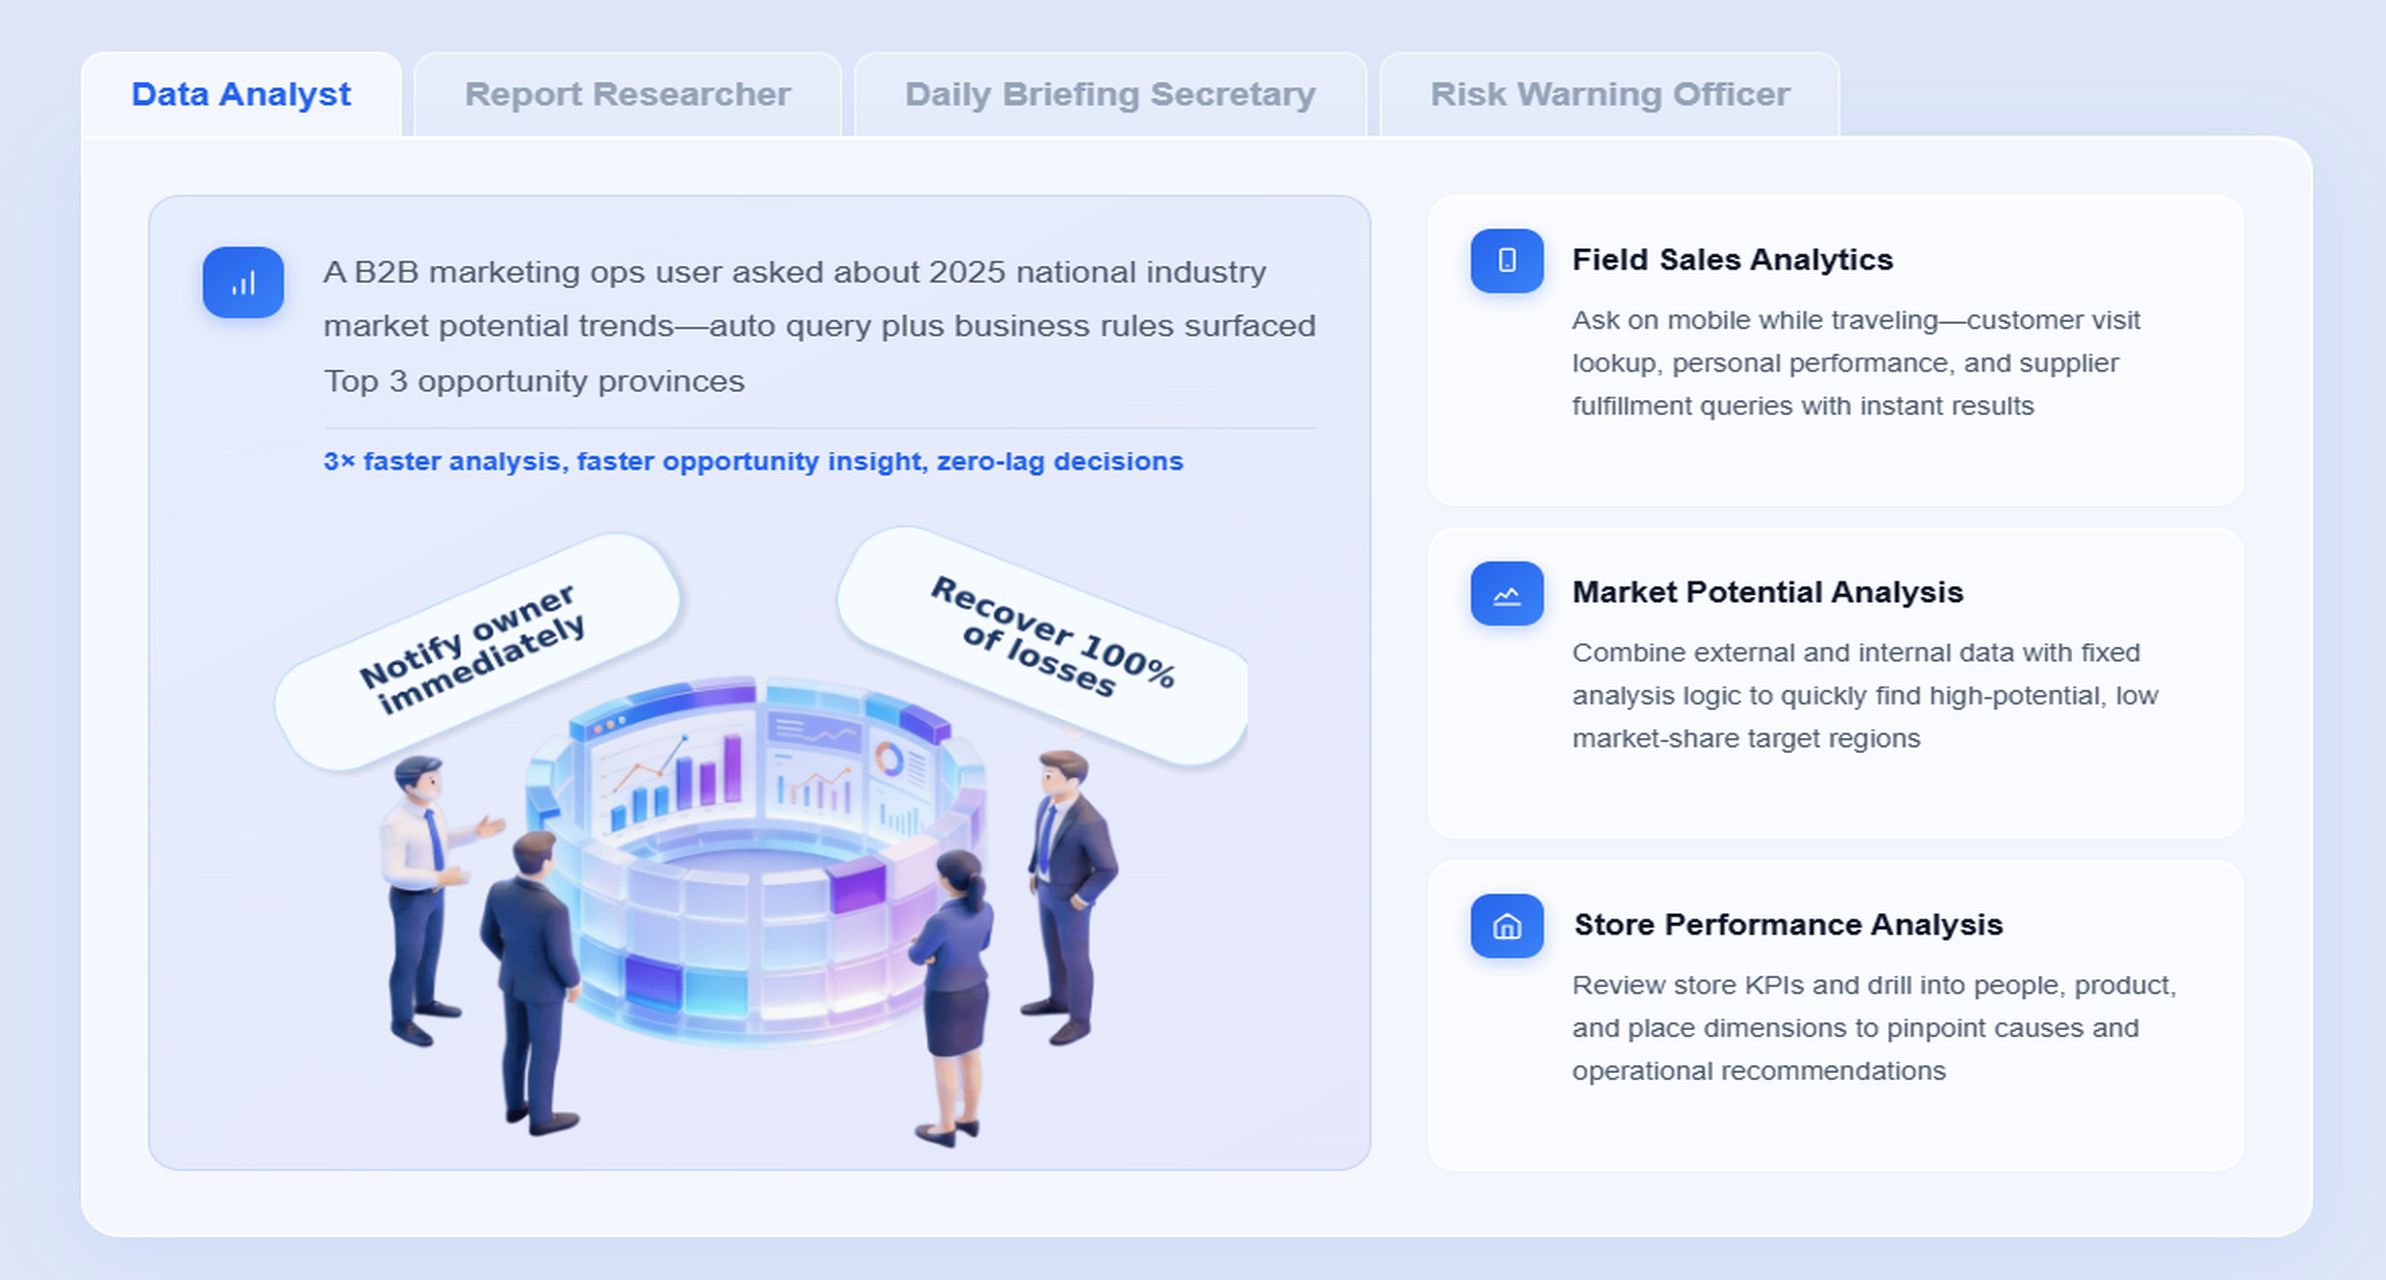
How investor reports are structured and delivered
Investor reports are most effective when they combine data, narrative, and presentation discipline. Raw exports rarely build confidence. Structured reporting does.
Typical sections in investor-facing reports
Most investor-facing reports follow a recognizable structure:
- executive summary
- portfolio snapshot
- performance review
- holdings or allocation overview
- risk metrics
- commentary on drivers and market conditions
- outlook or positioning note
- methodology or disclosure notes where needed
The commentary section is especially important. Investors do not just need charts. They need to understand what changed, why it changed, and whether the result aligns with the stated strategy.
A good report commentary should:
- explain the most important performance drivers
- connect return with benchmark context
- mention material risk changes
- highlight allocation or holding shifts
- avoid jargon where simpler wording works
Reporting frequency and format
Different reporting cycles serve different needs:
- Monthly reports: Best for regular portfolio monitoring, management oversight, and timely investor communication.
- Quarterly reports: Common for more developed commentary, formal client reviews, and board or LP updates.
- Annual reports: Best for full-period review, strategic reflection, audit-linked documentation, and long-term comparison.
Formats also vary by audience and use case:
- Dashboards: Useful for internal teams that need interactive analysis and drill-down.
- PDFs: Useful for formal investor distribution and archived reporting packages.
- Portals: Useful for secure self-service access and historical retrieval.
- Ad hoc reports: Useful when clients or executives ask a specific question outside the standard cycle.
FineReport supports all of these with formatted reports, dashboards, operational cockpits, and enterprise reporting automation. That means firms do not need to choose between presentation quality and workflow control.
Principles for clear and credible reporting
Useful investment reporting is not defined by how many charts it contains. It is defined by trust and usability.
Core principles include:
- Consistency: Similar calculations, layouts, and definitions across periods.
- Accuracy: Validated data and reviewed calculations.
- Timeliness: Reports delivered early enough to support action.
- Comparability: Clear period, benchmark, and methodology alignment.
- Transparency: Enough disclosure to explain what the figures mean and how they were prepared.
Plain-English explanations and well-labeled visuals also matter. If an investor cannot tell what a chart shows or why a number changed, the report is failing its job.
Investment reporting basics: key metrics and methods to understand
Not every reader needs quantitative depth, but every report should make key metrics interpretable.
Common metrics readers should know
Here are some of the most common investment reporting metrics:
Return
Return shows the gain or loss over a period. It is the starting point for almost every report.
- Best for: all audiences
- Use carefully when: fees, cash flows, or valuation timing may affect interpretation
Benchmark-relative performance
This compares the portfolio with a selected benchmark.
- Best for: institutional clients, advisors, executives, portfolio reviewers
- Most useful when: benchmark selection is appropriate and clearly documented
Sharpe ratio
A high-level measure of risk-adjusted return, looking at return relative to volatility.
- Best for: diversified portfolios and strategy comparison
- Less useful when: return distributions are unusual or very short periods are used
Alpha
Alpha refers to excess return beyond what would be expected from benchmark or market exposure.
- Best for: active management evaluation
- Most useful when: paired with a clear model or benchmark framework
Beta
Beta indicates sensitivity to market movements.
- Best for: equity strategies and market-linked portfolios
- Less useful when: portfolios are highly unconstrained or illiquid
Tracking error
Tracking error measures how closely a portfolio follows its benchmark.
- Best for: benchmark-aware strategies
- Especially relevant for: enhanced index, core active, or mandate-controlled portfolios
Drawdown
Drawdown shows peak-to-trough decline.
- Best for: nearly all investor audiences
- Especially useful when: explaining downside experience and recovery profile
Different audiences care about different combinations:
- Executives and investors often prioritize return, benchmark-relative performance, drawdown, and top exposures.
- Portfolio and risk teams need deeper views into volatility, concentration, liquidity, and attribution.
- Client-facing advisors need metrics that can be explained clearly without losing accuracy.
Data quality and calculation methods
Trust in investment reporting depends on more than design. It depends on method.
Reported results can change meaningfully based on:
- source data quality
- reconciliation completeness
- valuation timing
- treatment of fees and expenses
- handling of corporate actions
- benchmark mapping
- methodology assumptions
- period cut-off rules
For example, a return figure may look straightforward, but confidence in that number requires clarity on:
- whether it is gross or net
- whether valuations were final or estimated
- whether external administrator data was reconciled
- whether cash flows were treated consistently
- whether benchmark data used the correct time frame
This is why standards, review workflows, and documented methodology matter so much. They reduce reporting errors and help prevent debates over numbers after reports have already been distributed.
FineReport helps teams operationalize this governance through controlled templates, permissions, workflow-based reporting, and standardized report structures. Dora builds on that foundation, so AI answers are grounded in governed reporting assets rather than disconnected prompts.

Tools, software, and workflow for modern investment reporting
Modern investment reporting is no longer just a spreadsheet exercise. It is a workflow that combines data aggregation, calculation, review, narrative creation, approval, and delivery.
Investment reporting and fund management software
Software helps investment reporting teams handle complexity at scale. Common capabilities include:
- data aggregation from custodians, accounting systems, PMS platforms, and market data sources
- reconciliation support
- calculation and transformation logic
- charting and visualization
- report formatting
- approval workflows
- permissions and auditability
- scheduled distribution
- investor portal delivery
When evaluating reporting tools, teams should look for:
- Audit trails: Who changed what, when, and why
- Customization: Ability to match investor, fund, or strategy-specific requirements
- Permissions: Controlled access by user, team, client, or asset set
- Integrations: Connectivity to source systems and external data flows
- Template governance: Standardized report structures that reduce inconsistency
- Distribution control: Reliable scheduling and publication workflows
For enterprises that need both operational reporting and investor-facing formatted output, FineReport serves as the reporting foundation. It supports complex formatted reports, management reports, workflows, and operational cockpits. Dora then adds a governed AI workflow layer for report consumption and follow-up.
Building an efficient reporting process
A practical reporting workflow usually looks like this:
- Collect data from source systems.
- Validate and reconcile positions, valuations, and reference data.
- Calculate performance, risk, and exposure metrics.
- Populate standardized report templates and dashboards.
- Draft commentary and management narrative.
- Route for review and approval.
- Publish to internal users, clients, or portals.
- Handle follow-up questions and exceptions.
The challenge is that many firms still do steps 4 through 8 manually. That creates bottlenecks in commentary writing, report retrieval, version control, and stakeholder communication.
A stronger operating model is to let FineReport standardize the report assets and let Dora assist with recurring consumption tasks such as:
- answering report questions in chat
- generating structured report summaries
- preparing briefing notes for meetings
- pushing overdue or abnormal items to owners
- creating scheduled daily, weekly, or monthly summaries
That shift matters because enterprise AI adoption succeeds more often when it is attached to a defined reporting scenario rather than positioned as a generic assistant.
How an AI Data Agent Automates Report Consumption
Investment reporting does not end when the report is published. In many firms, the real friction begins after publication:
- executives ask for a faster summary
- client teams ask what changed versus last month
- risk teams want concentrated exposures flagged
- operations teams need follow-up on missing or delayed inputs
- investors want plain-English explanations, not just tables
This is where Dora works as an enterprise Data Agent on top of trusted reporting assets.
The most relevant Dora digital employees for investment reporting are:
- Report Researcher for structured report generation from FineReport outputs, templates, charts, and business definitions
- Daily Briefing Secretary for scheduled summaries and recurring report push
- Data Analyst digital employee for natural-language report queries and metric explanation
- Risk Alert Officer for monitoring abnormal concentration, drawdown, or threshold breaches
A chat-style investment reporting example
A portfolio operations director or investor relations manager might ask:
“Summarize this month’s investment reporting package, compare net return with the benchmark, highlight any drawdown or concentration concerns, and list the top holdings that changed materially from last month.”
That is not a request for raw data extraction alone. It is a request for governed interpretation.
A 6-step Dora workflow for investment reporting
-
Retrieve the trusted FineReport report or operational cockpit
Dora accesses the approved investment reporting package, dashboard, or holdings/risk cockpit built in FineReport. -
Apply KPI definitions, templates, and semantic rules
Dora understands approved meanings for return, benchmark, net vs. gross, drawdown, concentration, and reporting periods based on the governed reporting layer. -
Generate a structured report summary in chat
Dora produces a concise narrative covering performance, key holdings shifts, risk context, and benchmark-relative results. -
Detect exceptions and abnormal changes
If drawdown, concentration, stale data, or exposure thresholds breach defined rules, Dora highlights those items for review. -
Push summaries and alerts to the right users
Dora can send scheduled briefings to executives, investor relations teams, or risk owners and route specific exceptions to responsible users. -
Create follow-up records and recurring briefings
Dora supports periodic summaries for investment committee preparation, investor communication reviews, or monthly operations follow-up.
The Dora digital employee in this scenario
For most investment reporting teams, the best fit is a combination of:
- Report Researcher to turn FineReport report outputs into structured management or investor-ready summaries
- Daily Briefing Secretary to schedule regular portfolio reporting briefings
- Risk Alert Officer to surface drawdown, concentration, or stale-data exceptions
- Data Analyst digital employee to answer ad hoc portfolio report questions in natural language
Why FineReport is the trusted foundation
Dora works best when it is not guessing. FineReport provides the foundation Dora needs:
- governed report templates
- consistent KPI definitions
- permissions and user-level access boundaries
- operational cockpit views
- formatted investor reporting layouts
- workflow integration for reviews and publication
That foundation matters because investment reporting is sensitive to methodology, disclosure, and audience-specific presentation. AI should consume trusted reporting assets, not bypass them.

How Dora improves execution after the report is built
Dora improves investment reporting execution in ways that manual workflows struggle to match consistently:
- Chat-based access: Users ask for the meaning of a performance change instead of searching through multiple tabs or PDFs.
- Structured summaries: Dora converts tables and charts into management-ready or investor-friendly narratives.
- Scheduled briefings: Executives and client teams receive recurring monthly or weekly summaries automatically.
- Exception pushes: Concentration, liquidity, or drawdown alerts can be routed to owners faster.
- Follow-up support: Dora can help log issues, prepare the next review cycle, and keep recurring reporting work moving.
This is why Dora should be positioned as fourth-generation Agentic BI rather than a generic chatbot. It combines natural-language request, trusted semantic understanding, governed Skill execution, and scenario-based action on top of enterprise report assets.
Common challenges and best practices
Investment reporting often breaks down not because firms lack data, but because they lack consistency, context, and scalable workflow discipline.
Frequent reporting mistakes to avoid
Inconsistent methodology
When period treatment, benchmark logic, or fee treatment changes without clear disclosure, users lose trust quickly.
Missing benchmark context
A performance number without a benchmark or mandate context leaves readers guessing whether the result is actually good or bad.
Outdated or unreconciled data
Even visually strong reports fail if holdings, valuations, or exposures are stale.
Cluttered visuals
Too many tables, unclear legends, or poorly labeled charts make reports harder to interpret.
Unclear commentary
If commentary repeats data without explaining what matters, readers still need follow-up meetings to understand the report.
These mistakes confuse readers, slow decisions, and weaken investor confidence.
Best practices for more useful reports
1. Tailor reports to the audience
Executives, portfolio managers, operations teams, and external investors do not need the same level of detail. Build distinct report views and templates for each use case.
2. Standardize templates, KPI definitions, and business terms
This is both a reporting best practice and an AI readiness requirement. Dora performs better when return definitions, benchmark mapping, exception thresholds, and commentary structure are consistent.
3. Build a semantic layer inside the reporting workflow
Do not rely on informal tribal knowledge to interpret metrics. Document approved meanings and embed them in governed reporting assets so Dora can produce more controllable and auditable outputs.
4. Treat data quality as part of the AI implementation
AI will not fix unreliable source data. Reconciliation, valuation control, and methodology review remain essential if you want trusted AI-assisted reporting.
5. Start with high-value recurring reports
Do not try to automate every investment report at once. Start with recurring monthly performance packs, quarterly investor reports, risk summaries, or IC briefing materials where the business value is clear.
6. Define alert thresholds and responsibility rules
If Dora is used for concentration, drawdown, or stale-data monitoring, exception rules and ownership must be explicit.
7. Preserve permission governance
AI outputs should respect FineReport access boundaries. Sensitive fund, client, or strategy information should only be visible to approved users.
8. Keep human review in the loop
Use Dora to accelerate report consumption and draft structured summaries, then expand Skills gradually as trust, governance, and workflows mature.
Simple investment reporting checklist
Use this checklist to evaluate any investment report:
- Is the reporting period clearly defined?
- Are gross and net returns labeled correctly?
- Is benchmark context included?
- Are risk metrics shown alongside performance?
- Are holdings and exposures easy to interpret?
- Is the data timely and reconciled?
- Are charts clearly labeled?
- Does the commentary explain the main drivers and implications?
- Are methodology assumptions documented where needed?
- Is there a controlled workflow for review and release?
FineReport + Dora for modern investment reporting
Building modern investment reporting manually is complex. Teams need formatted reports for investors, dashboards for internal monitoring, controlled workflows for review, consistent KPI definitions, permission governance, and timely distribution. On top of that, they now need an AI assistant layer that can help users consume reports faster without weakening control.
FineReport helps teams standardize trusted reports, operational cockpits, templates, and reporting workflows. Dora turns those assets into an AI assistant that can answer report questions in chat, generate structured summaries, push scheduled briefings, monitor exceptions, and follow up with responsible owners.
For investment reporting teams, that means a practical path from static reporting toward scenario-based Agentic BI:
- FineReport builds the trusted reporting foundation.
- Dora turns that foundation into a scenario-specific AI assistant or AI digital employee.
- IT and data teams focus on data connections, semantic rules, quality, permissions, templates, and reusable Skills.
- Business users get faster access to report answers, commentary, alerts, and follow-up support.
For executives, the value is concrete: Dora is not an AI experiment. It is a landed digital employee for recurring reporting work such as monthly portfolio reports, management summaries, investor reporting packages, exposure monitoring, and owner follow-up.
For IT teams, the role shifts from manually answering every reporting request to governing enterprise data, report semantics, permissions, templates, and agent Skills that can scale.
For business users, the benefit is lower friction. They can receive timely report summaries, chat-based answers, scheduled briefings, and exception pushes without waiting for analysts to re-explain the same report every cycle.
FineReport + Dora is not only a reporting upgrade; it is a practical fourth-generation Agentic BI path. FineReport provides governed reports and operational cockpits. Dora provides the AI assistant layer for scenario execution, with more controlled Skills, lower token waste, faster execution paths, and more stable workflows than prompt-only agents.

Get Ready-to-Use Dashboard Templates in Fine Gallery
The strongest Dora pitch is scenario + product + service: FineReport provides the trusted reporting foundation, Dora provides the AI digital employee, and implementation service connects data, governance, semantic setup, Skills, report templates, permissions, and rollout.
FAQs
Investment reporting is the process of turning portfolio and fund data into clear information about performance, risk, holdings, and key changes. It helps internal teams and investors understand results and make better decisions.
A strong investment report usually includes performance over standard time periods, benchmark comparisons, holdings or allocation views, risk measures, and short commentary. The best reports add context so readers know what changed and why it matters.
Investor reporting is designed for clients and limited partners, so it is more polished, concise, and narrative-driven. Internal reporting is usually more detailed and operational, with reconciliations, exceptions, workflow status, and review items.
Benchmarks give returns the context they need because a gain or loss means little on its own. They show whether a portfolio outperformed or underperformed a relevant market index or strategy target.
FineReport helps teams build dashboards and formatted reports for both internal operations and external investors. Dora adds AI-powered summaries, chat-based answers, alerts, and scheduled briefings so users can understand reports faster.


The Author
Yida Yin
FanRuan Industry Solutions Expert
Related Articles
Automation of Financial Reporting for Month-End Close: A Practical Guide for Finance Managers
Month end close is where finance discipline meets operational pressure. Finance managers need accurate reports, timely reconciliations, management visibility, and enough control to stand behind the numbers. But in many o
Yida Yin
Jun 28, 2026

12 Best Client Reporting Software Tools for Agencies in 2026: Features, Pricing & Use Cases Compared
Client $1 is a platform that helps agencies aggregate marketing data, automate reports, and deliver client ready dashboards that clearly show performance and ROI. 12 best client reporting software tools for agencies in 2
Yida Yin
Jun 24, 2026

TCFD Reporting Explained: What It Is, Why It Matters, and a Simple Scenario Analysis Example
TCFD reporting helps companies explain how climate related risks and opportunities could affect business performance, strategy, and long term value. For CFOs, sustainability leaders, risk managers, and board members, the
Yida Yin
Jun 24, 2026