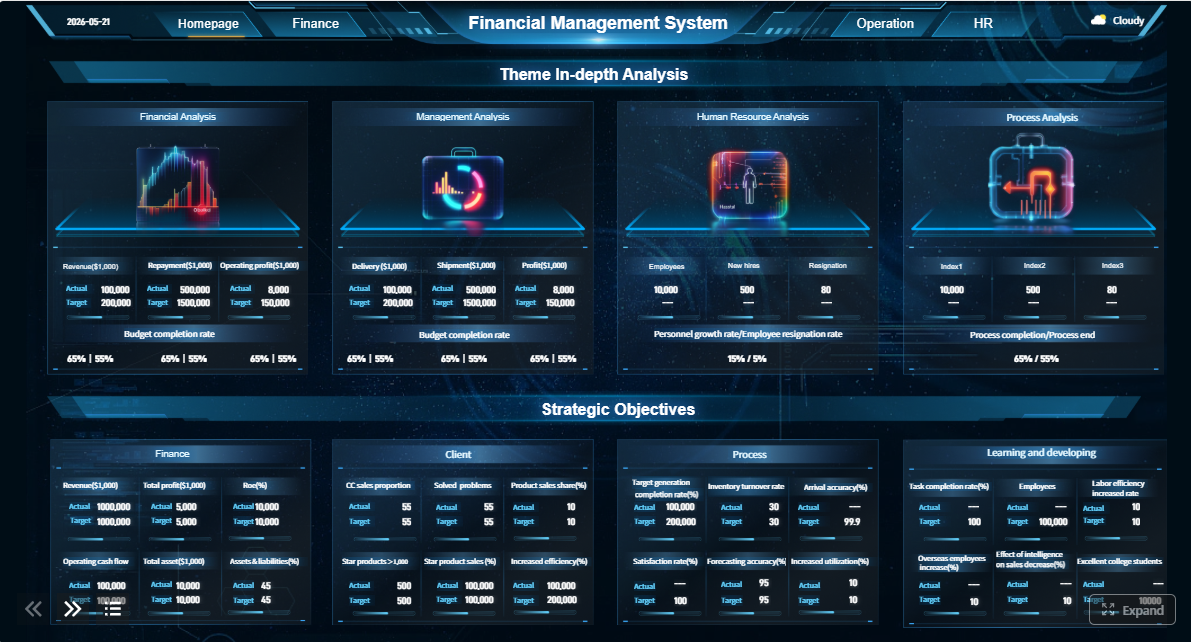
A strong finance report template should help leadership understand performance, risk, and next steps in minutes, not after digging through separate spreadsheets, slide decks, and email commentary. In practice, that means combining a monthly KPI dashboard, variance analysis, and executive commentary into one repeatable reporting structure.
For finance leaders, controllers, FP&A teams, and operations executives, the challenge is not just building a report. It is creating a reporting system that is accurate, reusable, and decision-ready every month. With FineReport + Dora, teams can ask for a report summary in chat, generate structured narratives from trusted report assets, receive scheduled briefings, and push exceptions to the right owner.
Click To Try The Dashboard
All reports in this article are built with FineReport
What a Great Finance Report Template Should Include
A useful finance report template is more than a formatted spreadsheet. It is a management reporting framework that allows finance teams to present the same core financial story consistently across periods, entities, and leadership audiences.
A clear monthly management review structure that brings KPI tracking, variance analysis, and executive commentary into one report
The best monthly finance report follows a predictable flow:
This structure matters because executives rarely want raw financial detail first. They want the headline view, the biggest changes, the business meaning, and the action plan. A well-designed finance report template makes that sequence natural.
With FineReport, finance teams can standardize this structure as a governed monthly management report. With Dora, the same report becomes easier to consume because users can ask for a structured report summary, chart explanation, or period-over-period narrative through chat.
A layout that helps finance teams present performance quickly to leadership without duplicating data across multiple files
Many finance teams still split reporting across Excel working files, PowerPoint packs, Word commentary, and manually maintained summary sheets. That creates version-control issues and delays.
A better finance report template uses one reporting layout with:
a top-level summary page
linked KPI views
defined commentary sections
drill-back detail for exceptions
a consistent version for each reporting cycle
Business value: Less duplication means fewer manual errors and faster close-to-report timelines. AI use:Dora can retrieve the trusted report section, explain the relevant chart or metric movement, and produce a concise management narrative without users hunting through multiple files.
Sections that balance summary-level insights with enough supporting detail for decision-making
A finance report should not overwhelm leadership with every line item. At the same time, it cannot be so high-level that questions require a second reporting cycle.
A practical template balances both needs:
Summary layer: revenue, margin, EBITDA or operating result, cash, opex, working capital
Support layer: department, entity, product, or region detail where needed
Report Element: Summary KPI panel Definition: A compact view of the most important financial indicators. Business value: Allows leaders to assess performance quickly. AI use:Dora can summarize this panel, explain exceptions, and include it in a scheduled management briefing.
Report Element: Supporting variance schedules Definition: Detail pages that explain major movement behind summary KPIs. Business value: Improves confidence in decisions and follow-up. AI use:Dora can surface only the material schedules relevant to a specific question.
A format that works for recurring reporting cycles and can be adapted across business units
A great finance report template must be reusable. Monthly reporting breaks down when every unit edits the structure differently or uses different KPI definitions.
A repeatable template should support:
month-end and year-to-date views
entity or department filters
standard definitions for each metric
common commentary prompts
ownership and sign-off rules
Business value: Standardization improves comparability across time and business units. AI use:Dora performs better when the enterprise has governed KPI definitions, report templates, and semantic rules. This is why FineReport is the reporting foundation and Dora is the AI assistant layer on top.
A monthly finance report template should begin with a KPI dashboard that gives executives one-page visibility into financial health, operating discipline, and growth trajectory.
Revenue, margin, cash, and operating expense metrics
Leadership does not need fifty metrics every month. It needs the handful that explain whether the business is growing, profitable, liquid, and under control.
A useful way to structure them is by management purpose.
Financial health metrics
Revenue: Top-line performance for the period. Business value: Indicates demand and scale. AI use:Dora can summarize revenue movement by month, business unit, or product line and explain differences versus budget or prior period.
Gross margin: Revenue minus direct cost, shown in value and percentage. Business value: Reveals pricing strength and cost control. AI use:Dora can explain whether margin change is driven by price, mix, or cost.
Cash balance / operating cash flow: Liquidity position and cash generation from operations. Business value: Critical for funding operations and investment decisions. AI use:Dora can highlight cash risk, summarize collection pressure, and include cash commentary in a daily or weekly executive briefing.
Operational efficiency metrics
Operating expense: Overhead and controllable spending. Business value: Helps leadership see whether growth is efficient. AI use:Dora can identify overspending categories and flag thresholds requiring finance review.
Working capital metrics: AR days, AP days, inventory days. Business value: Shows whether cash is tied up operationally. AI use:Dora can detect deteriorating trends and push exception alerts to the responsible owner.
Growth metrics
Year-to-date revenue growth
Budget attainment
Contribution by segment or unit
Business value: Helps management distinguish short-term fluctuation from strategic momentum. AI use:Dora can produce chart-based answers such as, “Which segment contributed most to the YTD revenue gap?”
Actual vs budget vs prior period comparisons
A monthly finance report template becomes much more useful when it places multiple comparisons in one view rather than forcing users into separate tabs or files.
The core structure should show:
Current month actual
Current month budget
Variance to budget
Prior month or same month prior year
Variance to prior period
Year-to-date actual
Year-to-date budget
Year-to-date variance
This design answers three management questions at once:
Are we on plan?
Are we improving or deteriorating?
Is the issue isolated or cumulative?
Use visual cues to make interpretation faster:
red/amber/green status markers
arrows for directional change
conditional formatting for threshold breaches
icons for overdue explanations or unresolved issues
Report Element: Actual vs budget comparison Definition: Comparison of reported result to approved target. Business value: Supports financial control and forecast review. AI use:Dora can summarize the largest adverse variances and explain which ones are material enough for executive attention.
Report Element: Prior period comparison Definition: Comparison to last month, quarter, or same period last year. Business value: Reveals trend direction and seasonality. AI use:Dora can explain whether movement appears structural, seasonal, or one-off based on governed report logic.
Ownership, update cadence, and data sources
Even the best finance report template fails when nobody knows who owns a metric, when it refreshes, or which source system produced it.
For each KPI, define:
metric owner
calculation logic
source system
refresh timing
approval owner
exception threshold
This is where enterprise reporting discipline matters. FineReport helps teams formalize the trusted reporting layer, including data connections, formatted reports, management reporting templates, and operational cockpits. Dora benefits from that governance because it can query trusted metrics instead of guessing from unstructured files.
A simple KPI governance table might look like this in your design process:
Metric: Revenue Owner: FP&A manager Source: ERP / billing system Update cadence: Monthly after close AI use:Dora can retrieve the latest approved value and explain variance within permission boundaries.
Metric: Cash balance Owner: Treasury lead Source: Bank + ERP cash module Update cadence: Daily or periodic AI use:Dora can include it in scheduled executive briefings and risk alerts.
Variance analysis is the part of a finance report template that turns numbers into accountability. If the KPI dashboard shows what changed, variance analysis explains why it changed and what should happen next.
Separate volume, price, mix, timing, and one-off effects
Large variances become more useful when they are decomposed into understandable business drivers.
Common variance categories include:
Volume: More or fewer units, customers, or transactions
Price: Selling price or cost rate changes
Mix: Product, customer, or channel composition shifts
Timing: Revenue or cost recognized earlier or later than planned
One-off items: Non-recurring impacts such as settlements, write-offs, or project delays
This structure helps leadership avoid superficial conclusions. For example, lower margin may not be caused by poor cost control alone. It may be a mix issue or a temporary promotional choice.
Report Element: Variance driver bridge Definition: Breakdown of total variance into practical cause categories. Business value: Improves clarity and supports better action planning. AI use:Dora can summarize driver explanations, compare them with prior months, and create a structured narrative for leadership review.
Use thresholds to surface material issues
Not every variance deserves executive commentary. A strong finance report template sets rules for what needs explanation.
Examples of practical thresholds:
variance exceeds a percentage threshold
variance exceeds a value threshold
KPI misses target for two consecutive periods
margin declines beyond a set basis-point range
cash or working capital metric breaches risk limit
Thresholds do two things:
Keep the report focused on decision-relevant items
Make reporting more consistent across teams
FineReport can operationalize these threshold rules inside reports and cockpits. Dora can then use those governed definitions to identify the exceptions worth summarizing, pushing, or following up.
Business value: Leadership focuses on material issues instead of noise. AI use:Dora’s Risk Alert Officerdigital employee can monitor threshold breaches, summarize the issue, and notify the responsible owner with suggested next steps.
Link each variance to next steps
A finance report should not end at observation. It should support action.
For every major variance, include:
issue description
likely driver
responsible owner
corrective action
expected timeline
forecast implication
This is especially important in monthly management review because finance is often coordinating cross-functional follow-up, not just publishing numbers.
A strong action-oriented variance note might answer:
What changed?
Why did it change?
Is it temporary or structural?
What are we doing next?
When will leadership see improvement or update?
Report Element: Action tracker Definition: A table linking major variances to owner and remediation plan. Business value: Creates accountability and avoids “report and forget.” AI use:Dora can push the action item to the owner, generate follow-up reminders, and summarize open issues for the next review cycle.
Writing Executive Commentary for Faster Decision-Making
Executive commentary is what makes a finance report template management-ready. Without it, the report is a data pack. With it, the report becomes a decision document.
Summarize the story behind the numbers
The best commentary starts with the biggest wins, risks, and surprises of the reporting period.
A good opening summary often covers:
overall performance versus budget
the main positive contributor
the main negative driver
cash or liquidity implication
whether the forecast view changes
For non-finance stakeholders, commentary should translate technical movement into business meaning. Instead of writing, “gross margin down 180 bps,” explain what caused the margin compression and what it means for pricing, cost management, or product mix.
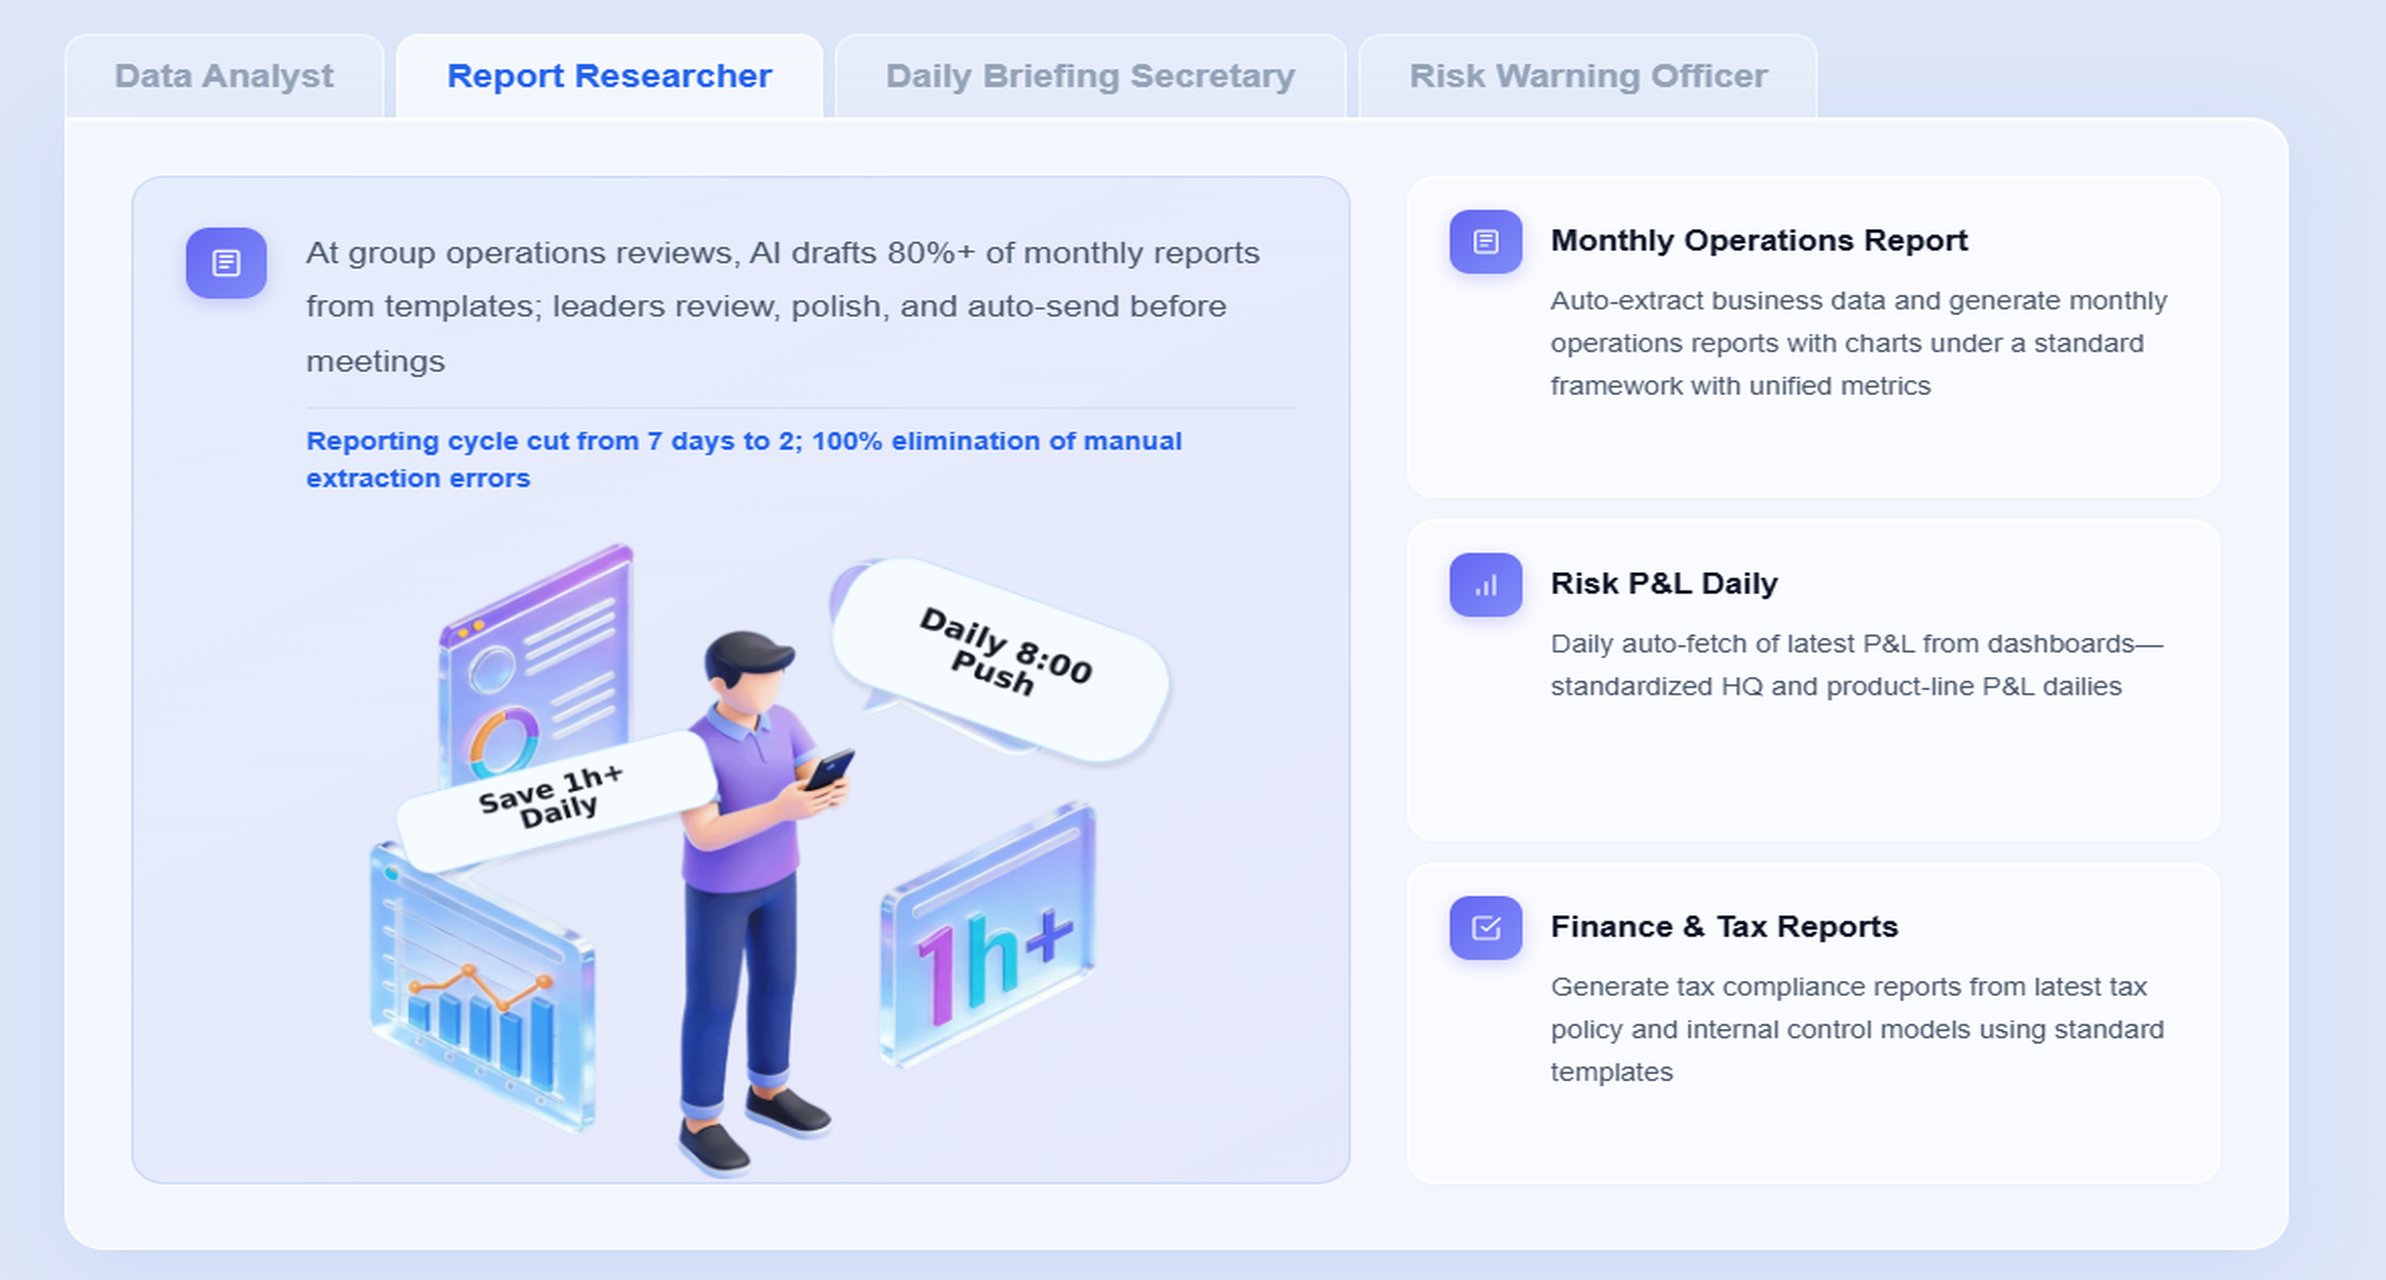
Business value: Leaders can absorb the business message quickly. AI use:Dora’s Report Researcher can generate a structured report summary from approved FineReport charts, KPIs, and templates, making first-draft commentary faster and more consistent.
Keep commentary concise, evidence-based, and forward-looking
A common reporting problem is commentary that merely repeats the numbers. Effective commentary should explain implication, not restate the table.
Stronger commentary usually includes:
what changed
why it changed
whether it will continue
what it means for forecast, cash flow, hiring, pricing, or investment
This distinction matters because executives make different decisions depending on whether the issue is short-term or strategic.
AI use:Dora can compare period commentary patterns, detect whether a variance has persisted across multiple reporting cycles, and generate a concise management narrative grounded in trusted report assets.
Align tone and detail with the audience
Not every reader needs the same level of detail. A CFO, CEO, department head, and board member all consume finance reports differently.
A flexible finance report template should allow commentary views such as:
Department version: KPI ownership, spending detail, operational actions
Board version: trend, material risk, cash, forecast implication, strategic matters
Consistency is also important. Using similar wording and ordering each month improves readability and makes exceptions stand out.
Business value: Readers get the right level of information without added friction. AI use:Dora can tailor the same trusted report summary into audience-appropriate narratives while still respecting governed KPI definitions and permissions.
Choosing the Right Format: Excel, Word, Printable, or Presentation-Ready
The best format for a finance report template depends on how the report is built, reviewed, approved, and consumed. In many enterprises, the answer is not one format but one governed reporting foundation with multiple delivery formats.
When Excel is best for finance reporting
Excel remains highly effective when finance teams need:
formulas and schedule logic
scenario modeling
variance calculation detail
flexible working analysis
analyst-level adjustments during close or forecast cycles
Excel is often the right working layer for:
budget models
variance bridges
supporting schedules
draft commentary inputs
However, Excel alone becomes limiting when many users need the same approved report in a controlled, repeatable format.
Business value: Strong for calculation and analyst flexibility. AI use:Dora adds more value once trusted outputs are standardized in FineReport, because AI can then retrieve governed report sections rather than many disconnected spreadsheets.
When Word or printable layouts make sense
Document-style reporting works best when the report is narrative-heavy, approval-focused, or distributed as a formal monthly packet.
Use printable or document-style layouts when you need:
The key is to keep printable versions simple and readable. Avoid overloading them with raw detail that belongs in drill-down schedules or cockpit views.
FineReport is especially useful here because it supports formatted enterprise reports that look polished and consistent across recurring cycles.
When branded or design-led templates add value
Visual polish helps when finance reports are shared with:
external stakeholders
broad management audiences
regional leadership teams
investor or board-style communication settings
But design should never reduce financial clarity. If the report becomes visually attractive but harder to interpret, the template is failing.
The ideal approach is a reporting structure that keeps financial rigor intact while presenting the output in dashboard, printable, or presentation-ready forms as needed.
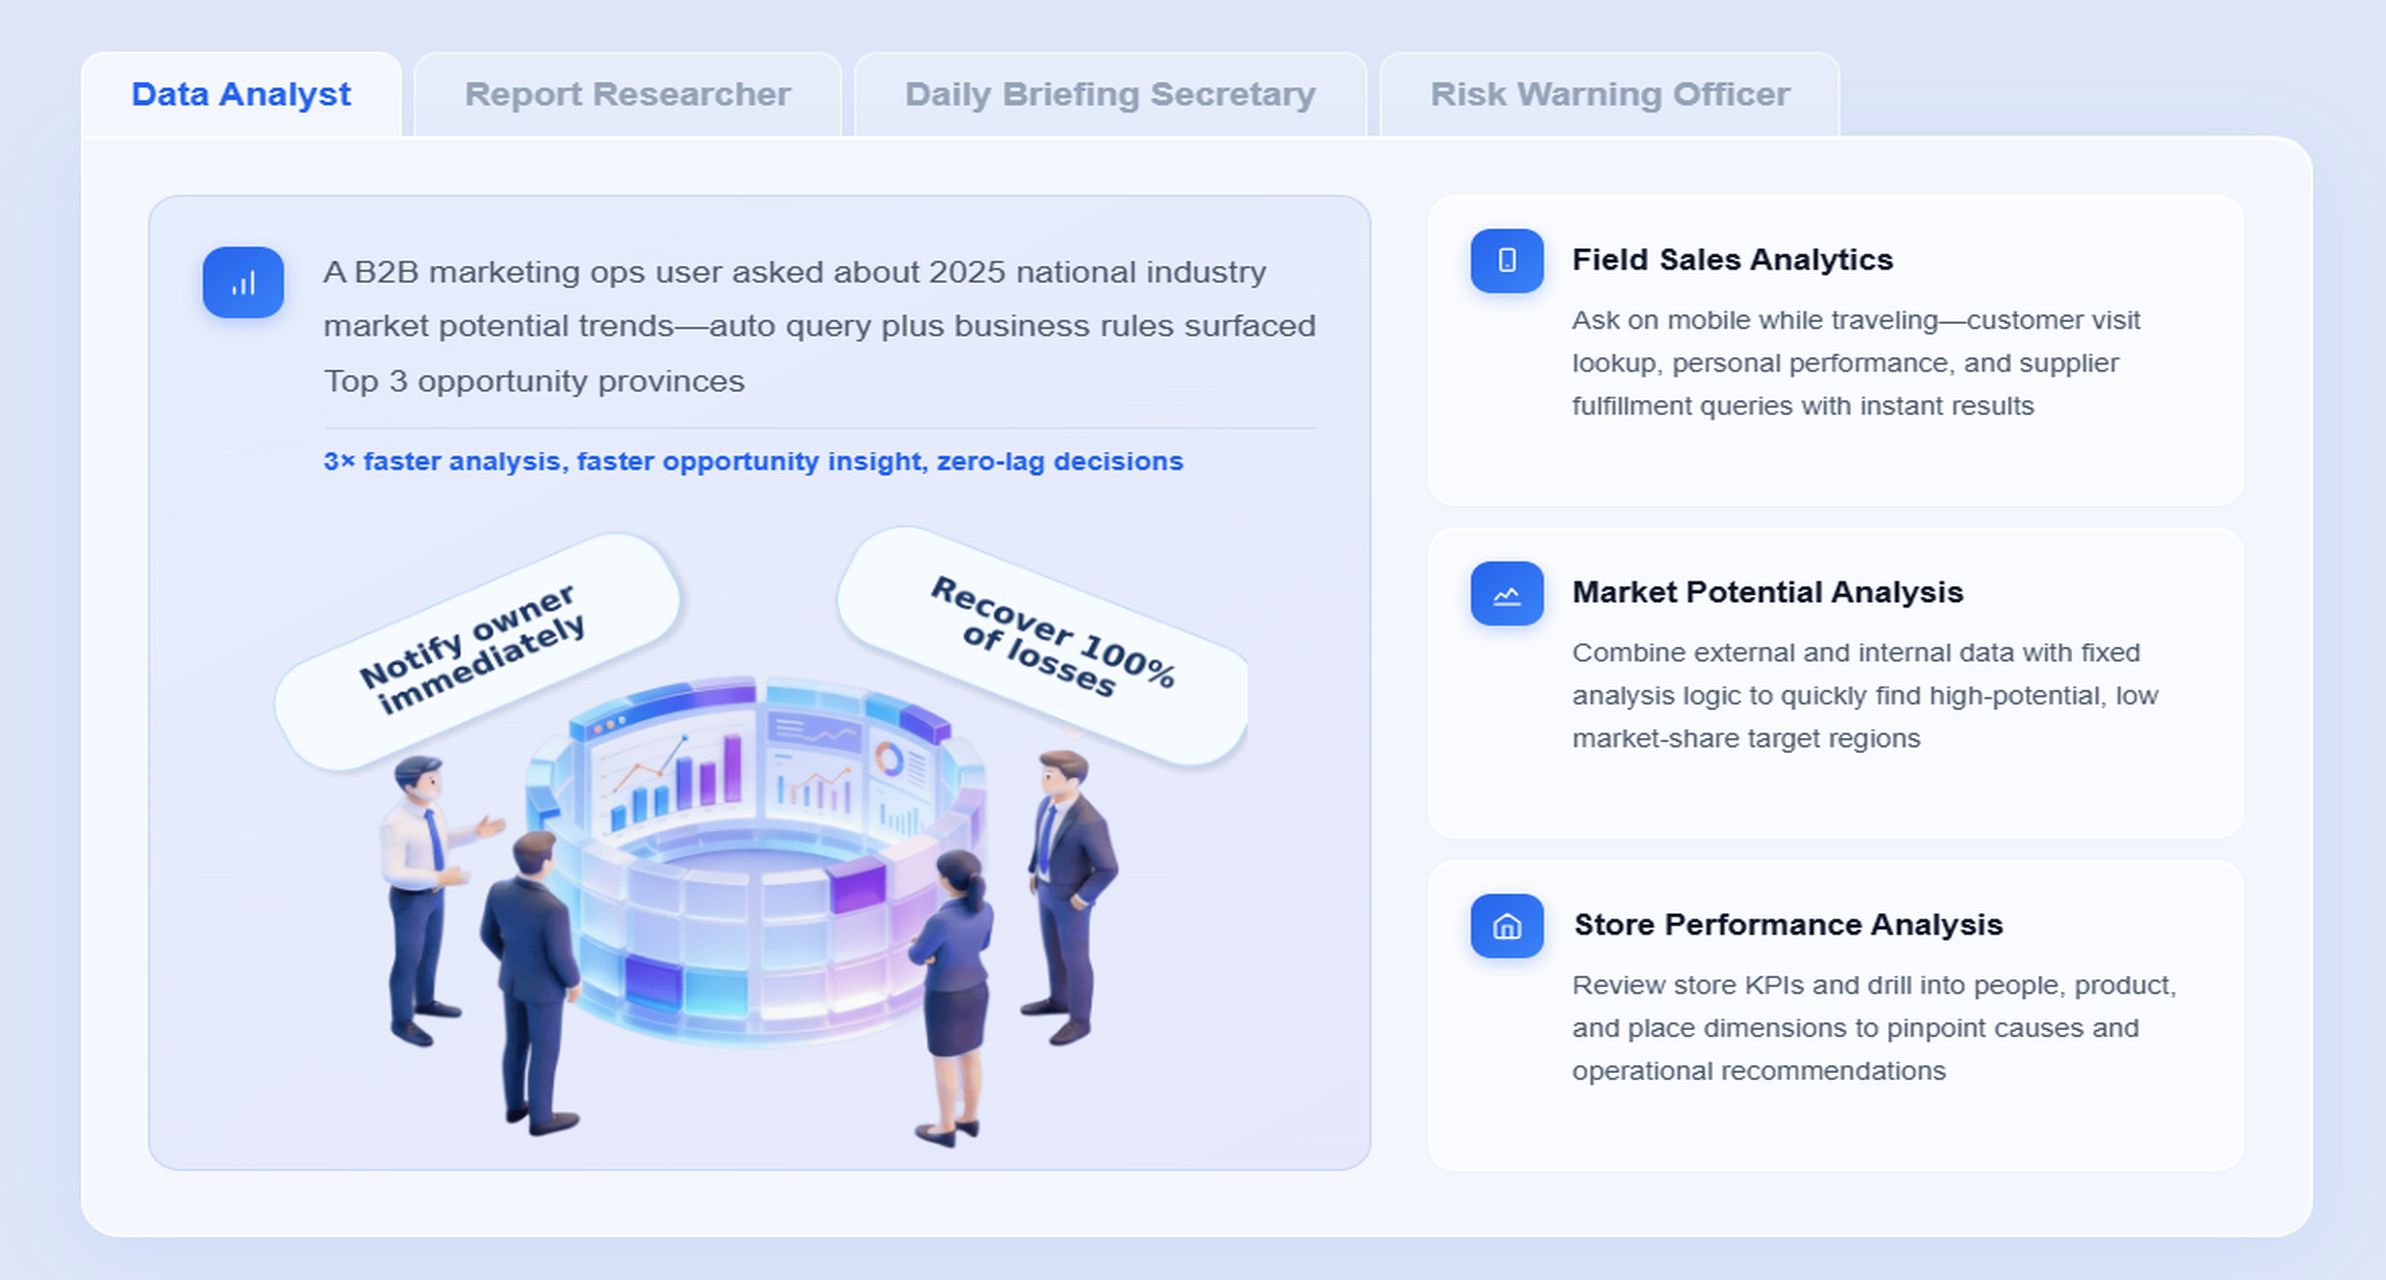
A modern finance report template should not only make reports easier to produce. It should make them easier to consume, explain, distribute, and act on. This is where Dora adds practical value as an enterprise Data Agent on top of FineReport.
In this finance scenario, the most relevant Dora digital employees are:
Report Researcher for structured monthly report summaries
Daily Briefing Secretary for scheduled finance briefings
Risk Alert Officer for material variance and cash-risk alerts
A concrete finance chat example
A finance director or executive could ask:
“Summarize this month’s finance report, highlight material revenue and margin variances versus budget, explain the cash movement, and list the owners who need follow-up.”
That request is much closer to how managers actually work than manually opening multiple files, checking budget tabs, drafting commentary, and sending reminder emails.
A 6-step AI workflow for monthly finance reporting
Understand KPI definitions, filters, and semantic rules Dora uses governed business definitions for terms like revenue, gross margin, opex, working capital, and budget variance so the response aligns with enterprise reporting standards.
Generate a structured report summary through chat Dora produces an executive-ready narrative covering KPI performance, major variances, and chart explanations based on trusted report outputs.
Detect material exceptions and threshold breaches Dora identifies adverse budget variances, unusual margin movement, cash pressure, overdue commentary items, or unresolved ownership gaps according to predefined rules.
Push summaries, alerts, and follow-up tasks Dora sends scheduled monthly or weekly finance briefings, alerts the responsible owner about material issues, and shares the relevant report link for review.
Create follow-up records for the next review cycle Dora helps maintain continuity by summarizing open issues, status changes, and prior actions for leadership review in the next reporting period.
The relevant Dora digital employee
For this scenario, Report Researcher is the most direct fit because finance teams need structured, reliable management summaries from governed reports. But the real enterprise value comes from combining multiple digital employee roles:
That foundation matters because Dora should not be treated as a prompt-only tool. It performs best when it can retrieve trusted report assets, follow governed semantic rules, and execute defined Skills in a controlled workflow.
How Dora improves execution through chat, summaries, alerts, pushes, and follow-up
Users can ask finance questions in natural language over trusted reporting assets
Executives receive structured report summaries instead of raw tables only
Finance leaders can schedule recurring monthly or weekly briefings
Exception alerts go to the right owner instead of getting buried in email chains
Follow-up records make the reporting cycle more operational, not just informational
This is why Dora should be positioned as fourth-generation Agentic BI: natural-language request, trusted semantic layer, governed query or Skill execution, report summary, exception push, and follow-up. It has better landing capability than feature-only agent comparisons because it is designed for repeatable enterprise workflows, stronger permissions, KPI governance, and workflow stability.
For executives, this means Dora is not an AI experiment. It is a landed digital employee for recurring finance reporting work such as monthly management reports, budget variance summaries, cash-risk reviews, and owner follow-up.
For IT and data teams, this means the role shifts from building every manual report output to optimizing data connections, semantic layers, data quality, permissions, report templates, and reusable agent Skills.
For business users and finance stakeholders, this means faster access to timely report summaries, chart-based answers, scheduled briefings, and exception pushes without waiting for an analyst to manually repackage the same information.
Only add business-unit or department-level modules where they create genuine decision value.
Why it matters: Standardization improves comparability and reporting speed. AI/Data Agent angle:Dora performs better when report templates, KPI definitions, and business terms are consistent.
Build a semantic layer inside the reporting workflow
Do not treat KPI names as casual labels. Define them clearly and govern them across the reporting process.
Include:
calculation logic
approved terminology
owner mapping
threshold rules
entity and period filters
Why it matters: Finance teams avoid disputes about what a number means. AI/Data Agent angle:Dora depends on a trusted semantic layer to generate accurate chart explanations and structured summaries from FineReport assets.
Treat data quality as part of the AI implementation
AI does not fix weak finance data. Before scaling AI-assisted reporting, confirm that source systems, refresh timing, and reconciliation practices are reliable enough for management reporting.
Focus on:
source consistency
close timing
reconciliation checks
approved version control
missing or late commentary handling
Why it matters: Bad source data undermines both reporting and AI output. AI/Data Agent angle:Dora works best when the underlying FineReport assets are governed and trusted.
Start with high-value recurring reports instead of automating every report
The best first use case is usually a recurring management report with:
frequent consumption
standard KPI set
stable layout
recurring commentary effort
clear owner follow-up
Monthly finance review is an ideal example because it has high repetition and clear leadership value.
Why it matters: Faster adoption and clearer ROI. AI/Data Agent angle:Dora’s digital employees are especially effective for repeatable report consumption workflows such as monthly summaries, exception push, and scheduled finance briefings.
Preserve permission governance and human review
AI-generated finance commentary should still respect enterprise permissions and approval workflows. Sensitive data should not become broadly visible through convenience features alone.
Why it matters: Governance is essential in finance reporting. AI/Data Agent angle: Controlled Skills and permission-aware retrieval provide a stronger enterprise fit than raw prompt-only agents.
Building this manually is complex. FineReport helps teams standardize trusted reports, operational cockpits, templates, and reporting workflows. Dora turns those assets into an AI assistant that can answer report questions in chat, generate structured summaries, push scheduled briefings, monitor exceptions, and follow up with responsible owners.
For a finance team, that means one practical path from manual monthly reporting to governed AI-assisted report consumption:
Dora helps leadership ask questions in natural language, receive summaries, and stay on top of material exceptions
FineReport + Dora is not only a reporting upgrade; it is a practical fourth-generation Agentic BI path. FineReport provides governed reports and operational cockpits. Dora provides the AI assistant layer for scenario execution, with more controlled Skills, lower token waste, faster execution paths, and more stable workflows than prompt-only agents.
Get Ready-to-Use Dashboard Templates in Fine Gallery
The strongest Dora pitch is scenario + product + service: FineReport provides the trusted reporting foundation, Dora provides the AI digital employee, and implementation service connects data, governance, semantic setup, Skills, report templates, permissions, and rollout.
If your goal is to build a finance report template that leadership can actually use every month, the right answer is not just a prettier spreadsheet. It is a governed reporting system that combines KPI visibility, action-ready variance analysis, executive commentary, and AI-assisted report consumption in one enterprise-ready workflow.
A strong finance report template should combine an executive summary, KPI dashboard, variance analysis, commentary, and supporting detail in one repeatable structure. This helps leaders understand performance, risks, and actions quickly.
Common monthly KPIs include revenue, gross margin, operating expense, EBITDA or operating profit, cash balance, operating cash flow, and working capital measures. The right mix depends on your business model and leadership priorities.
Start by comparing actual results against budget and prior period, then highlight the largest dollar and percentage variances. Add a short explanation of the business drivers and the impact on forecast or action plans.
Executive commentary turns numbers into decisions by explaining what changed, why it happened, and what should happen next. Without it, leadership may see the data but miss the business meaning.
FineReport helps standardize dashboards, schedules, and governed report layouts, while Dora helps summarize trusted report content and surface key exceptions through chat or scheduled briefings. Together, they can reduce manual reporting effort and improve consistency.
Product Trial
FineReport
Pixel-perfect reports · Interactive dashboards · Easy data entry · Digital twins