A strong financial analysis report is not just a finance document. In a monthly management review, it becomes the operating lens leadership uses to decide where performance is on track, where risk is building, and what action must happen next.
Most companies already have raw financial data somewhere across ERP, accounting, sales, and budgeting systems. The real challenge is turning that data into a management-ready report that is trusted, explainable, and fast enough to support recurring decisions. That is where FineReport + Dora creates practical value. FineReport builds the formatted financial reports, management packs, variance views, and operational cockpits. Dora adds the AI assistant layer so teams can ask for a report summary in chat, generate structured narratives from trusted report assets, receive scheduled briefings, and push exceptions to the right owner.
Click To Try The Dashboard
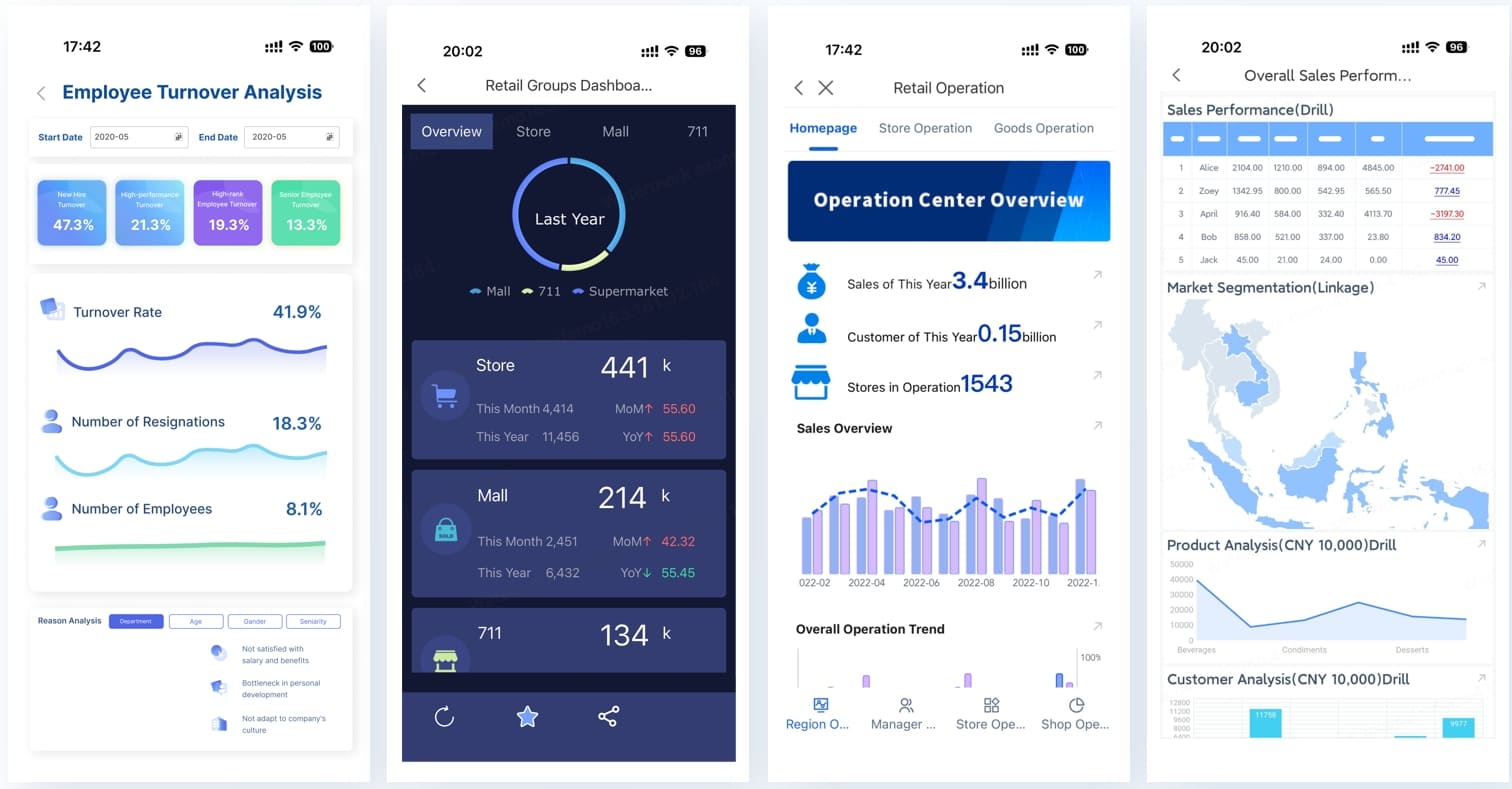
All reports in this article are built with FineReport
Why a financial analysis report matters in monthly management review
Every month, leadership needs answers to a familiar set of questions:
Are revenue and margin performing as planned?
Where are costs rising faster than expected?
Is cash flow healthy enough to support operations and investment?
Which business units are missing targets?
What risks require immediate intervention?
What decisions cannot wait until next month?
A financial analysis report matters because it converts accounting outputs into decision support. It helps management move from “what happened” to “why it happened,” “what it means,” and “what we should do next.”
For executives, this is about concrete scenario ROI. Monthly review meetings should not be spent reconciling numbers or searching across spreadsheets. They should focus on performance gaps, budget variance, cash position, business drivers, and owner follow-up.
For finance leaders, the report should create one consistent narrative from the income statement, balance sheet, cash flow statement, and supporting operational views such as sales reporting. For IT and reporting teams, the goal is to build a repeatable reporting foundation with governed definitions, permissions, templates, and refresh cycles. For business users, the goal is faster access to timely summaries without waiting for analysts to manually rewrite the same monthly commentary.
With FineReport + Dora, this guide helps you build a monthly review process that delivers:
AI-generated structured report summaries and commentary
scheduled briefings and exception follow-up
Step 1: Define the review goals, audience, and reporting scope
A monthly financial analysis report only works when it is built around the decisions management actually needs to make.
Align the report with management questions
Start by identifying the management questions behind the report. Different audiences need different levels of detail.
Executives usually want the top story: revenue, profit, cash, major variance, risk exposure, and actions required.
Finance leaders need the logic behind the numbers: drivers, reconciliation, budget impact, and trend interpretation.
Business heads need performance by unit, product, channel, region, or customer group, plus clear accountability for underperformance.
Ask these practical questions before designing the report:
Is this review primarily for performance tracking?
Is the main objective risk detection?
Does management want forecast guidance?
Is the report meant to trigger corrective action?
Which decisions must be supported in the meeting?
A good monthly review should not try to answer every question. It should answer the most important recurring ones with consistency.
Build a basic understanding of a company's financial statements
The report should connect the three core financial views rather than present them as isolated sections.
Income statement: shows revenue, cost, expense, and profit performance for the period.
Balance sheet: shows the company’s financial position, including assets, liabilities, and equity.
Cash flow statement: shows how profit is translating into cash and where liquidity pressure may be emerging.
Supporting schedules often include:
budget versus actual detail
business unit performance
receivables aging
payables position
inventory movement
capex tracking
sales reporting detail
In the monthly review, these views should connect. For example, strong revenue growth with deteriorating receivables quality may signal cash risk. Margin decline may tie back to product mix, discounting, or channel performance. Rising profit without healthy operating cash flow may require closer scrutiny.
Step 2: Choose the right metrics, dimensions, and analysis structure
A useful financial analysis report needs a clear structure. That means selecting the right KPIs, dimensions, and analysis methods for recurring decision-making.
Start with core financial statement analysis
The core metrics usually begin with the financial statements. In FineReport, these can be standardized into recurring monthly templates and management cockpits.
Here is a practical KPI framework for monthly management review:
Revenue Definition: Total recognized sales or operating income for the reporting period. Business value: Indicates growth momentum and demand performance. AI use:Dora can summarize period changes, compare business units, and explain whether variance came from volume, price, mix, or timing.
Gross margin Definition: Revenue minus cost of goods sold, shown as value or percentage. Business value: Reveals pricing power, product mix quality, and cost pressure. AI use:Dora can highlight margin erosion, compare segments, and generate chart-based explanations for unusual movement.
Operating expense Definition: Selling, administrative, and other operating costs incurred in the period. Business value: Helps management monitor cost discipline and operating leverage. AI use:Dora can identify fast-growing expense lines, summarize budget variance, and include them in a scheduled management briefing.
Net profit Definition: Final profit after all operating and non-operating items, taxes, and adjustments. Business value: Provides the headline profitability view for leadership review. AI use:Dora can generate a structured report summary showing which factors most influenced bottom-line change.
Receivables Definition: Outstanding customer balances due to the company. Business value: Measures collection health and working capital pressure. AI use:Dora can explain aging changes, flag overdue concentration, and push exception alerts to responsible owners.
Cash position Definition: Available cash and key liquidity indicators at period close. Business value: Critical for solvency, payment planning, and investment capacity. AI use:Dora can summarize cash movement drivers and highlight risk if collections, inventory, or spending trends are weakening liquidity.
Key comparison views should also be built into the report:
month over month
year to date
budget versus actual
prior year comparison
business unit or subsidiary comparison
These comparison views are where the monthly report becomes analytical rather than static.
Add business-facing views such as sales reporting
Financial reporting alone often explains the outcome, but not the operating cause. That is why management review usually needs business-facing dimensions such as:
product line
region
sales channel
customer segment
business unit
project or contract
cost center
The important rule is this: sales reporting should support the financial story, not compete with it.
If revenue is below budget, the sales view should help explain whether the gap came from a specific region, channel, or product category. If gross margin is under pressure, the operational view should help identify discounting, cost inflation, or mix shifts.
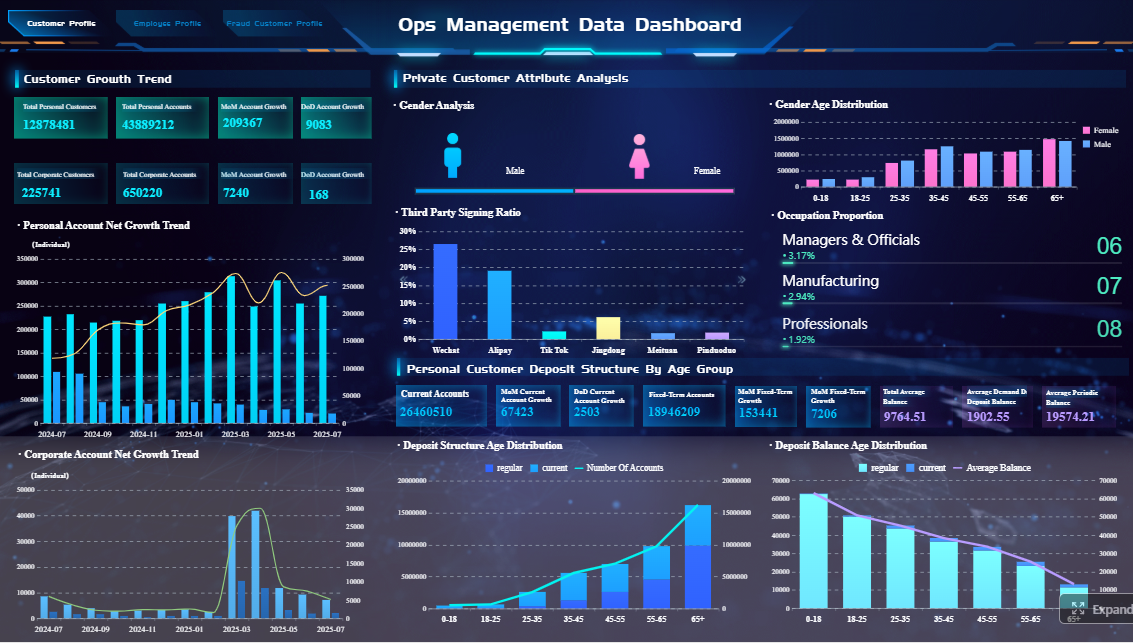
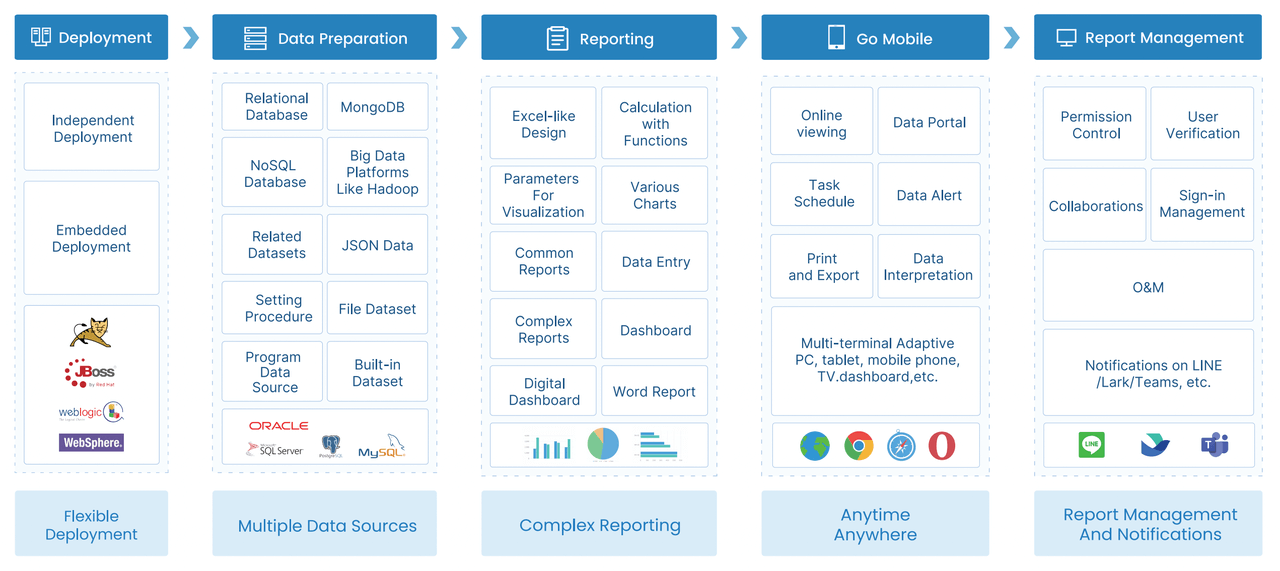
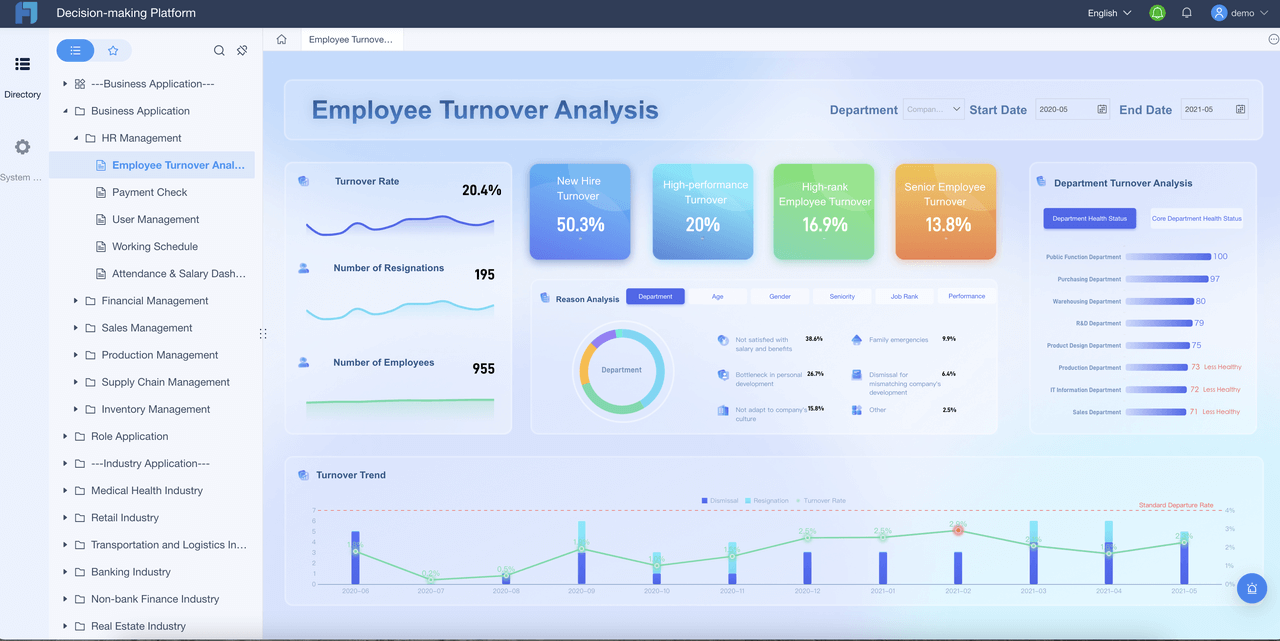
FineReport is especially useful here because it can present both formatted finance reports and linked drill-down analysis views in one governed reporting environment.
Decide which analysis types and examples fit your review
A complete monthly financial analysis report usually combines several analysis methods:
Variance analysis: compares actuals to budget, forecast, or prior period.
Trend analysis: shows whether a metric is moving in a sustained direction over time.
Ratio analysis: uses indicators such as gross margin rate, operating margin, current ratio, or receivables turnover.
Contribution analysis: identifies which business units, products, or customers are driving results.
Exception spotting: focuses attention on threshold breaches, overdue items, or abnormal change.
A good report does not overload readers with every technique. It applies the right method to the right management question.
Step 3: Prepare and standardize data in FineReport
The quality of the report depends on the quality of the reporting foundation. This is where many monthly review processes fail. Teams spend too much time reconciling source differences and too little time analyzing performance.
Connect source systems and clean the data model
For monthly management reporting, finance data usually comes from multiple systems:
Without this standardization, AI output will also be inconsistent. Dora depends on trusted report assets, governed KPI logic, and semantic clarity. That is why FineReport is the reporting foundation, not an optional add-on.
Create a structure that supports monthly management reporting
This structure should also support drill-down paths. For example:
total revenue → business unit → region → product line
operating expense → department → account category
receivables → customer → overdue bucket
Data validation checkpoints are equally important. Before a monthly report reaches management, the workflow should confirm:
source data refresh completed
reconciliations passed
mapping issues resolved
exceptions reviewed
period status locked where necessary
For IT teams, this is where their role shifts in the AI era. Instead of manually building every one-off report, they focus on enterprise data connections, semantic layers, data quality, permission governance, report templates, and reusable agent Skills.
Step 4: Use Dora to generate narrative analysis and management-ready commentary
A monthly financial review usually needs commentary, not just charts. Finance teams often spend hours rewriting the same type of narrative each month: what changed, why it changed, and what management should do next.
Dora helps turn trusted FineReport outputs into structured report summaries and management-ready commentary.
Turn metrics into clear explanations
Dora can help finance teams generate first-draft commentary such as:
key changes in revenue and margin
budget variance explanations
unusual cost movement
cash flow pressure signals
segment-level contributors to performance
exception summaries requiring owner follow-up
This matters because many monthly reviews are delayed not by data retrieval, but by the time required to interpret results and present them clearly.
A strong commentary format usually follows this pattern:
What changed?
Why did it change?
What is the likely business impact?
What should management watch next?
Because Dora works on top of trusted report and semantic assets, it can generate more grounded summaries than raw prompt-only approaches. It retrieves the relevant report, understands KPI definitions and business terms, and then produces a structured narrative tied back to the report context.
Balance automation with finance judgment
Finance judgment still matters. Dora should speed up the first draft, not replace review discipline.
This balance is what makes the AI scenario land in real enterprises. Dora is not a generic chatbot and not a replacement for finance expertise. It is an enterprise Data Agent that helps people complete recurring reporting work faster and with more consistency.
In monthly management review, the bottleneck is often not report production alone. It is report consumption. Executives, finance leaders, and business heads need fast answers from trusted reporting assets without manually opening multiple reports and interpreting every chart themselves.
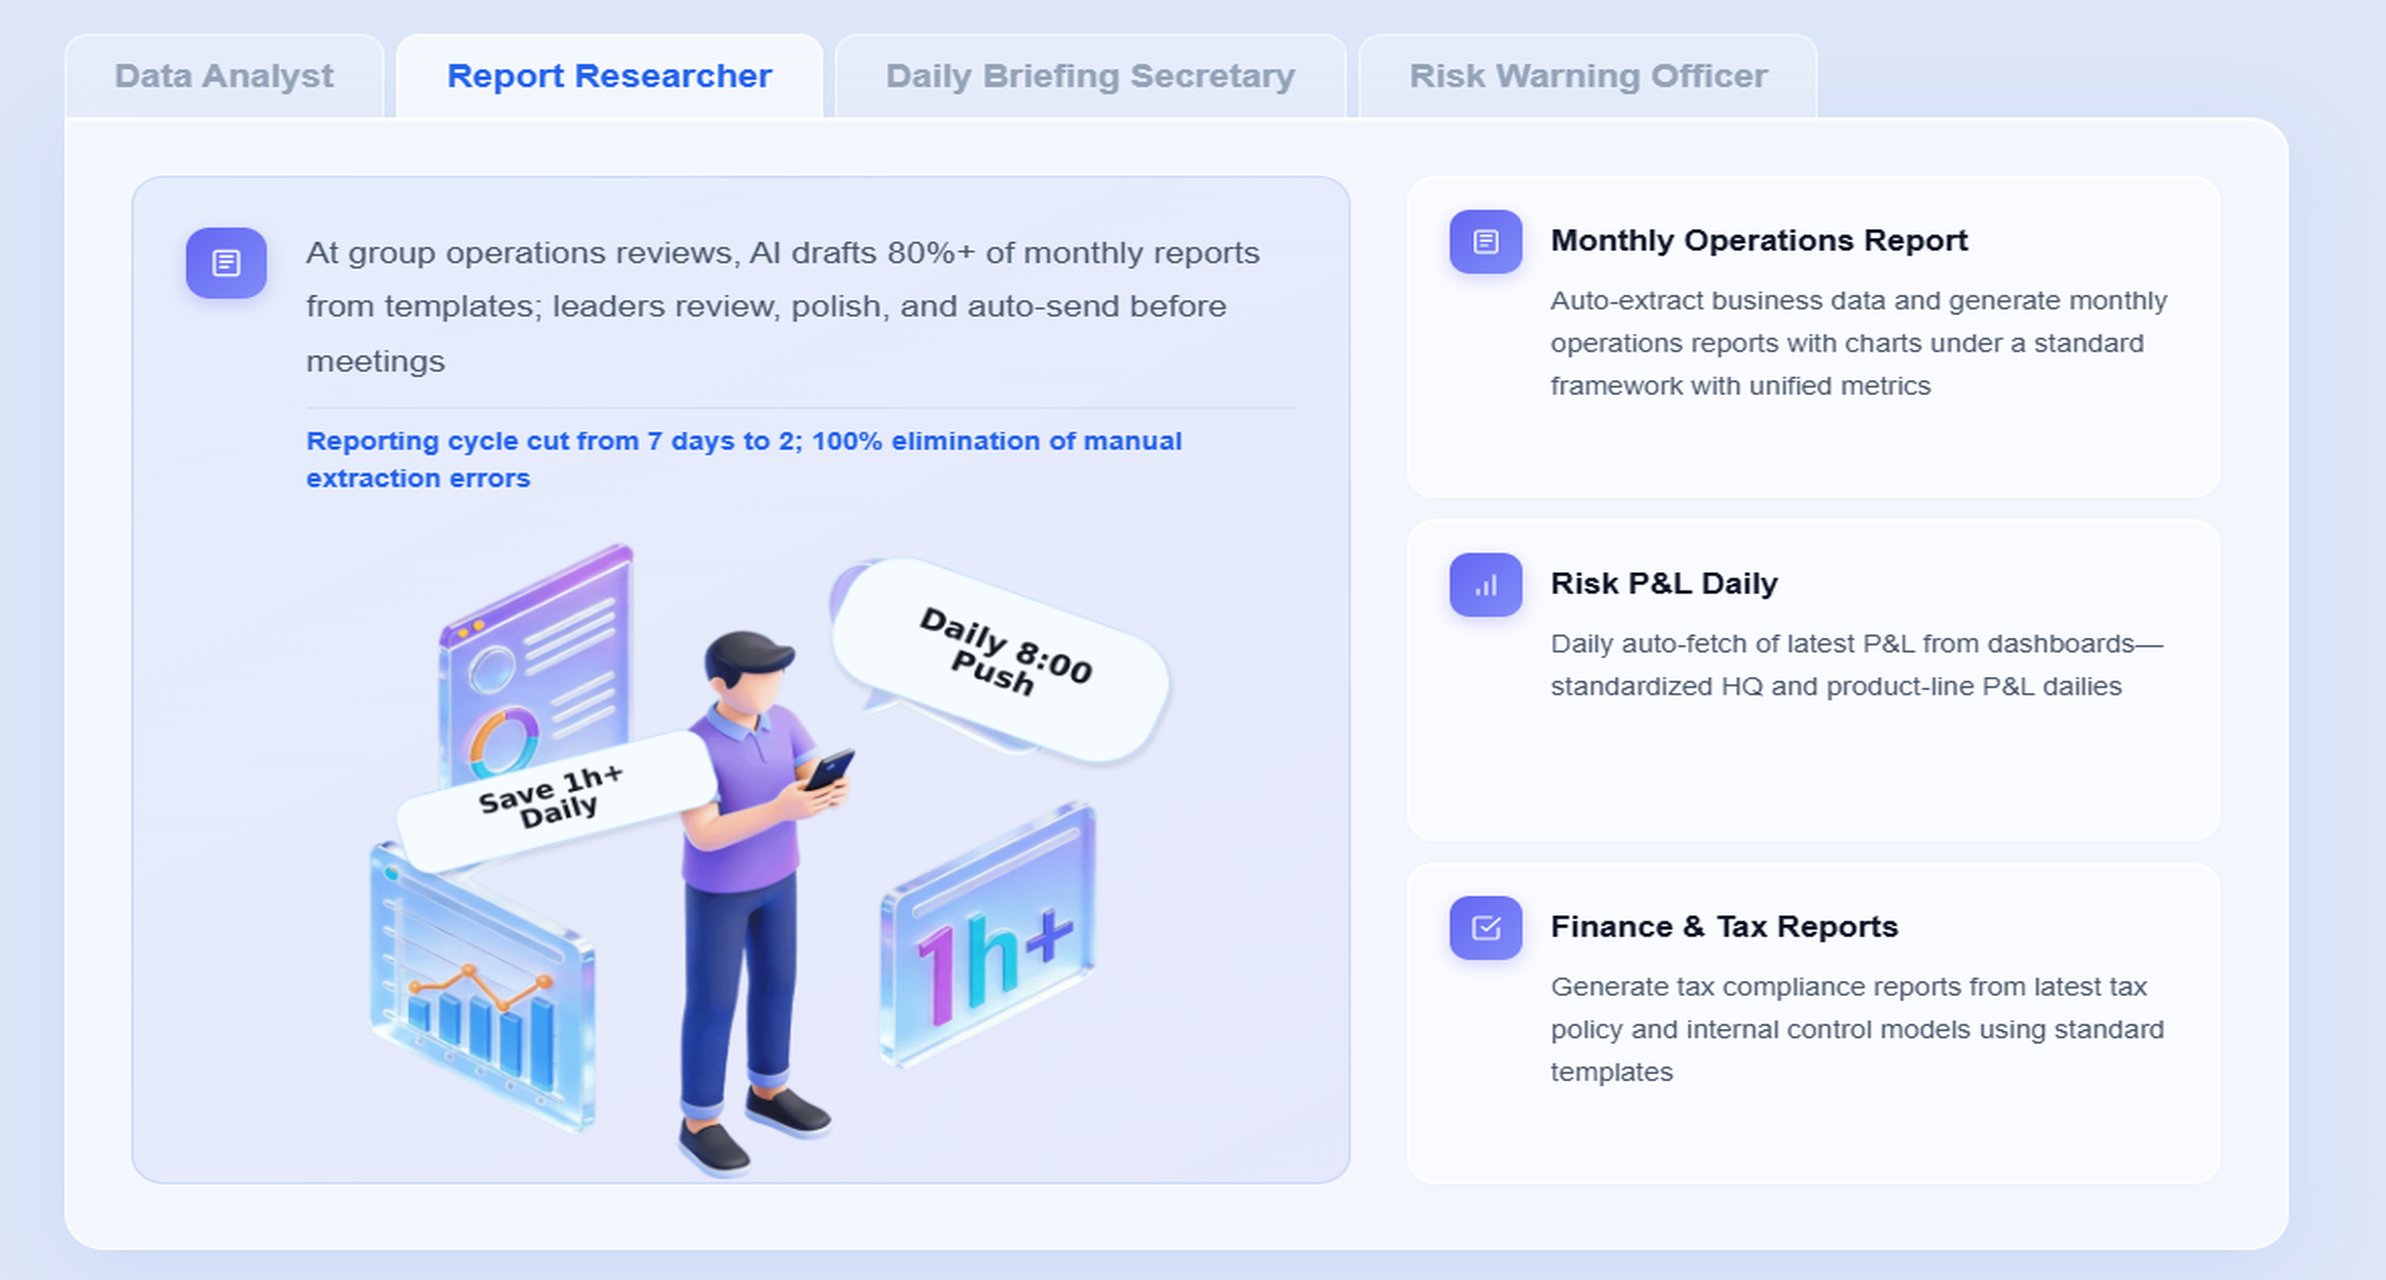
This is where Dora acts as a scenario-specific AI assistant. For this use case, the most relevant digital employees are:
Report Researcher for structured report generation and chart-based narrative
Daily Briefing Secretary for scheduled monthly and weekly finance summaries
Risk Alert Officer for variance, threshold, and overdue-item monitoring
“Summarize this month’s financial analysis report, highlight abnormal gross margin and operating expense changes, compare actuals versus budget, and list the business units that need follow-up.”
For business users, the value is lower friction. They get timely summaries and answers without searching through report folders. For executives, Dora is not an AI experiment. It is a landed digital employee for recurring work such as monthly management reports, finance risk summaries, variance alerts, and owner follow-up.
It also fits enterprise needs better than feature-only agent comparisons because it is built around governed Skills, permissions, semantic rules, and trusted report assets. That improves landing capability and helps reduce token waste, improve response speed, and increase workflow stability compared with raw prompt-only agent approaches.
Step 5: Design the report layout for fast executive understanding
Even accurate analysis can fail if the report layout is hard to scan. Monthly management review is time-constrained, so the structure should guide executives to the key message quickly.
Break down the basics of a financial analysis report
A practical layout usually includes:
Executive summary
One page with the top conclusions, major variances, key risks, and action items.
Performance highlights
Revenue, margin, expense, profit, cash position, and major KPI movement.
Detailed analysis
Business unit, product, region, channel, or cost center breakdown where needed.
Variance and trend views
Month over month, year to date, budget versus actual, and prior year comparison.
Exception and risk section
Threshold breaches, overdue items, cost overruns, or liquidity concerns.
Action items and owner follow-up
Who is responsible, by when, and what outcome is expected.
FineReport supports this well because it can combine formatted statements, bridge analysis, exception tables, and export-friendly layouts in one reporting workflow.
Include sample-style sections management teams expect
Management teams usually expect a repeatable monthly pack structure. Common sections include:
summary of financial health
revenue and profitability review
cost control analysis
balance sheet and working capital highlights
cash flow review
sales reporting section tied to financial impact
risk and exception log
decisions required and next actions
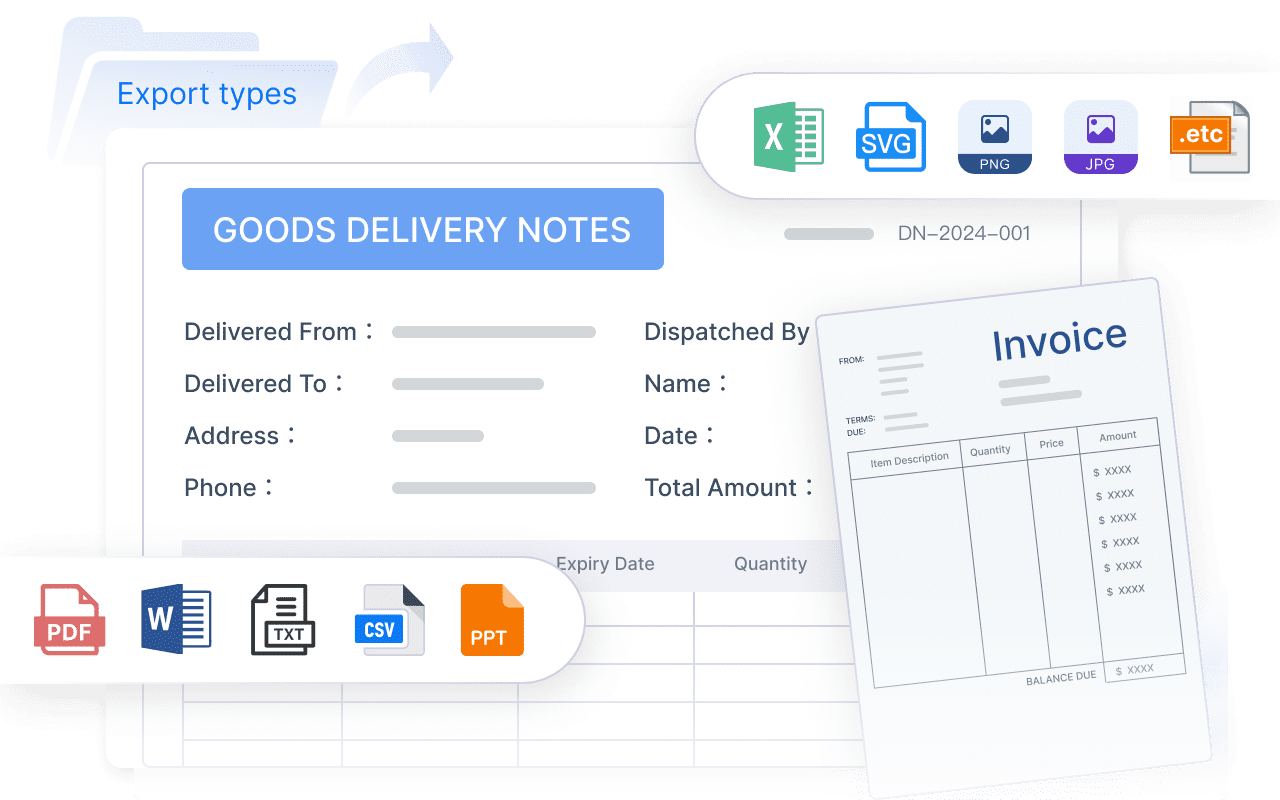
You may also need exportable PDF sections for:
board packs
archived monthly records
audit or compliance documentation
email-based pre-read distribution
The key is to make the structure repeatable without making it rigid. FineReport can standardize the template, while Dora helps generate tailored commentary for each month’s actual conditions.
Step 6: Run the monthly review process and improve it over time
The report itself is only part of the value. The rest comes from the management reporting workflow around it.
Present findings as a management reporting workflow
A mature monthly review process should include:
pre-read distribution before the meeting
summary commentary for faster executive preparation
discussion of major variances and risks
action tracking by owner
escalation for unresolved issues
documentation of decisions and follow-up status
This is another area where FineReport + Dora adds practical value.
FineReport supports the reporting workflow with standardized templates, scheduled report generation, and governed distribution. Dora can act as a Daily Briefing Secretary or Risk Alert Officer by helping prepare summaries, pushing key exceptions, and tracking what requires follow-up.
Dora flags abnormal operating expense growth in one business unit.
Dora pushes the summary and exception notice to finance and the relevant business head.
The owner receives a follow-up request before the meeting.
The management review focuses on action, not report interpretation.
Update techniques for 2026 reporting needs
Monthly finance reporting is evolving. Management teams increasingly expect:
more automation in repetitive reporting tasks
better segmentation by business driver
faster narrative preparation
stronger exception visibility
more forward-looking commentary, not just historical reporting
Improvement should be gradual and evidence-based. Review which KPIs, visuals, and explanations actually help leadership make faster decisions. Retire sections that no one uses. Expand drill-down where decisions require more context. Add AI workflows only where the reporting logic is already stable and governed.
Step 7: Final checklist for a report that drives decisions
Before finalizing your monthly financial analysis report, confirm the following:
Are the numbers validated and reconciled?
Are KPI definitions consistent across departments?
Does the report connect income statement, balance sheet, and cash flow logic?
Are budget versus actual and trend views easy to scan?
Does sales reporting support the financial story?
Are major exceptions clearly highlighted?
Is the narrative concise, useful, and management-ready?
Does each major issue have an owner and follow-up path?
Are templates, business terms, and thresholds documented for next month?
A good monthly review should reduce confusion, not create more of it. If readers need to ask basic clarification questions about definitions, scope, or data trust, the report is not ready.
Actionable Best Practices
To make this reporting scenario work in a real enterprise, focus on a few implementation priorities.
1. Standardize report templates, KPI definitions, and business terms
AI output quality depends on reporting consistency. Define terms like revenue, gross margin, operating expense, budget variance, and overdue receivables clearly. Standardize the monthly layout so Dora works from stable report structures.
2. Build a semantic layer inside the reporting workflow
Do not rely on raw field names alone. Dora performs better when FineReport assets already reflect governed business definitions, report templates, dimension logic, and filter rules. This is essential for controlled Agentic BI execution.
3. Treat data quality as part of the AI implementation
Bad mappings, incomplete refreshes, and inconsistent master data will weaken both the report and the AI summary. Data quality is not a separate technical issue. It is part of making the AI assistant enterprise-ready.
4. Start with high-value recurring reports
Do not try to automate every finance report at once. Begin with monthly management review, budget variance summary, cash flow review, or receivables risk reporting. These are repeatable, high-frequency, and decision-relevant scenarios.
5. Preserve governance, permissions, and human review
AI-generated report narratives should respect FineReport access boundaries. Use human review for executive commentary and sensitive finance interpretation. Expand Dora Skills gradually as the workflow matures and governance proves reliable.
Building this manually is complex. FineReport helps teams standardize trusted reports, operational cockpits, templates, and reporting workflows. Dora turns those assets into an AI assistant that can answer report questions in chat, generate structured summaries, push scheduled briefings, monitor exceptions, and follow up with responsible owners.
business owners get timely exception visibility and follow-up prompts
IT gains a more governable AI landing path built on existing report assets
FineReport + Dora is not only a reporting upgrade; it is a practical fourth-generation Agentic BI path.FineReport provides governed reports and operational cockpits. Dora provides the AI assistant layer for scenario execution, with more controlled Skills, lower token waste, faster execution paths, and more stable workflows than prompt-only agents.
Get Ready-to-Use Dashboard Templates in Fine Gallery
The strongest Dora pitch is scenario + product + service: FineReport provides the trusted reporting foundation, Dora provides the AI digital employee, and implementation service connects data, governance, semantic setup, Skills, report templates, permissions, and rollout.
If your team wants a monthly management review process that is more trusted, faster to consume, and easier to act on, this is a practical place to start.
A strong monthly financial analysis report usually combines the income statement, balance sheet, cash flow statement, budget versus actual results, key KPIs, and major variances. It should also explain what changed, why it changed, and what action management should take next.
Start with the main business questions, then organize the report around core metrics like revenue, margin, cost, cash, and risk. Add breakdowns by business unit, product, region, or channel so leaders can quickly spot issues and assign ownership.
Cash flow shows whether reported profit is turning into usable liquidity for operations and investment. In monthly reviews, it helps management detect pressure from receivables, payables, inventory, or other working capital issues before they become bigger risks.
FineReport helps teams build standardized financial reports, dashboards, and variance views from governed data sources. Dora adds AI support for report summaries, structured commentary, scheduled briefings, and faster follow-up on exceptions.
The most useful KPIs usually include revenue, gross margin, operating profit, net profit, cash flow, budget variance, and working capital indicators. The exact set should match the decisions management needs to make each month.
Product Trial
FineReport
Pixel-perfect reports · Interactive dashboards · Easy data entry · Digital twins