A strong competitor analysis report template should do more than collect market observations. For executives, it needs to convert competitor activity, market signals, and internal impact into clear decisions: where to defend, where to invest, and what to do next.
That is why many leadership teams move beyond static spreadsheets and disconnected slide decks. They need a repeatable monthly market intelligence dashboard with trusted reporting, executive-ready summaries, and an AI assistant layer that helps teams consume reports faster.
With FineReport + Dora, teams can ask for a report summary in chat, generate structured narratives from trusted report assets, receive scheduled briefings, and push exceptions to the right owner.
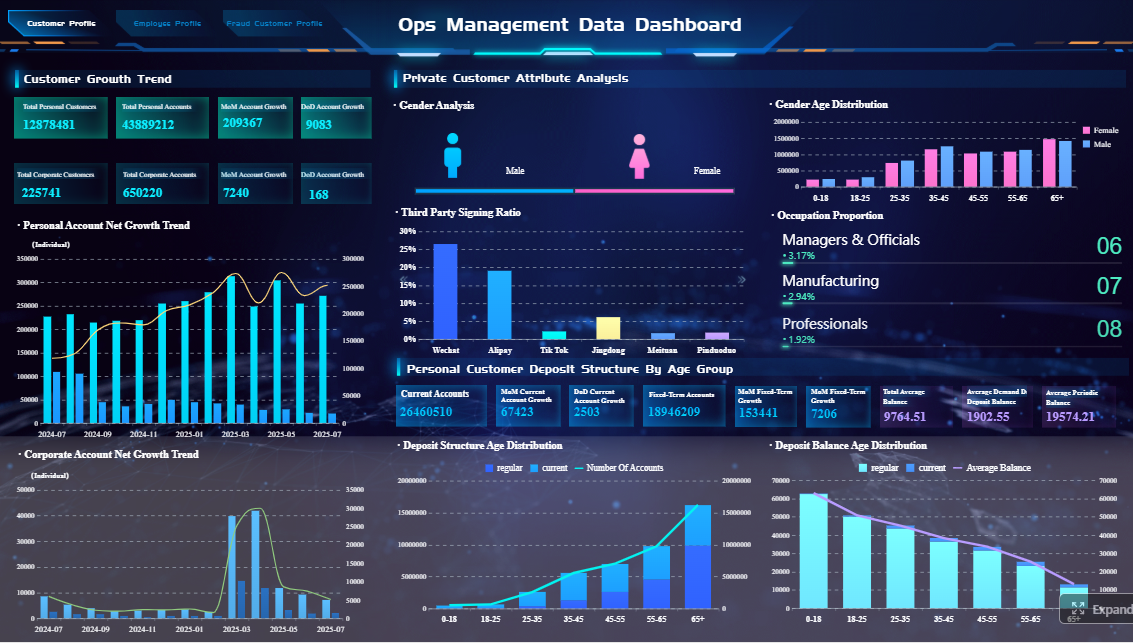 Click To Try The Dashboard
All reports in this article are built with FineReport
What a competitor analysis report template should include for executive decision-making
An executive-facing competitor analysis report template is not the same as a research worksheet. Leaders do not need every raw observation. They need the few market shifts that affect growth, margin, positioning, and near-term execution.
Clarify the business questions leaders need answered each month
Start the template with the decisions executives actually make. A useful monthly review usually answers questions such as:
- Which competitors changed price, product, channel, or market focus this month?
- Are any competitor moves likely to affect pipeline, conversion, retention, or average deal size?
- Where are we gaining or losing visibility, attention, and customer preference?
- What threats need immediate response?
- What opportunities should be funded, accelerated, or tested?
When these questions are defined upfront, the dashboard becomes a decision tool instead of a reporting archive.
A practical executive template should include five core sections:
-
Market shifts
Changes in demand, customer behavior, channel dynamics, regulation, or macro conditions.
-
Competitor moves
Pricing changes, product launches, campaigns, partnerships, hiring patterns, and geographic expansion.
-
Performance signals
Internal and external indicators that show impact, such as pipeline changes, search visibility, share-of-voice, win-loss trends, and customer feedback patterns.
-
Risks
Early warnings that may weaken revenue, margin, market share, or strategic positioning.
-
Opportunities
Gaps in competitor coverage, underserved segments, campaign openings, product differentiation angles, or regional advantages.
This structure gives executives a stable monthly rhythm while allowing teams to adapt the detail level underneath.
Separate strategic insights from raw data so executives can act quickly
One of the most common failures in a competitor analysis report template is mixing raw observations with executive interpretation.
A better design is:
- Top layer: strategic summary, key shifts, priority risks, recommended actions
- Second layer: charts, KPIs, thresholds, competitor comparisons
- Third layer: raw data, notes, evidence, and source-level detail
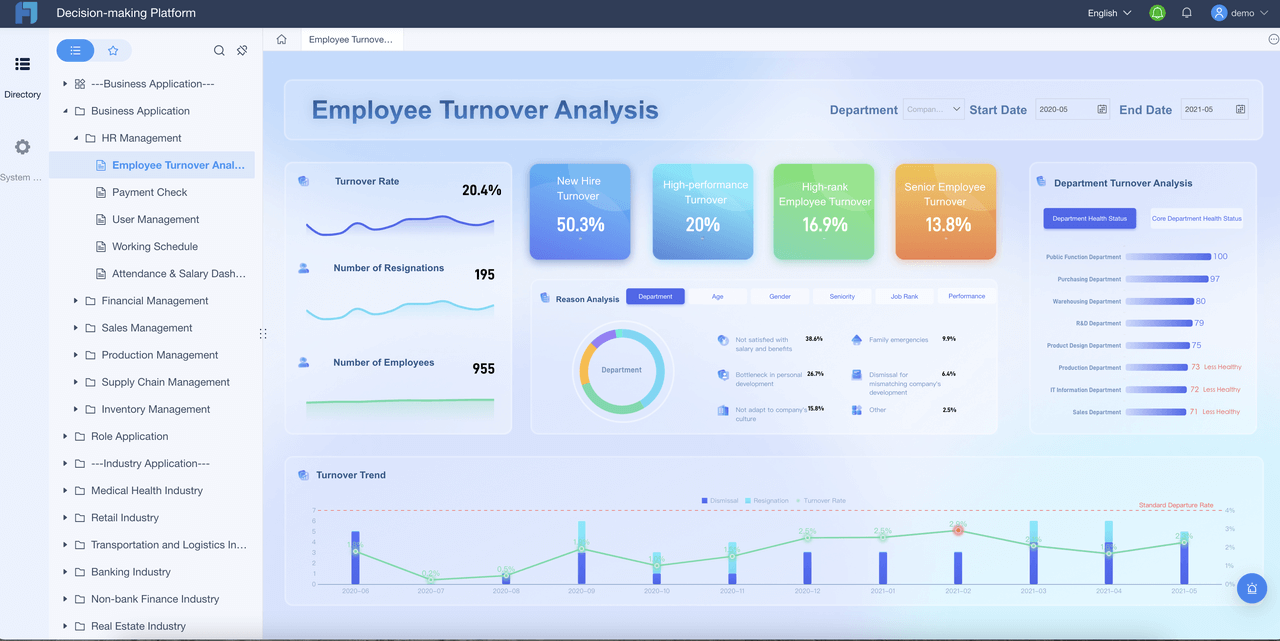
FineReport is well suited for this model because it can present one-page management views while supporting deeper drill-down pages for marketing, sales, product, and strategy teams.
Executives value consistency. A monthly report should not change format every cycle. A repeatable template should define:
- standard reporting period
- fixed competitor groups
- stable KPI definitions
- threshold rules for alerts
- commentary format
- owner fields for follow-up
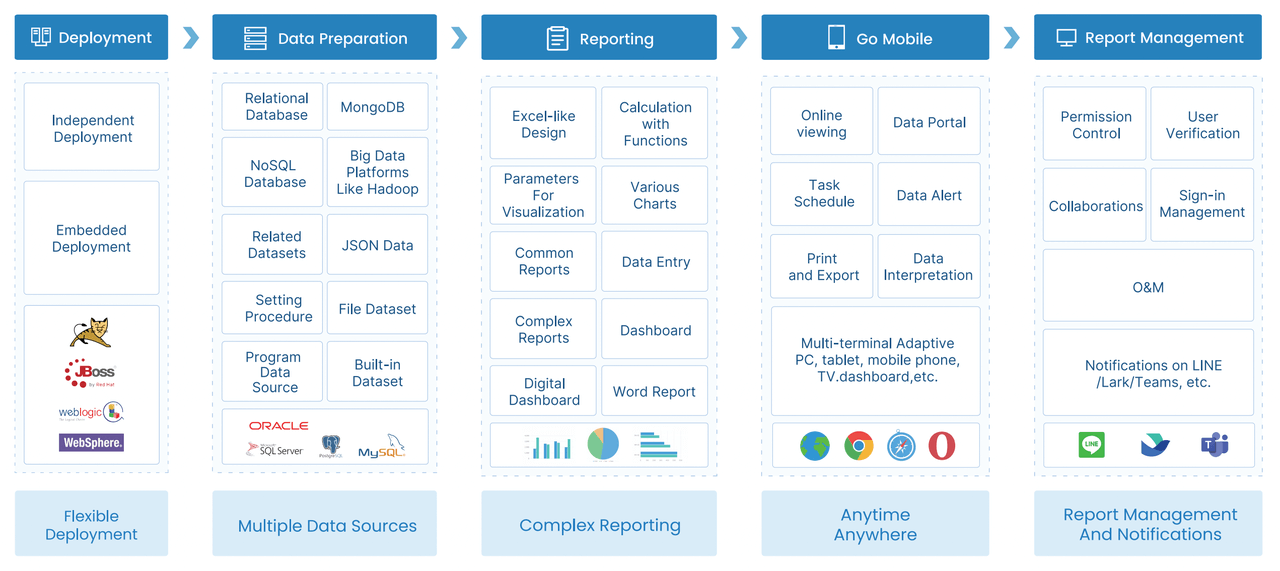
This is where enterprise reporting matters. FineReport helps standardize report templates, operational cockpits, and distribution workflows so each monthly review is easier to prepare and compare.
Core metrics and signals for a monthly market intelligence dashboard
The right dashboard is concise. It should surface the signals most likely to change leadership action, not every metric the business can measure.
Market and competitor tracking
This section tracks what competitors are doing and how the market is reacting.
-
Pricing changes
Definition: Changes in list price, discount policy, bundling, or packaging.
Business value: Pricing shifts can affect competitive pressure, deal negotiation, and margin defense.
AI use: Dora can summarize which competitors changed price, explain month-over-month differences, and include them in a scheduled executive briefing.
-
Product launches and feature releases
Definition: New products, modules, integrations, feature upgrades, or roadmap announcements.
Business value: Product movement can alter competitive differentiation and influence customer evaluation criteria.
AI use: Dora can group launches by competitor, highlight likely impact on target segments, and generate a structured report summary for leadership review.
-
Campaigns and brand activity
Definition: Major marketing campaigns, promotions, content pushes, event presence, and messaging changes.
Business value: Campaign activity often signals strategic focus and can change category visibility.
AI use: Dora can explain unusual spikes in campaign activity and connect them to share-of-voice or traffic changes in FineReport dashboards.
-
Partnerships and regional expansion
Definition: Channel alliances, technology partnerships, reseller growth, and market expansion by geography.
Business value: These moves can create new distribution strength and increase local competitive risk.
AI use: Dora can flag partnership announcements or expansion signals that exceed defined thresholds and push alerts to market owners.
-
Share-of-voice and search visibility
Definition: Relative presence across search, social, press, and category discussion.
Business value: Visibility affects awareness, consideration, and inbound demand.
AI use: Dora can summarize visibility trends, identify sudden changes, and generate chart-based answers for executives asking why attention shifted.
-
Traffic and audience engagement
Definition: Website traffic patterns, engagement depth, content response, and channel interaction trends.
Business value: Audience momentum may indicate campaign effectiveness or rising demand.
AI use: Dora can convert trend charts into management narratives and explain where competitor attention is growing fastest.
Commercial and operational indicators
This layer connects external market activity to internal business impact.
-
Sales momentum
Definition: Pipeline growth, deal velocity, win rate, and segment performance relative to competitor activity.
Business value: Helps leadership see whether market changes are becoming commercial reality.
AI use: Dora can summarize where sales momentum improved or weakened and link the summary back to FineReport sales reports.
-
Win-loss patterns
Definition: Reasons deals were won or lost, including pricing pressure, feature gaps, brand preference, or implementation concerns.
Business value: Reveals where competitors are changing customer decisions.
AI use: Dora can identify recurring themes in win-loss data and produce an executive-ready summary with priority follow-up areas.
-
Customer feedback themes
Definition: Repeated comments from prospects and customers about competitor strengths, weaknesses, or market expectations.
Business value: Converts frontline voice into strategic input for product and go-to-market action.
AI use: Dora can cluster feedback themes, summarize sentiment by issue, and surface notable changes each month.
-
Channel activity
Definition: Distributor movement, reseller behavior, partner-led demand, and campaign performance by channel.
Business value: Helps leadership understand whether competitive pressure is direct, partner-driven, or region-specific.
AI use: Dora can monitor channel anomalies and push a concise alert when partner-driven risk increases.
-
Early warning signals
Definition: Threshold breaches in pricing, demand, traffic, churn risk, or segment-specific losses.
Business value: Gives executives lead time before revenue or market share impact becomes larger.
AI use: Dora can act as a Risk Alert Officer, detecting predefined exceptions and notifying the right owner with context.
Executive-ready KPI design
A dashboard becomes executive-ready when each KPI is clearly defined, governed, and linked to action.
-
Concise KPI set
Definition: A limited number of indicators focused on business impact.
Business value: Prevents dashboard overload and speeds review.
AI use: Dora can keep summaries focused on the most material changes rather than describing every chart.
-
Thresholds and trends
Definition: Rules that define when a KPI is normal, cautionary, or critical, plus period-over-period movement.
Business value: Helps leaders quickly understand urgency.
AI use: Dora can explain whether a shift is within normal variation or needs response based on governed thresholds.
-
Clear ownership
Definition: A named team or individual for each risk, opportunity, or KPI area.
Business value: Turns reporting into execution.
AI use: Dora can push structured summaries or alerts to the responsible owner instead of only publishing a passive report.
-
Commentary rules
Definition: Standard guidance so every chart answers “what changed,” “why it matters,” and “what happens next.”
Business value: Improves consistency across monthly reviews.
AI use: Dora can generate structured report summaries aligned to these commentary rules, making management reports more usable.
How to build the dashboard workflow with FineReport + Dora
A monthly market intelligence dashboard only works when the workflow is operational, not just visually appealing. That means consistent data, role-specific views, controlled distribution, and an AI layer that helps people consume and act on the report.
Connect and structure your data sources
Most competitor analysis projects fail because data remains fragmented across tools and teams. A better approach is to centralize the reporting workflow.
With FineReport, organizations can bring together:
- CRM and pipeline data
- web analytics
- campaign performance data
- product release tracking
- win-loss records
- customer feedback themes
- third-party market and competitor data
The key is not only data connection, but standardization. Before the dashboard goes live, teams should normalize:
- competitor names and groupings
- market segments
- time periods
- region definitions
- product categories
- KPI formulas
- threshold logic
This governed reporting layer is what makes AI useful later. Dora performs best when FineReport already provides trusted reports, semantic definitions, templates, and permissions.
Design views for executives and operators
A single dashboard usually cannot serve every audience equally well. The better model is a layered reporting design.
Executive one-page summary
- major market changes
- top competitor moves
- business impact signals
- key risks and opportunities
- owner-based action list
Marketing drill-down
- campaign activity
- share-of-voice
- search visibility
- content traction
- regional awareness shifts
Sales drill-down
- win-loss patterns
- pricing pressure
- segment-specific losses
- channel activity
- competitive objections
Product drill-down
- feature launches
- roadmap threats
- integration gaps
- customer requests linked to competitor messaging
FineReport supports this structure with formatted reports, management dashboards, and operational cockpit views. Alerts, annotations, and variance highlights reduce review time and make monthly meetings more productive.
Automate the monthly reporting cycle
The monthly cycle should be systematic, not dependent on heroic manual effort.
A practical workflow includes:
- scheduled data refresh
- quality checks on missing or inconsistent records
- dashboard generation in FineReport
- commentary review by business owners
- executive distribution
- follow-up tracking on actions and risks
This is where FineReport + Dora becomes especially valuable. FineReport provides the reporting backbone and workflow structure. Dora adds the AI assistant layer that helps teams query, summarize, push, and follow up on the report output.
How an AI Data Agent Automates Report Consumption
Most enterprises already have reports. The problem is report consumption. Executives do not want to open multiple dashboards, interpret every chart, and manually request analysis from analysts each month.
Dora solves this as an enterprise Data Agent layer on top of trusted FineReport assets.
The most relevant digital employee for this scenario is a combination of:
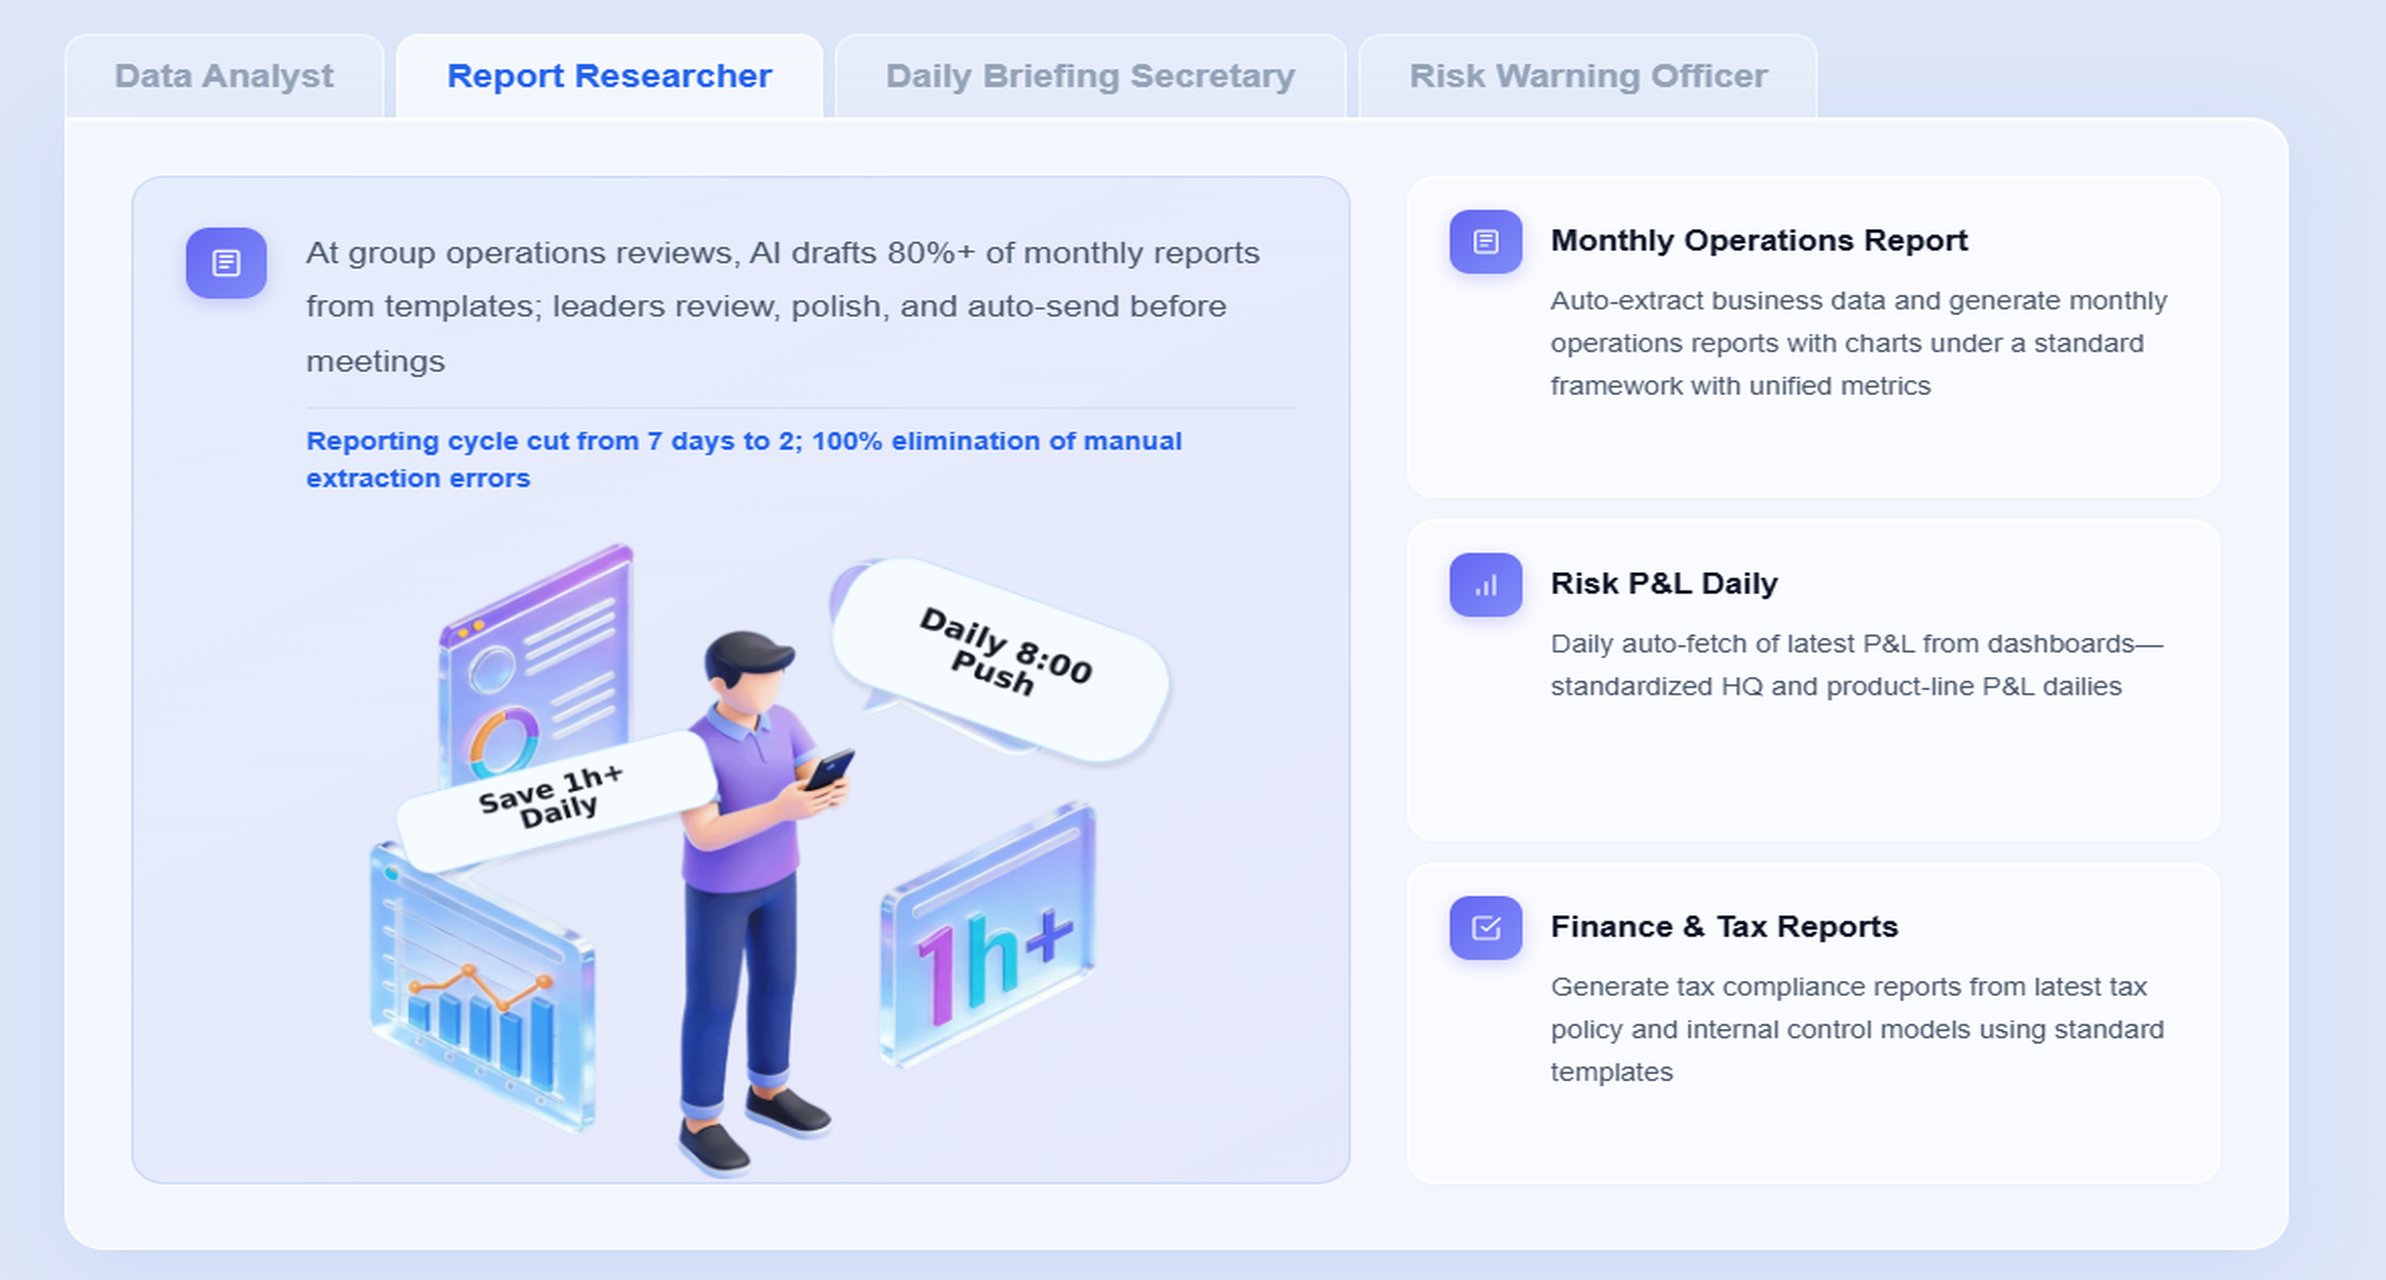
- Daily Briefing Secretary for scheduled monthly market intelligence summaries
- Report Researcher for structured report generation from report outputs, charts, and templates
- Risk Alert Officer for competitor-related exceptions that need owner follow-up
Instead of treating AI as a generic chat tool, Dora works through governed workflows, trusted semantics, reusable Skills, and existing report assets.
A concrete chat-style example query
An executive or strategy lead could ask:
“Summarize this month’s competitor analysis report, highlight major pricing and campaign changes, identify risks to pipeline and margin, and list the owners who need follow-up.”
Dora can then return a structured report summary based on FineReport dashboards and governed KPI logic rather than freeform guesswork.
A 4-6 step AI workflow for monthly market intelligence
Here is a practical Dora workflow for this scenario:
-
Retrieve trusted FineReport report or operational cockpit data
Dora accesses the monthly competitor dashboard, executive summary view, and related drill-down reports built in FineReport.
-
Understand KPI definitions, filters, business terms, and semantic rules
Dora reads governed definitions for competitors, regions, pricing categories, campaign types, and exception thresholds so the answer follows enterprise logic.
-
Generate a structured report summary through chat
Dora produces a concise management narrative: what changed this month, which competitor actions matter, where business impact appears, and which opportunities deserve attention.
-
Detect exceptions and early warning signals
Dora checks for abnormal pricing moves, search visibility losses, rising loss reasons, segment-specific weakness, or threshold breaches defined by the business.
-
Push summaries and alerts to responsible users
Dora sends the monthly briefing to executives, while specific exceptions go to sales, marketing, product, or regional owners.
-
Produce follow-up records for the next review cycle
Dora can support action tracking by recording decisions, pending investigations, and unresolved risks for inclusion in the next reporting period.
Why FineReport matters in the AI workflow
AI reporting only lands in real enterprises when the underlying reports are trusted.
FineReport provides the reporting and semantic foundation through:
- governed report templates
- operational cockpit design
- KPI definitions
- permission controls
- exception rules
- structured distribution workflows
- formatted management reports
That foundation is critical because Dora is most valuable when it can retrieve and explain trusted assets, not invent analysis from ungoverned data fragments.
How Dora improves execution after the report is built
Dora extends the value of the monthly dashboard in several practical ways:
-
Natural-language query over trusted reporting assets
Executives can ask questions in plain language without searching across multiple dashboards.
-
Chat-based AI assistant for report consumption
Users can request a chart explanation, a structured summary, or a comparison of this month versus last month.
-
Report, cockpit, metric, and exception retrieval from FineReport assets
Dora works from enterprise report assets rather than disconnected prompts.
-
Generation of structured report summaries and management narratives
Instead of sending raw charts only, teams can distribute readable executive briefings.
-
Scheduled summaries, monthly briefings, and exception alerts
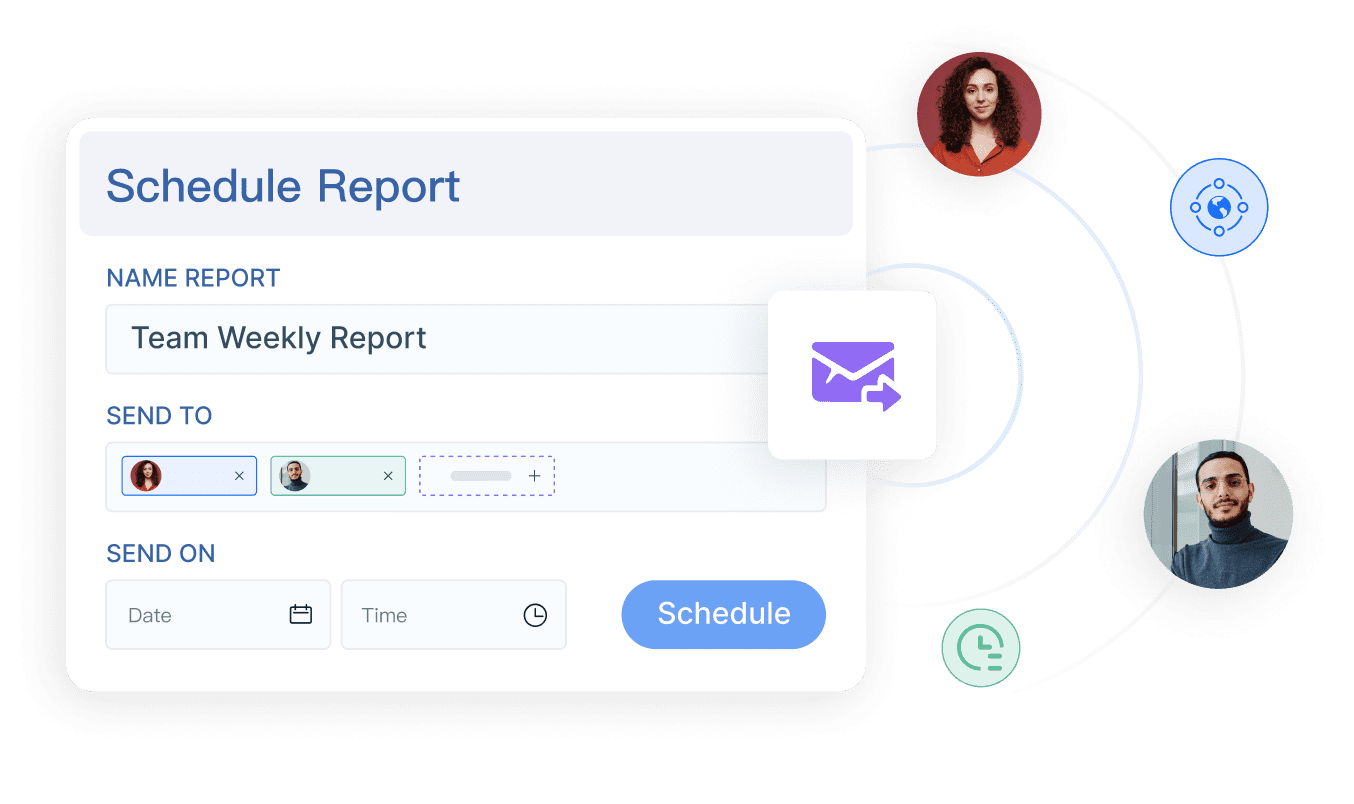
Dora supports recurring reporting work so leadership gets timely updates without manual assembly every cycle.
-
Digital employees for repeatable workflows
The Daily Briefing Secretary and Risk Alert Officer are useful examples for recurring market intelligence scenarios.
-
Skills-based execution for controllable and auditable workflows
This improves enterprise landing capability compared with feature-only agent comparisons or raw prompt-only agents.
-
Better enterprise fit
Dora aligns with permissions, semantic rules, KPI governance, report templates, and data quality requirements that business leaders and IT teams care about.
For executives, this means Dora is not an AI experiment. It is a practical AI digital employee for recurring reporting work such as monthly market intelligence summaries, competitor risk alerts, and action-oriented follow-up.
For IT, the role shifts from manually answering every reporting question to strengthening data connections, semantic layers, permissions, template governance, and reusable agent Skills.
For business users, Dora reduces waiting time. They can get timely summaries, chart-based answers, scheduled briefings, and exception pushes without chasing analysts for every question.
A simple competitor analysis report guide for monthly reviews
The best competitor analysis report template is only useful if the monthly review process is disciplined.
Monthly review agenda
A simple and effective executive meeting flow looks like this:
-
Start with major market changes
What changed in customer demand, channels, visibility, pricing, or regional conditions?
-
Review competitor actions
Which launches, campaigns, partnerships, or commercial moves matter most?
-
Assess internal impact
Did competitor behavior affect pipeline, win rate, pricing pressure, or customer perception?
-
Recommend responses
Should the business adjust campaign timing, pricing strategy, messaging, product roadmap, or channel investment?
-
End with decisions, owners, and deadlines
Every priority action should have an accountable owner and next-review checkpoint.
This structure keeps the meeting strategic and prevents it from becoming a long walk-through of charts.
Common mistakes to avoid
Several issues repeatedly weaken executive dashboards:
-
Too many metrics
A crowded dashboard slows review and hides what matters most.
-
Inconsistent definitions
If competitor categories or KPI formulas change each month, trend comparisons become unreliable.
-
Reporting activity without insight
Listing campaigns or launches is not enough. The report must explain business significance.
-
Missing benchmark context
A change may look important but be normal for the market unless compared with a relevant baseline.
-
No action recommendation
Insight without ownership rarely changes execution.
FineReport helps reduce these problems by standardizing templates and KPI logic. Dora adds another layer by turning charts into structured report summaries and owner-oriented follow-up prompts.
Different teams still need different output formats, even when the reporting foundation is centralized.
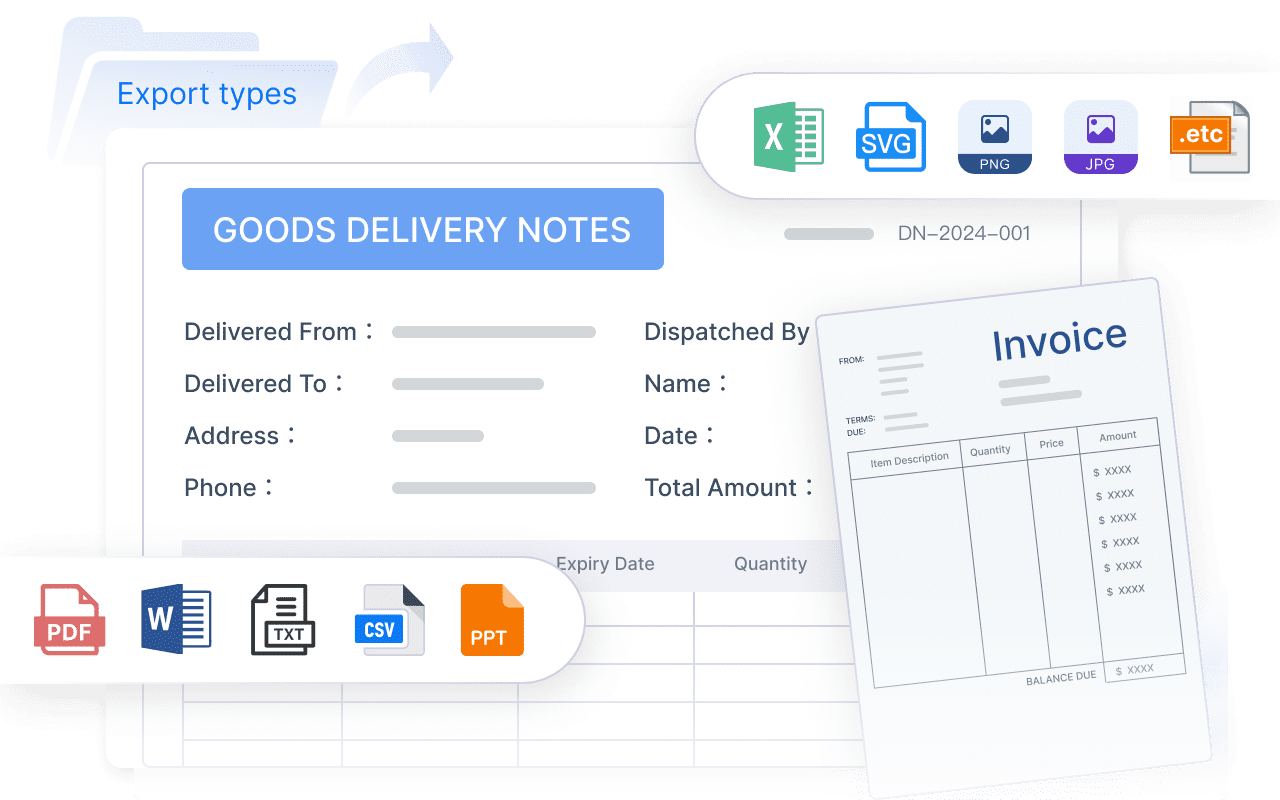
A good competitor analysis report template can support multiple delivery formats depending on the audience:
- Word for narrative briefings and strategic memos
- Excel or Google Sheets for flexible analysis and working-level comparisons
- PDF for fixed executive distribution and formal monthly packets
- Dashboard format in FineReport for interactive management review and drill-down analysis
You can also adapt the template by audience:
- Marketing leadership focuses on visibility, messaging, campaign movements, and audience engagement.
- Product strategy teams focus on feature launches, roadmap pressure, and unmet needs.
- Cross-functional leadership teams focus on enterprise impact, resource shifts, and competitive response decisions.
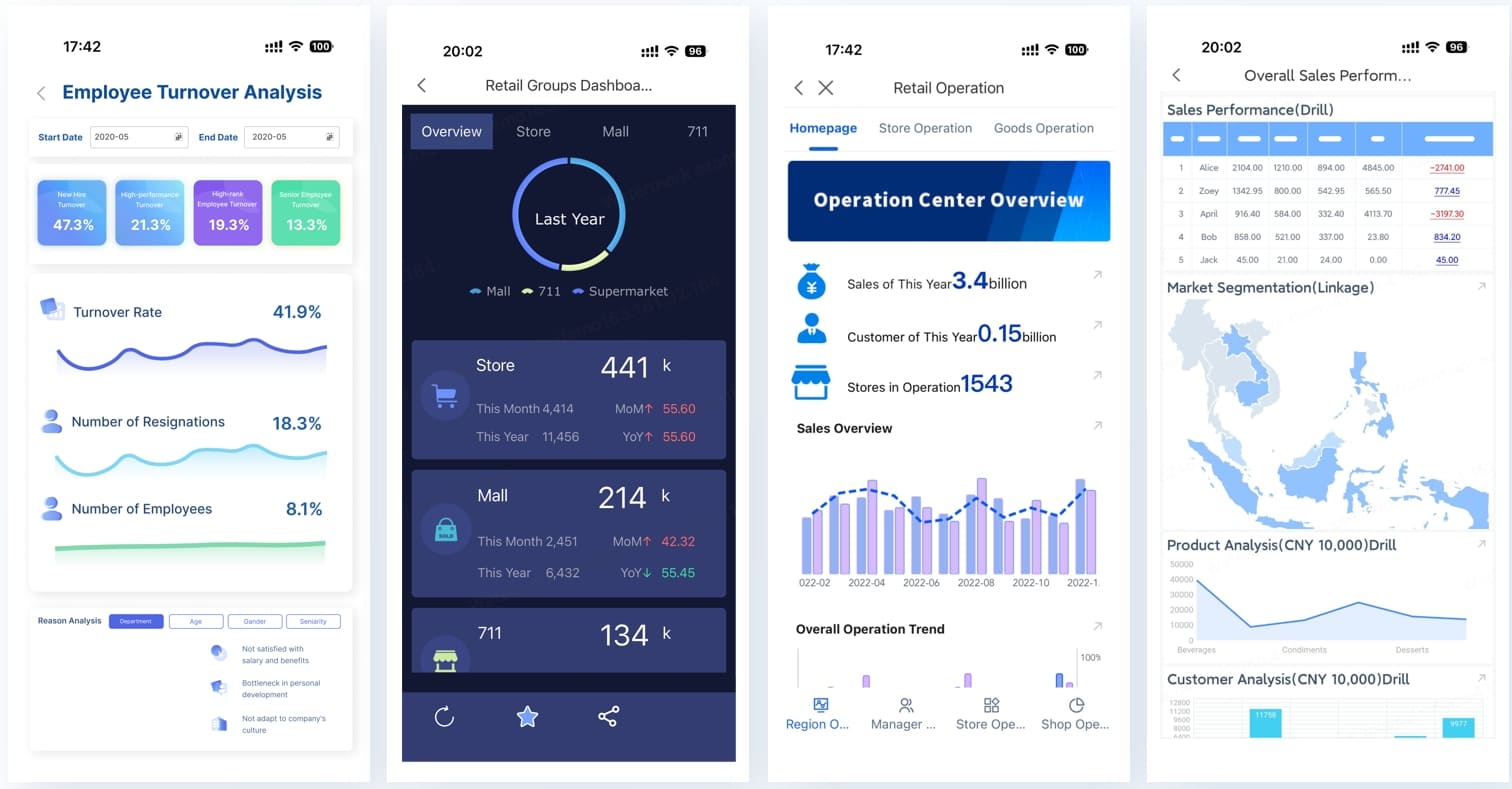
FineReport supports this variation well because the same governed data and KPI framework can feed multiple report formats while preserving consistency.
How to evaluate sample templates before adopting one
Before adopting a sample template, check whether it supports:
- trend analysis over multiple months
- competitor benchmarking
- commentary and narrative sections
- threshold-based exceptions
- owner assignment
- decision tracking
- drill-down from summary to detail
- standardized definitions across teams
The best template should scale from a simple overview to a more detailed competitive analysis process. If it only captures isolated observations, it will not support executive decision-making for long.
Best practices for turning analysis into executive action
A market intelligence dashboard creates value only when it changes decisions and execution. These best practices improve that outcome.
1. Assign owners to every insight, risk, and opportunity
Every major finding should have a clear owner. That may be sales, product, marketing, pricing, regional leadership, or strategy. Without ownership, dashboards become passive reporting tools.
Dora strengthens this by pushing relevant summaries and alerts to the right owners based on responsibility rules.
2. Standardize KPI definitions, business terms, and exception rules
This is both a reporting best practice and an AI best practice. If “share-of-voice,” “pricing pressure,” or “strategic competitor” mean different things across teams, neither dashboards nor AI summaries will be dependable.
FineReport provides the template and governance structure. Dora relies on that structure to produce more accurate, more controllable outputs.
3. Build a semantic layer inside the reporting workflow
An enterprise AI assistant should not operate on vague labels alone. It needs governed business meaning.
Define:
- KPI logic
- competitor taxonomy
- market segments
- priority thresholds
- commentary rules
- escalation paths
This semantic setup improves both reporting consistency and Dora’s ability to deliver chart-based answers, summaries, and follow-up prompts.
4. Start with high-value recurring reports
Do not try to automate every market intelligence task at once. Start with one monthly executive review that is repeated, time-sensitive, and decision-critical.
This is where FineReport + Dora lands fastest: a recurring scenario with clear stakeholders, stable templates, governed KPIs, and measurable follow-up needs.
5. Preserve permissions and human review
AI-generated report narratives should respect enterprise access boundaries. FineReport permissions should remain the control framework for what Dora can retrieve and summarize.
Also keep human review in place, especially early on. Leaders should validate commentary quality, alert usefulness, and escalation logic before expanding Skills to more workflows.
FineReport + Dora Solution Pitch
Building this manually is complex. FineReport helps teams standardize trusted reports, operational cockpits, templates, and reporting workflows. Dora turns those assets into an AI assistant that can answer report questions in chat, generate structured summaries, push scheduled briefings, monitor exceptions, and follow up with responsible owners.
For a monthly competitor analysis report template, this matters because enterprises rarely struggle only with dashboard design. They struggle with repeatability, data trust, executive consumption, and action follow-through.
FineReport + Dora addresses that full scenario:
- FineReport builds the trusted reporting foundation
- Dora turns that foundation into a scenario-specific AI assistant or digital employee
- IT gains a more governable AI path through semantic setup, permissions, data quality, and reusable Skills
- Executives gain faster report consumption and better action visibility
- Business users gain lower friction access to report answers, summaries, and alerts
FineReport + Dora is not only a reporting upgrade; it is a practical fourth-generation Agentic BI path. FineReport provides governed reports and operational cockpits. Dora provides the AI assistant layer for scenario execution, with more controlled Skills, lower token waste, faster execution paths, and more stable workflows than prompt-only agents.

Get Ready-to-Use Dashboard Templates in Fine Gallery
The strongest Dora pitch is scenario + product + service: FineReport provides the trusted reporting foundation, Dora provides the AI digital employee, and implementation service connects data, governance, semantic setup, Skills, report templates, permissions, and rollout.
If your leadership team needs a more practical competitor analysis report template for monthly executive reviews, the combination of FineReport and Dora offers a realistic path from fragmented market tracking to governed, AI-assisted market intelligence.









