Content marketing reporting tools help marketing teams turn scattered channel data into dashboards, recurring reports, and decision-ready summaries. If you are comparing options, you are likely trying to solve one of three problems: building clearer executive dashboards, understanding content attribution more deeply, or delivering polished reports to clients and stakeholders without hours of manual work.
For in-house marketers, the right tool can connect SEO, web analytics, paid promotion, and CRM outcomes into one view. For agencies, reporting tools also need to support multi-client workflows, white-label delivery, and repeatable templates. And for larger teams, reporting quality often depends on more than charts alone. It also depends on how well the platform handles automation, governance, scheduled distribution, and structured business reporting.
Key Elements of a Good Content Marketing Reporting Tool
Clear dashboard flexibility: Teams should be able to build executive summaries, channel views, and content-level breakdowns without rebuilding reports from scratch.
Reliable data connections: Useful tools pull data from analytics, advertising, SEO, CRM, and social platforms with minimal manual work.
Attribution support: Good reporting should show not just visits, but content influence across leads, conversions, and pipeline where possible.
Client or stakeholder readability: Reports should be easy to interpret, branded when needed, and built around business questions rather than raw metrics.
Customization and scale: As reporting matures, teams often need templates, permissions, and reusable workflows across departments or accounts.
What to look for in content marketing reporting tools
Choosing among content marketing reporting tools is less about finding a single feature and more about matching the tool to your reporting workflow. Some teams need fast dashboards. Others need deeper attribution. Agencies may care most about client-ready delivery. Enterprise marketing operations often need stricter report standardization and broader business reporting support.
Core evaluation criteria: dashboard flexibility, attribution depth, automation, integrations, and ease of sharing
Dashboard flexibility: Can you create role-based views for executives, content managers, SEO teams, and clients?
Attribution depth: Does the platform show first-touch, multi-touch, or conversion-path insights, or is it mostly surface-level channel reporting?
Automation: Can reports refresh automatically, trigger scheduled delivery, and reduce spreadsheet work?
Integrations: Does it connect to the marketing stack you actually use, such as GA4, Search Console, social platforms, ad tools, CRM systems, and data warehouses?
Ease of sharing: Can stakeholders view dashboards in real time, receive PDFs or links, and understand the story without analyst support?
A tool may be excellent for dashboarding but weak for formal recurring reports. Another may be strong in attribution but less useful for executive presentation. That trade-off matters.
Which teams benefit most: in-house marketers, agencies, and multi-client reporting teams
Different teams need different reporting strengths:
In-house content teams often prioritize campaign monitoring, organic performance, lead generation trends, and executive summaries.
Agencies usually need reusable templates, brandable reports, client portals, and efficient multi-account management.
Multi-client reporting teams need scale: standardized layouts, fast onboarding, cross-client comparisons, and reliable scheduled delivery.
Common reporting challenges these tools should solve
Struggling to explain content impact beyond pageviews
Delivering reports that are visually clean but not actionable
Creating separate dashboards for internal teams and external clients
Losing consistency across accounts, business units, or reporting periods
How we compared the 10 tools
This comparison is designed for readers who need a practical buying framework rather than a vendor feature dump. Instead of ranking tools only by popularity, we looked at how well each one supports real reporting work across dashboards, attribution, automation, and stakeholder communication.
Scoring criteria and weighting
We compared tools using six practical factors:
Usability: How quickly teams can build, update, and maintain reports
Customization: Flexibility for dashboards, templates, branded reports, and role-based views
Connector coverage: Breadth of connections across analytics, search, social, ads, CRM, and data sources
Attribution features: Ability to track content influence, conversion paths, or revenue contribution
Report delivery options: Scheduling, exports, shared dashboards, white-label support, and recurring distribution
Pricing transparency: Whether buyers can understand packaging and likely fit without a long sales cycle
Because content marketing reporting often spans different use cases, no single category determines the best tool on its own.
Best fit by use case
Different tools stand out for different reporting jobs:
Fast-moving content teams: Usually benefit from quick setup, ready-made dashboards, and common marketing connectors
Agency account managers: Need repeatable templates, white-label presentation, and easy client sharing
Executives: Prefer concise summaries with trends, outcomes, and clear narrative context
Clients who need clear summaries: Often respond best to visual clarity, annotations, benchmarks, and recurring delivery instead of deep analytical complexity
10 tools compared: strengths, limitations, and ideal use cases
Rather than force all 10 tools into one mold, it is more useful to group them by their core strengths.
Dashboard and visualization leaders
These platforms are often strongest when stakeholders need clear performance overviews, trend monitoring, and interactive summaries.
1. FineReport
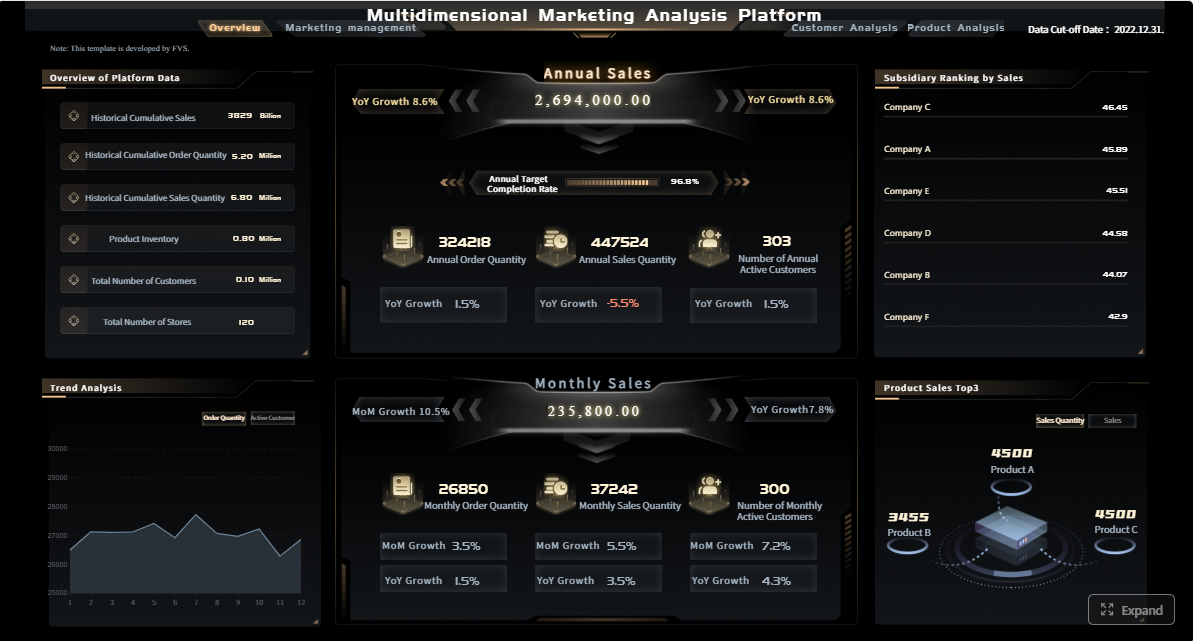
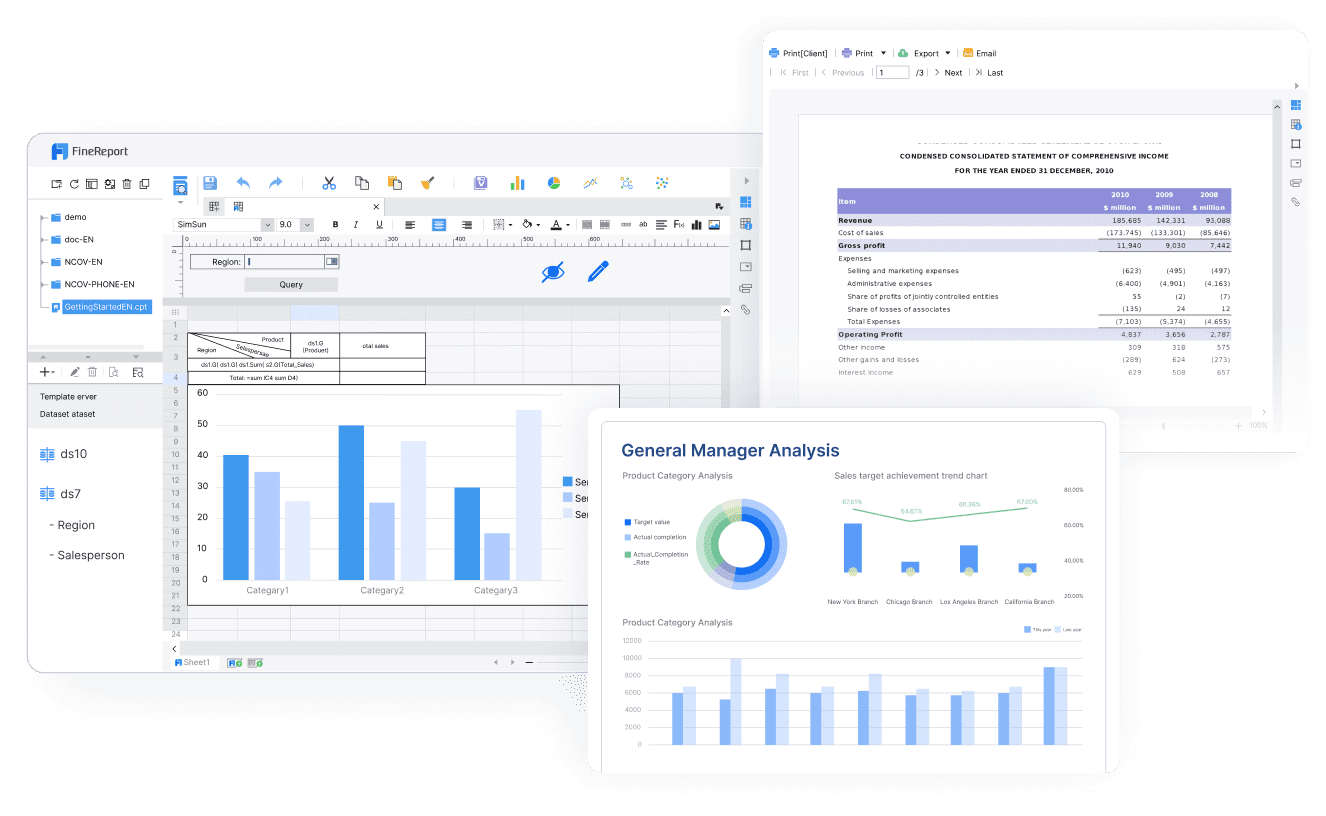
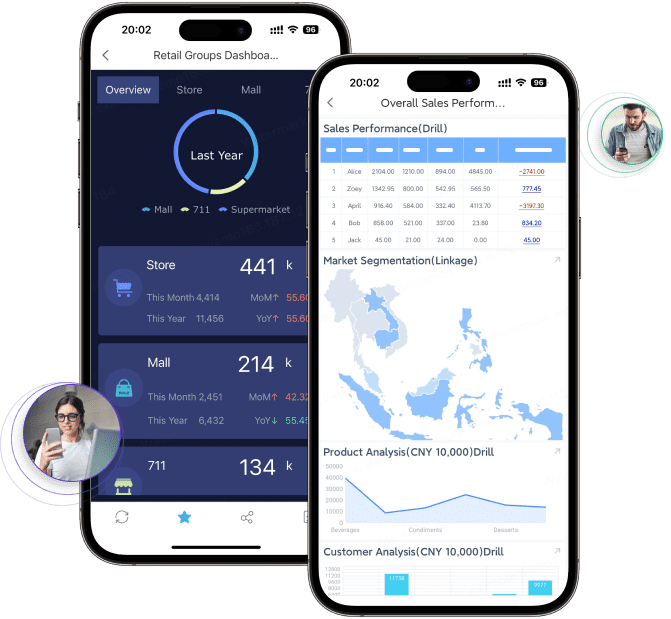
FineReport is not only a dashboard tool. It is an enterprise reporting platform designed for teams that need structured reports, dashboards, parameter-driven queries, scheduled distribution, and more standardized reporting workflows. For content marketing teams, this becomes relevant when reporting expands beyond campaign snapshots into repeatable management reporting, executive packs, channel operations reviews, or cross-department reporting.
Strengths
Supports dashboards and highly structured reports in one platform
Well suited for pixel-perfect and paginated report design
Supports data entry and form-based workflows in scenarios where teams need reporting plus input processes
Limitations
May be more than a small team needs if the only goal is a lightweight dashboard
Best fit is usually organizations with recurring, formal, or cross-functional reporting requirements
Attribution still depends on the quality of connected data sources and business logic
Ideal use case
Growing agencies, enterprise marketing operations, or organizations that need both visual dashboards and formal recurring reports that are printable, distributable, and standardized
Tableau is widely used for visual analytics and interactive dashboards. It is a strong choice when marketing teams want flexible exploration, polished visuals, and advanced data storytelling.
Useful when marketing data needs to be explored alongside broader business data
Limitations
Can require more setup and data modeling effort than lighter marketing tools
Not always the simplest option for fast client reporting workflows
Formal paginated reporting needs may require additional tooling or workarounds
Ideal use case
Marketing operations teams or analytics groups that need advanced visualization and deeper exploratory reporting
3. Power BI
Power BI is a popular BI platform, especially for organizations already working in the Microsoft ecosystem. It is often chosen for scalable dashboards, modeling, and internal reporting.
Good fit for organizations using Microsoft products
Supports interactive dashboards and enterprise distribution
Useful for combining marketing data with finance, sales, or operational data
Limitations
Marketing-specific reporting templates may require more customization
Client-facing agency workflows are not its main specialization
Attribution quality depends heavily on data architecture rather than default marketing features
Ideal use case
Internal marketing and business intelligence teams that want scalable analytics with enterprise governance
4. Looker Studio
Looker Studio remains a common entry point for content and SEO reporting because it is accessible and widely used for dashboard creation.
Strengths
Familiar for many marketers
Good for basic to mid-level dashboards
Works well for channel summaries and lightweight stakeholder sharing
Often attractive for budget-conscious teams
Limitations
Can become harder to manage as reporting complexity grows
Customization and governance may feel limited for larger organizations
Client-ready polish sometimes depends on manual refinement
Ideal use case
Small to midsize marketing teams that need simple dashboards quickly
5. Databox
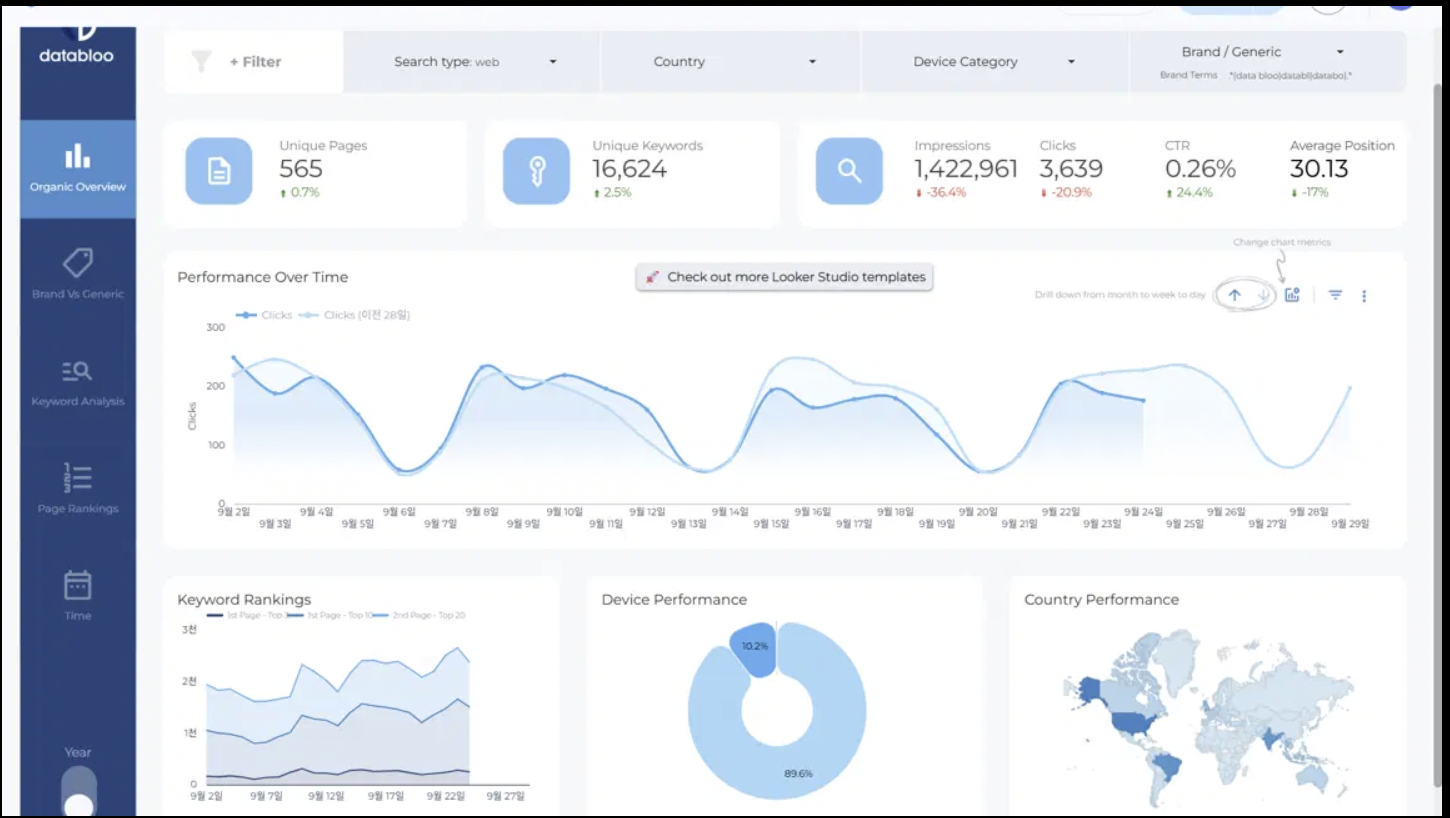
Databox is built around KPI tracking and marketing dashboards, making it a practical fit for teams that want focused summaries rather than full BI complexity.
These tools are more relevant when the main question is not just “How did content perform?” but “How did content influence revenue, leads, or pipeline?”
6. Google Analytics 4
GA4 is foundational for behavioral and event-based website analysis. For content marketers, it helps track traffic sources, engagement events, and conversion behavior.
Strengths
Strong website and event analytics foundation
Useful for path analysis and engagement measurement
Flexible for content interaction tracking when configured well
Limitations
Not a complete reporting presentation layer on its own
Attribution interpretation can be challenging for non-analysts
Client-ready summaries often need another dashboard or reporting tool
Ideal use case
Teams that need detailed website-level content performance and conversion behavior analysis
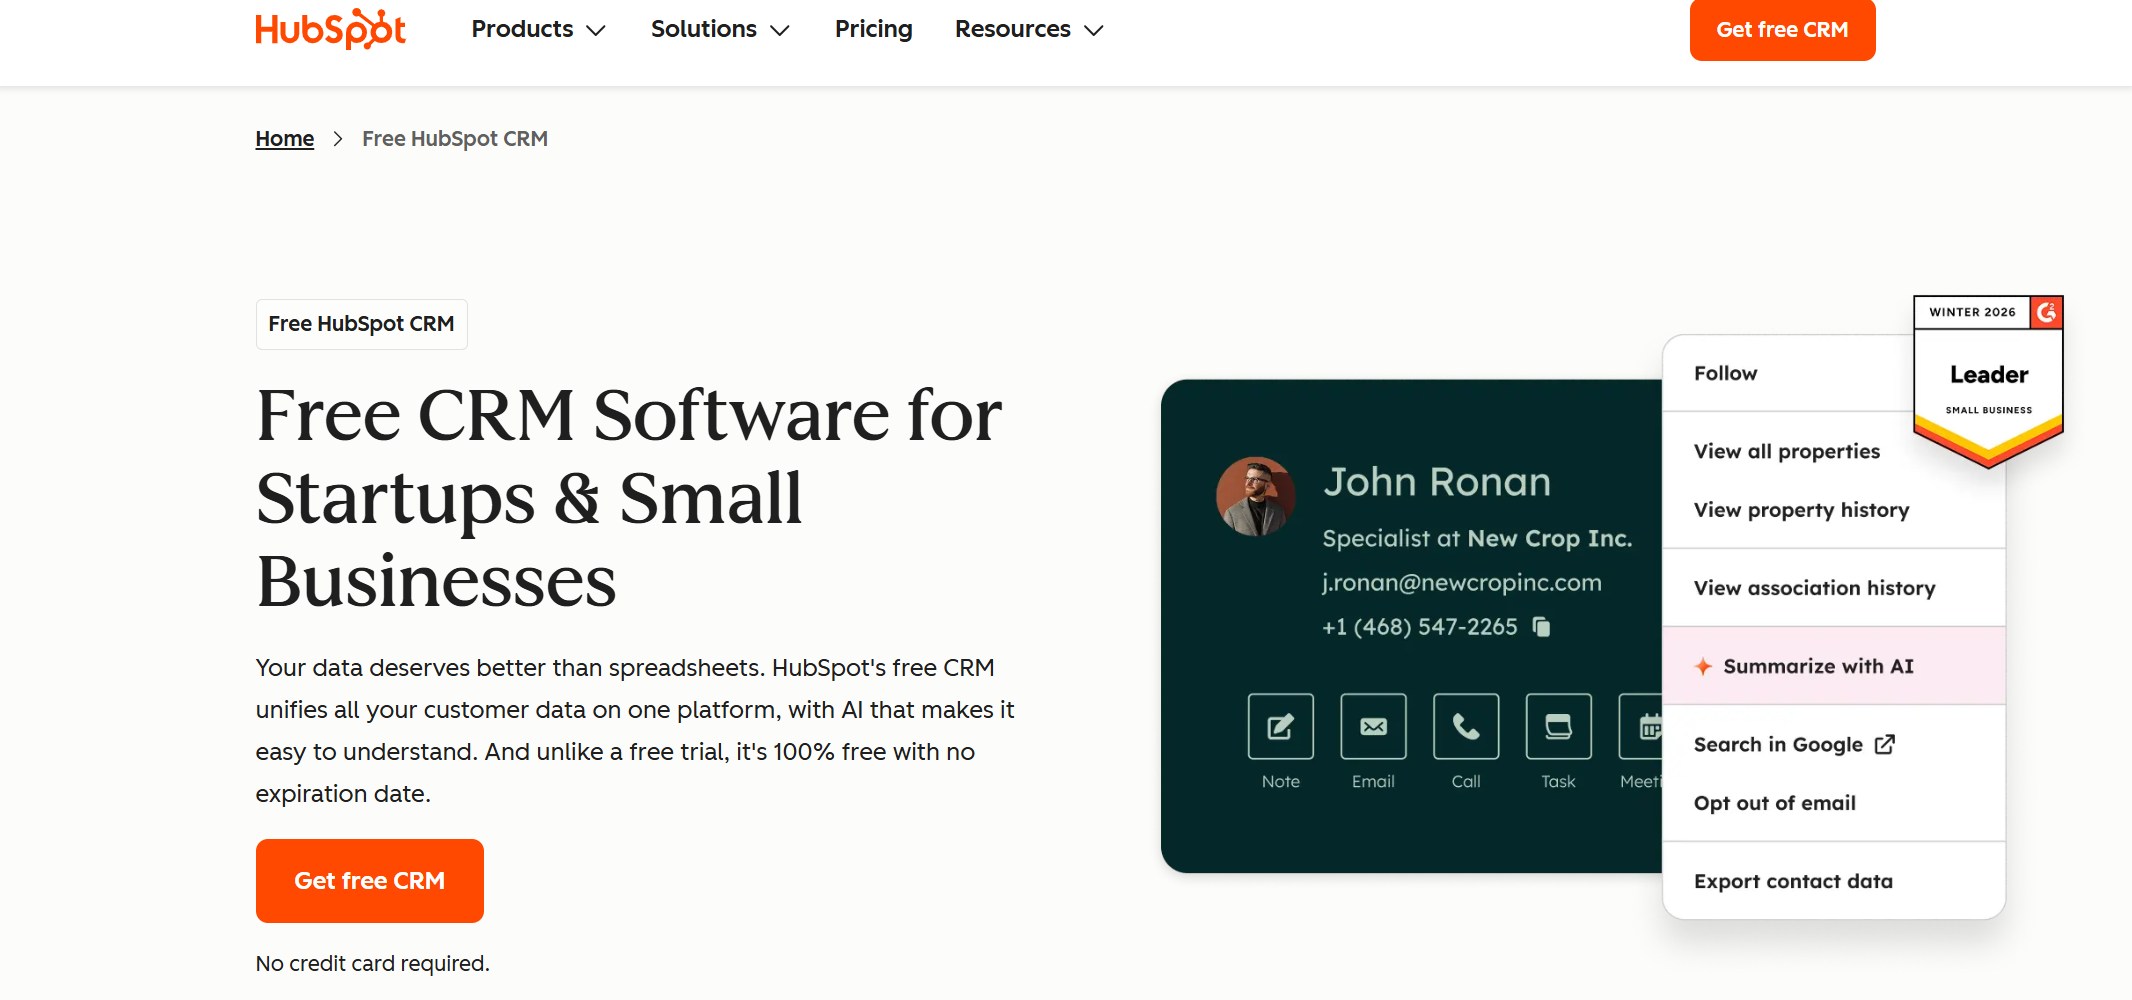
7. HubSpot Marketing Analytics
For teams already operating in HubSpot, its reporting environment can connect content, lead generation, and CRM outcomes more closely than many standalone dashboard tools.
Strengths
Useful for linking content activity with lead and funnel outcomes
Better business context when content and CRM data already live in HubSpot
Good fit for inbound and lifecycle reporting
Limitations
Best value is often tied to broader HubSpot adoption
Cross-platform visibility may depend on additional integration work
Ideal use case
B2B marketing teams managing content, lead capture, and lifecycle reporting in HubSpot
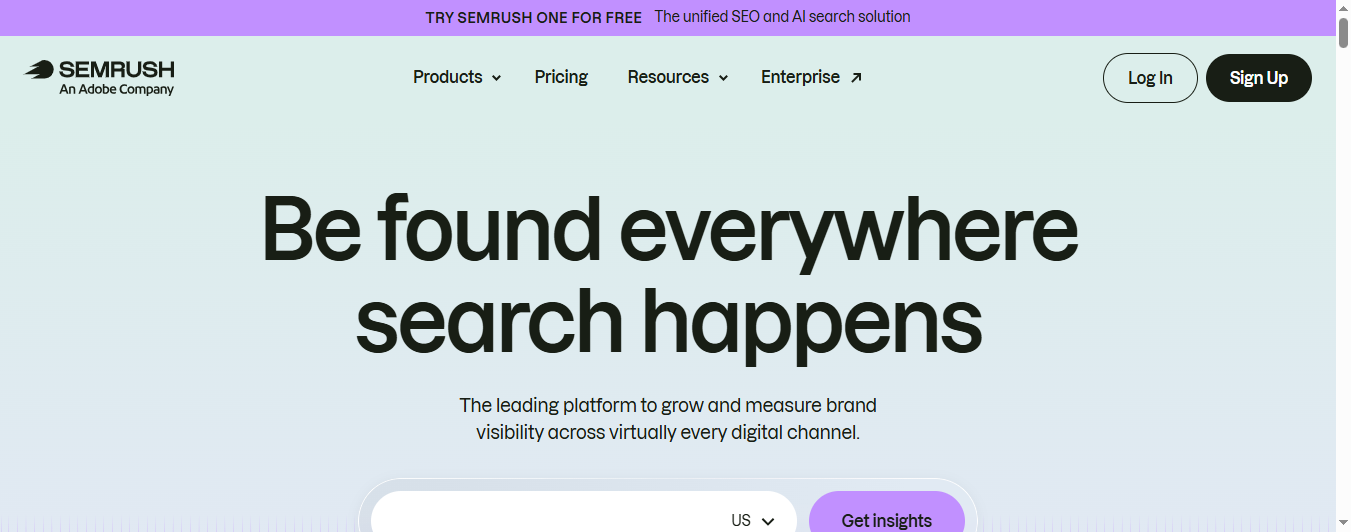
8. Semrush My Reports
Semrush is best known for SEO and search marketing, but its reporting features can help content teams package search visibility and content performance into recurring summaries.
Strengths
Strong SEO context for content reporting
Useful for keyword, ranking, and search visibility reporting
Good for teams where content performance is heavily tied to organic search
Less suited for full-funnel client reporting across every channel
Ideal use case
SEO-led content teams and agencies reporting heavily on search performance
Client-ready reporting and agency workflow picks
These tools are often preferred when reporting is part of client service delivery, not just internal analysis.
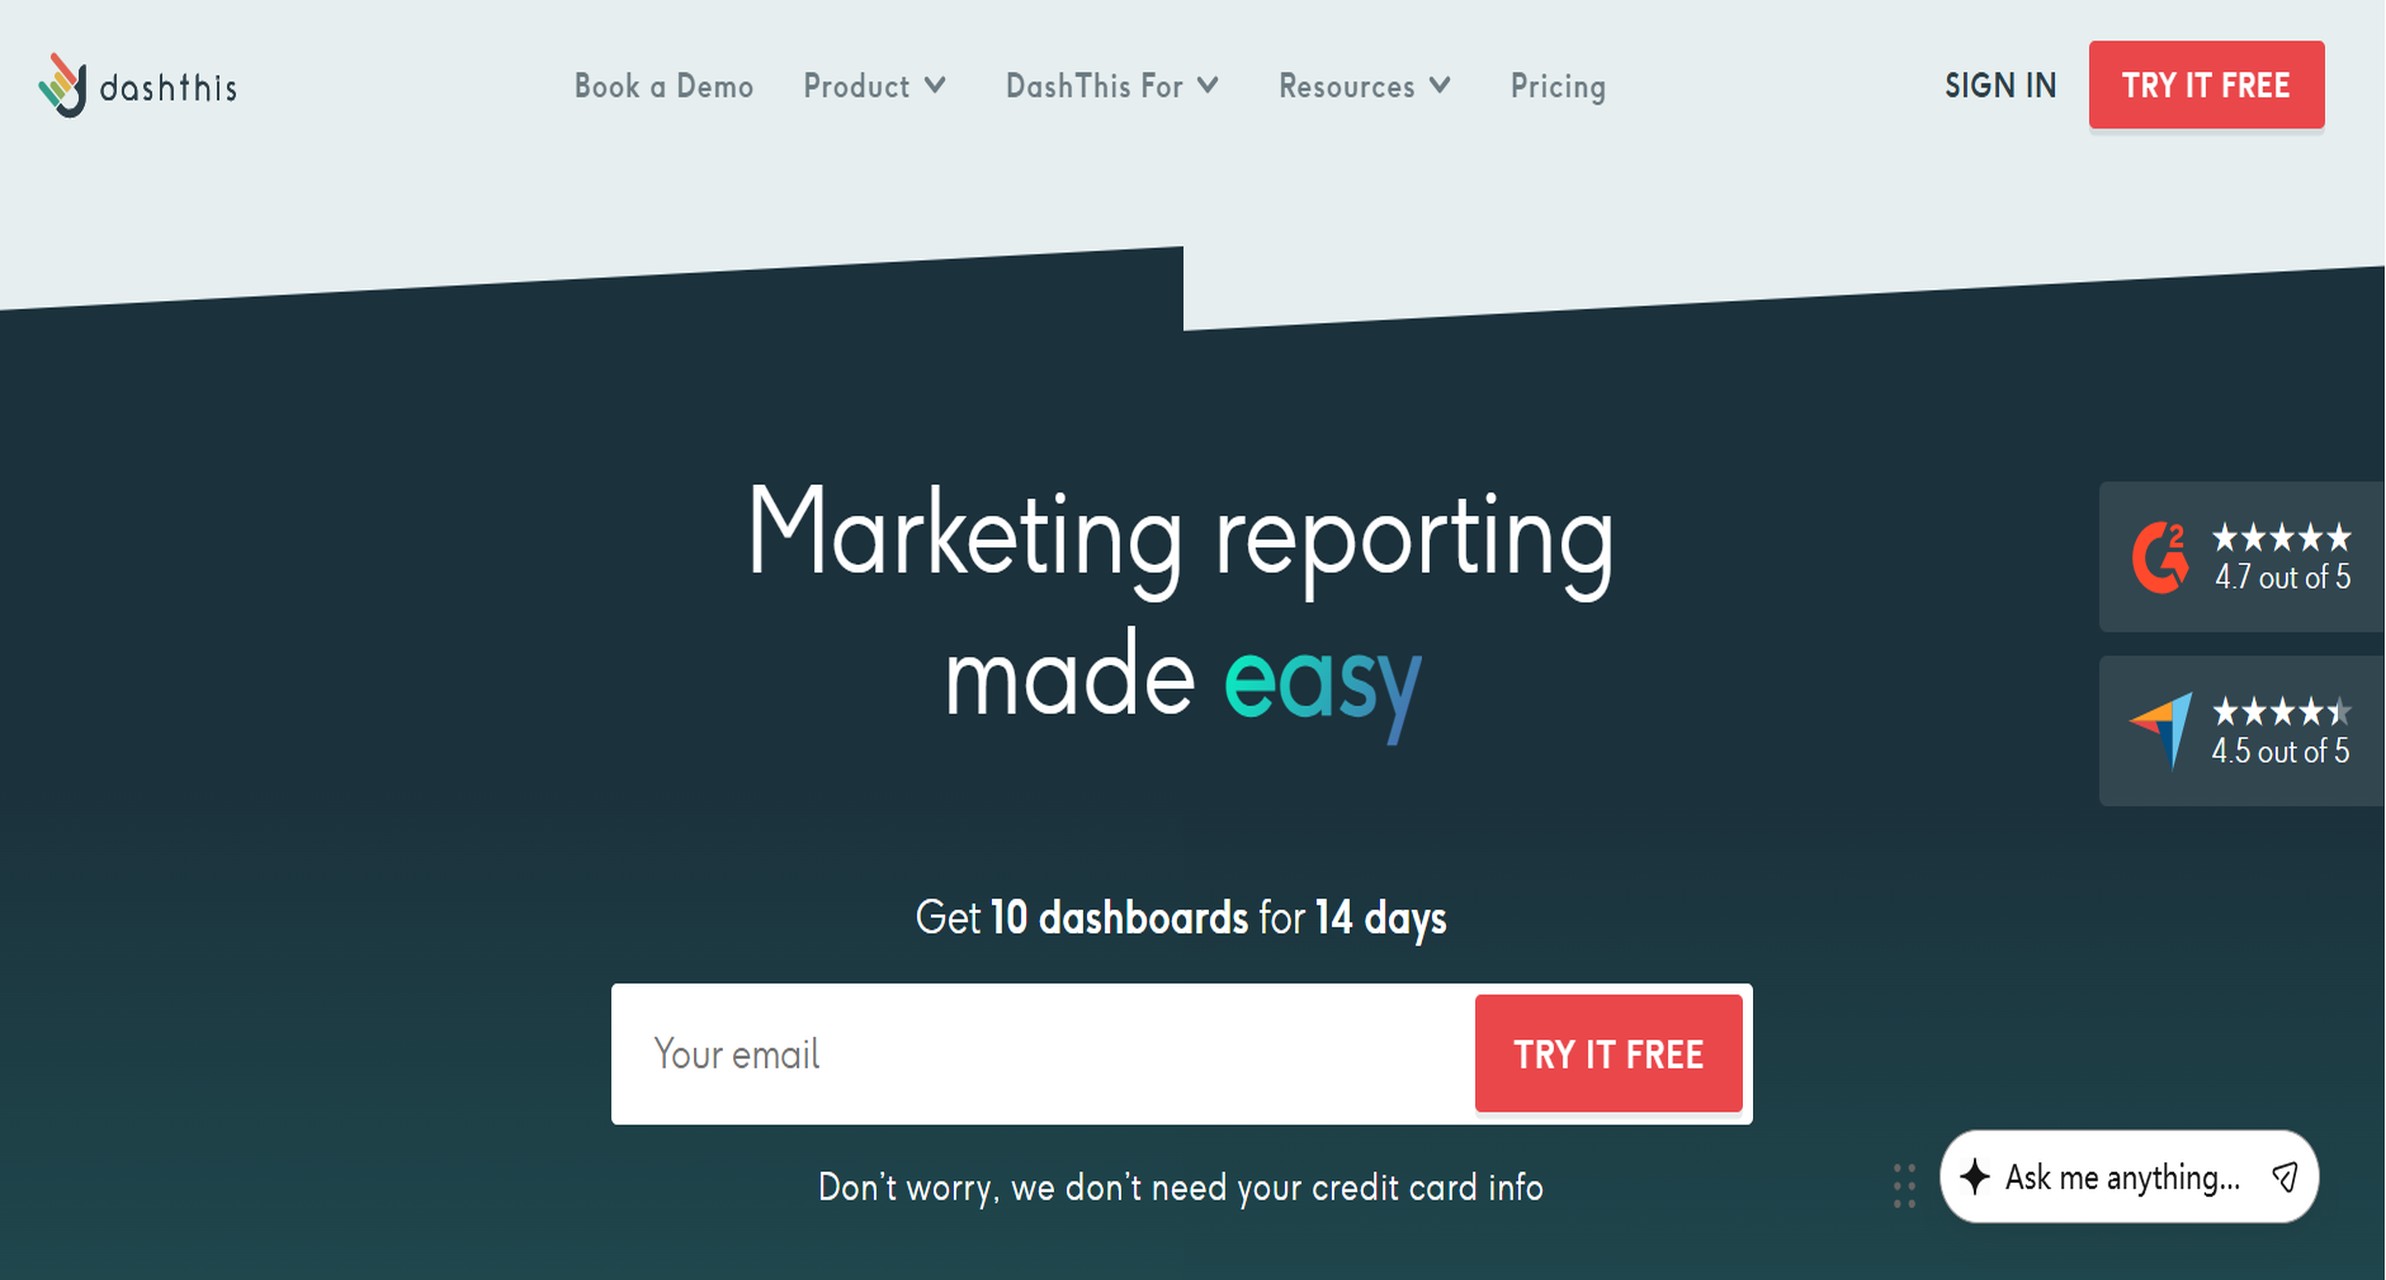
9. DashThis
DashThis is purpose-built for marketing reporting and is commonly associated with agency dashboards, white-label presentation, and recurring client updates.
Attribution sophistication varies by setup and source
May be more reporting-focused than analysis-heavy for advanced teams
Ideal use case
Agencies and growing marketing teams that need polished recurring reports with broad connector coverage
Best practices for content marketing reporting
Tools matter, but reporting quality usually depends on design discipline. Teams often fail not because the platform is weak, but because the report is overloaded, disconnected from business goals, or impossible to act on.
KPIs and templates that keep reports useful
The most useful content reports organize KPIs by funnel stage, channel, and decision-maker.
Top-of-funnel metrics
Organic sessions
New users
Impressions
Social reach
Content engagement rate
Mid-funnel metrics
Engaged sessions
Newsletter sign-ups
Content downloads
Return visitors
Scroll depth or on-page engagement
Bottom-of-funnel metrics
Marketing qualified leads
Demo requests
Assisted conversions
Pipeline contribution
Revenue influence where available
Templates should also reflect the audience:
Executives want concise trends, contribution, and exceptions
Content managers need page, topic, and author-level detail
Agencies and clients need business outcomes, benchmarks, and plain-language summaries
Building automated dashboards that stakeholders will actually use
Automation improves reporting only if the output is readable and relevant.
Best practices include:
Set a clear report cadence. Weekly dashboards and monthly summaries usually serve different purposes.
How marketing analytics software improves reporting quality
Marketing analytics software improves reporting quality in three practical ways:
It reduces manual collection work, which lowers reporting delays and copy-paste errors.
It standardizes recurring templates, so different teams and clients see consistent definitions and layouts.
It makes deeper pattern detection easier, especially when content performance must be connected to funnel progression or channel contribution.
This is especially important when reporting becomes a recurring operational process rather than an occasional presentation task.
Which tool is right for your team?
The right platform depends on who consumes the report, how formal the reporting process is, and how much complexity your team can realistically support.
Best choices for small teams, growing agencies, and enterprise marketing operations
For small teams
Looker Studio or Databox can work well when speed and simplicity matter most.
GA4 can support analysis, but many teams still need another layer for presentation.
For growing agencies
DashThis and Whatagraph are often strong fits for repeatable client reporting, branded delivery, and multi-account workflows.
Tableau and Power BI are strong when marketing reporting sits inside broader BI initiatives.
FineReport is a practical option when teams need not only dashboards but also formal, scheduled, printable, parameterized reports for management, operations, or external distribution.
Key trade-offs to weigh before committing
Before choosing a tool, weigh these trade-offs carefully:
Speed vs depth: Lightweight dashboard tools are faster, but may be weaker for complex reporting logic.
Visualization vs formal reporting: Beautiful dashboards do not always replace scheduled, printable, stakeholder-ready reports.
Marketing specificity vs enterprise flexibility: Marketing tools can be easier to start with, while enterprise platforms often support more standardized scale.
Attribution sophistication vs usability: The more advanced the attribution model, the more setup and interpretation effort may be required.
Final comparison checklist for selecting the right platform
When FineReport is a good fit for content marketing reporting
Tools like Tableau and Power BI are widely used for visualization and BI analysis, while platforms like DashThis and Whatagraph are often chosen for fast marketing dashboards and agency reporting. But teams with more complex reporting workflows may also need a dedicated enterprise reporting platform like FineReport.
Monthly executive marketing packs with consistent formatting
Channel and content performance reports that must be printable and presentation-ready
Parameter-driven reports by business unit, region, client, or campaign
Automated scheduled distribution to leadership, managers, or external stakeholders
Combined dashboard and detailed report experiences in one reporting environment
Cross-functional reporting where marketing data needs to sit alongside sales, operations, or finance reporting
For organizations that care about pixel-perfect reports, paginated layouts, and controlled report delivery, FineReport fills a different role than dashboard-only tools. It can help marketing operations teams standardize reporting across departments, and it can help agencies that need more structured recurring deliverables than a dashboard alone provides.
Get Ready-to-Use Dashboard and Report Templates in Fine Gallery
If your team needs both dashboard visibility and formal recurring reporting, FineReport is worth evaluating alongside traditional BI and marketing dashboard platforms.
Focus on dashboard flexibility, data integrations, attribution support, automation, and easy sharing. The best fit depends on whether you need executive visibility, client-ready reports, or deeper performance analysis across channels.
They connect content performance data with conversions, leads, or pipeline outcomes so you can see influence beyond pageviews. More advanced tools support first-touch, multi-touch, or conversion-path reporting.
Yes, especially for agencies managing multiple clients and recurring reports. Tools with reusable templates, white-label options, and scheduled delivery can save significant time and improve client communication.
Many can, but connector depth varies by platform. Before choosing a tool, confirm it supports the sources your team actually uses, such as GA4, Search Console, paid media platforms, social channels, and CRM systems.
Dashboard tools are mainly designed for live monitoring and quick performance checks. Reporting tools usually add scheduled delivery, branded exports, templates, and more structured presentation for stakeholders or clients.
Product Trial
FineReport
Pixel-perfect reports · Interactive dashboards · Easy data entry · Digital twins




 DashThis is purpose-built for