CRM reporting is how revenue leaders turn scattered pipeline updates, rep activity, and stage changes into decisions that protect the quarter. If you lead sales, revenue operations, or forecasting, the problem is familiar: the pipeline looks large enough on paper, the forecast feels defensible in meetings, and then late-stage deals slip, conversion assumptions break, and the quarter misses anyway. Strong CRM reporting surfaces those risks early enough to act. It gives leaders a reliable inspection system for pipeline quality, forecast confidence, and execution gaps before they become revenue shortfalls.
 Click To Try The Dashboard
All reports in this article are built with FineReport
CRM reporting for revenue leaders: what it reveals before pipeline risk turns into a missed quarter
For revenue leaders, CRM reporting is not just a way to visualize deal data. It is the operating layer behind weekly inspections, monthly forecasting, and quarterly planning. Done well, it shows whether the current pipeline can realistically support the target, where deals are slowing down, which segments are underperforming, and how much of the forecast is built on fragile assumptions.
Raw CRM data alone does not answer those questions. Activity counts, opportunity stages, and close dates are only useful when reporting converts them into patterns. The real value comes from identifying early warning signals such as declining conversion rates, aging late-stage opportunities, weak new pipeline creation, and recurring commit slippage.
A useful way to think about CRM reporting is this:
- Dashboards show visibility
- Reports support decisions
- Reporting rhythms drive action
A dashboard might tell you there is $12 million in pipeline. Decision-ready reporting tells you whether that pipeline has enough coverage, how much is stale, which segments are dragging win rate down, and how much of the commit has slipped in the last three weeks.
Core elements of decision-ready CRM reporting
To make CRM reporting effective for revenue leadership, the reporting system should include these core elements:
- Pipeline sufficiency: Measures whether current opportunity value supports quota and commit targets.
- Conversion integrity: Shows how reliably opportunities progress from one stage to the next.
- Speed and momentum: Tracks whether deals are moving fast enough to close in-period.
- Forecast reliability: Compares predicted outcomes with actual results to expose bias.
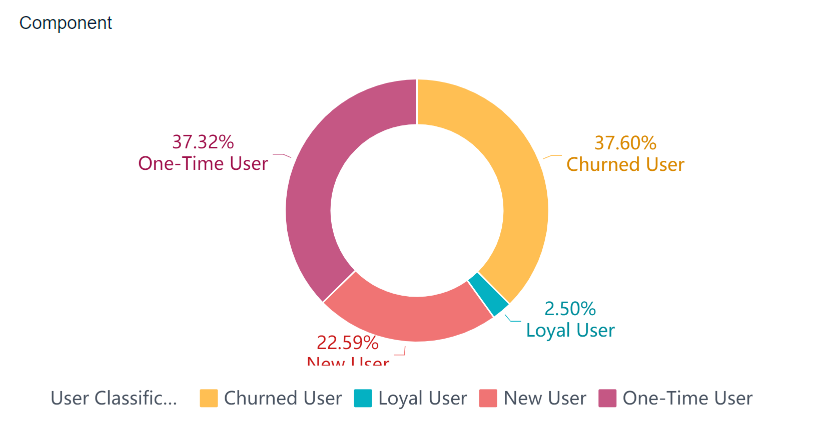
- Segment performance: Breaks results down by region, source, ICP fit, product, or team.
- Data quality: Ensures leadership decisions are based on current, complete, and disciplined CRM inputs.
Key Metrics (KPIs)
Below are the essential KPI categories every revenue leader should define in their CRM reporting framework:
- Pipeline Coverage Ratio: Total qualified pipeline divided by quota or commit target.
- Stage-to-Stage Conversion Rate: Percentage of opportunities advancing between sales stages.
- Pipeline Velocity: Speed at which opportunities move through the pipeline toward close.
- Deal Aging by Stage: Average time opportunities remain in each stage.
- Win Rate by Segment: Closed-won percentage across key business segments.
- New Pipeline Creation Rate: Value or count of new qualified opportunities created over time.
- Forecast Accuracy: Variance between predicted revenue and actual closed revenue.
- Commit Slippage Rate: Percentage of committed deals that move out of the current period.
- Average Sales Cycle Length: Time from opportunity creation to closed-won.
- Activity-to-Opportunity Effectiveness: Quality yield from calls, emails, and meetings.
- Late-Stage Pipeline Concentration: Dependence on a small set of large or late deals.
- Pipeline Hygiene Score: Composite measure of CRM completeness, freshness, and stage discipline.
The 12 KPIs that expose pipeline risk early
1. Pipeline coverage ratio
Pipeline coverage ratio compares your current qualified pipeline against quota or committed revenue targets. This is the first pressure test of whether your team has enough in-flight demand to hit the number without heroic conversion assumptions.
If coverage is too low, every downstream metric has to perform above historical norms. That creates hidden forecast fragility. A team with thin coverage is often forced to overtrust late-stage deals, stretch close dates, or assume unusually strong win rates.
A practical interpretation:
- Healthy coverage supports forecast confidence
- Borderline coverage requires stronger qualification and inspection
- Low coverage signals likely pressure on conversion and close timing
2. Stage-to-stage conversion rate
Stage-to-stage conversion rate shows where opportunities move forward, stall, regress, or disappear. This is one of the most diagnostic CRM reporting metrics because it reveals structural weakness in the funnel, not just individual rep performance.
When conversion drops between specific stages, the issue is often systemic. Qualification criteria may be loose. Discovery may be shallow. Pricing friction may be unresolved. Procurement may be entering too late.
Revenue leaders should watch for:
- Sudden conversion declines in one stage transition
- Conversion weakness concentrated in one segment or source
- High rep activity with no corresponding stage progression
3. Pipeline velocity
Pipeline velocity measures how quickly qualified opportunities move toward close. It is a direct indicator of sales motion efficiency and quarter readiness.
When velocity slows, it usually points to one of three issues: weaker qualification, more buyer-side friction, or internal delays in advancing deals. Slow velocity is especially dangerous when leadership is relying on late-stage pipeline to save the quarter.

Velocity reporting helps answer:
- Are qualified deals moving fast enough to close this quarter?
- Which teams or segments are slowing down?
- Is the issue recent or part of a longer trend?
4. Deal aging by stage
Deal aging by stage tracks how long opportunities remain in each stage relative to historical norms. This KPI is critical because pipeline often looks healthier than it is when stale deals remain parked in late stages.
A deal in proposal or negotiation may look forecastable, but if it has sat there far longer than typical closed-won deals, the risk is materially higher. CRM reporting should highlight these aging exceptions automatically.
Good leadership practice is to compare:
- Current aging versus historical won-deal aging
- Aging by rep and manager
- Aging by stage and segment
- Aging alongside next-step quality and close-date movement
5. Win rate by segment
Overall win rate can hide risk if it averages together strong and weak segments. Win rate by segment gives a more useful view by breaking performance down across ICP fit, deal size, region, industry, lead source, or product line.
This helps leaders identify whether the business is winning where it matters most. If enterprise win rates are weakening while SMB performance remains strong, the topline average may look acceptable while strategic revenue is at risk.
Use this KPI to spot:
- Segment-specific deterioration
- Misalignment between targeting and results
- Source quality issues masked by total pipeline volume
6. New pipeline creation rate
New pipeline creation rate measures whether fresh qualified opportunities are entering the funnel fast enough to support upcoming periods. This is a leading indicator of future quarter confidence.
Many teams focus too heavily on current late-stage deals and under-monitor the creation engine. That creates a dangerous pattern where the current quarter becomes salvage mode and the next quarter starts undercovered.
Strong CRM reporting connects new pipeline creation to:
- Future coverage requirements
- Source efficiency
- Segment strategy
- Rep sourcing effectiveness
- Marketing and outbound contribution
7. Forecast accuracy
Forecast accuracy compares rep, manager, and executive forecasts against actual results. It is one of the clearest indicators of reporting discipline and inspection quality.
If forecasts consistently miss high, the issue may be optimism bias, weak stage exit criteria, or poor challenge discipline in forecast calls. If they miss low, leadership may be underestimating upside or failing to capture momentum quickly enough.
This KPI should be reviewed by:
- Individual rep
- Frontline manager
- Team
- Segment
- Forecast category
8. Commit slippage rate
Commit slippage rate tracks how often committed deals move out of the current reporting period. This is one of the fastest ways to test whether the commit is real or aspirational.
A rising slippage rate tells leaders that late-stage confidence is overstated. It also often indicates a breakdown in close-date integrity, rep judgment, or manager inspection rigor.
When slippage increases, inspect:
- Deal age
- Close-date changes
- Missing mutual action plans
- Procurement or legal delays
- Rep history of commit accuracy
9. Average sales cycle length
Average sales cycle length shows whether deal timelines are extending across the business. Longer cycles reduce forecast reliability and increase quarter-end compression risk.
Cycle expansion matters most when it appears inside high-value segments or during periods of lower pipeline creation. In those cases, even healthy pipeline totals may not convert in time.
![]()
This metric is most useful when segmented by:
- Deal size
- Region
- Product
- ICP fit
- Lead source
- New business versus expansion
10. Activity-to-opportunity effectiveness
Activity-to-opportunity effectiveness evaluates whether sales activity is creating quality pipeline, not just volume. This protects leaders from rewarding effort metrics that are disconnected from outcomes.
A team can increase calls, emails, and meetings while pipeline quality still deteriorates. The right CRM reporting connects activity inputs to opportunity creation, qualification rate, and downstream win performance.
Watch for patterns like:
- Rising activity with flat opportunity creation
- Meeting volume without qualified pipeline growth
- Strong opportunity creation from specific activity types or channels
11. Late-stage pipeline concentration
Late-stage pipeline concentration measures how dependent the quarter is on a small number of large or supposedly near-close deals. This is a classic hidden risk in enterprise sales.
A late-stage pipeline can look impressive while actually being fragile. If a few deals represent a disproportionate share of expected revenue, one delayed decision can materially derail attainment.
CRM reporting should quantify:
- Share of commit tied to top 5 or top 10 deals
- Concentration by rep or segment
- Exposure to single-account dependence
- Concentration alongside aging and slippage
12. Pipeline hygiene score
Pipeline hygiene score evaluates the quality of the CRM data itself. It can include completeness of required fields, freshness of updates, next-step quality, close-date realism, and stage discipline.
This KPI matters because poor CRM reporting usually starts with poor CRM behavior. When data is stale or inconsistent, leadership cannot distinguish true execution risk from reporting noise.
A strong hygiene score typically assesses:
- Required fields completed
- Opportunity updated within a defined time window
- Next step documented and dated
- Close date aligned to stage reality
- Stage progression following agreed exit criteria
Must-have CRM reports that bring these KPIs into focus
Executive forecast and risk dashboard
This report should combine coverage, slippage, forecast accuracy, and late-stage concentration into one leadership view. The goal is not just to summarize the quarter but to highlight where forecast confidence is deteriorating.
Best practice is to build this report with drill-down capability by team, manager, region, and segment so leaders can move from summary risk to root cause quickly.
Funnel conversion and stage aging report
This report pairs conversion rates with aging data to show exactly where momentum breaks down. A conversion chart alone can miss stale opportunities. Aging alone can miss a structural drop in advancement. Together, they expose friction far earlier.
This report is especially useful in weekly inspection meetings because it supports precise interventions:
- Tighten qualification
- Improve stage exit criteria
- Escalate blocked deals
- Coach specific stage behaviors
Pipeline creation by source, segment, and owner
This report shows whether new pipeline is sufficient and strategically aligned. It answers two leadership questions at once: are we creating enough pipeline, and are we creating the right kind?
It should include:
- New pipeline value
- Opportunity count
- Qualified pipeline rate
- Source mix
- Segment mix
- Contribution by owner or team
Rep inspection and data quality report
This report supports frontline management by surfacing stale opportunities, missing fields, weak next steps, and questionable close dates before forecast reviews happen.
This is where CRM reporting shifts from executive visibility to execution control. If managers use this report consistently, forecast quality improves because data discipline improves first.
Why CRM reporting matters and how to do it right
CRM reporting matters because revenue leadership is fundamentally a decision-timing problem. You do not need more data after the quarter is lost. You need the right signals while there is still time to intervene.
To make reporting work in practice, tie it directly to operating rhythms:
- Weekly inspection for pipeline movement, slippage, aging, and hygiene
- Monthly forecasting for coverage, commit confidence, and forecast accuracy
- Quarterly planning for segment performance, pipeline generation trends, and capacity assumptions
As a seasoned operator, I recommend these best practices:
1. Standardize stage definitions and exit criteria
If stage entry and exit rules vary by team or manager, your trend lines are not trustworthy. Define what qualifies a deal for each stage, what evidence is required, and what conditions force it back.
2. Separate leading indicators from lagging indicators
Do not rely only on closed revenue, attainment, and headline win rate. Pair those lagging indicators with leading measures such as new pipeline creation, aging, slippage, and stage conversion shifts.
3. Review trends, not one-week anomalies
A single weak week may be noise. A four-week pattern in aging, coverage, or conversion is usually signal. Train your team to inspect momentum over time rather than react emotionally to every short-term fluctuation.
4. Assign ownership for metric definitions and report maintenance
Revenue operations should own report logic and definitions. Frontline managers should own inspection and follow-up. Revenue leaders should own escalation and action. Reporting without ownership turns into passive observation.
5. Build reports that trigger action
Every report should answer: what decision changes if this metric moves? If the report does not inform coaching, prioritization, risk escalation, or resource allocation, simplify it.
Common mistakes revenue leaders should avoid
Mistaking pipeline size for pipeline health
A large pipeline total can conceal low conversion quality, inflated close dates, and stale late-stage deals. Size alone is not strength. Health depends on movement, quality, timing, and segment mix.
Treating all opportunities as equally likely to close
Opportunities should not carry equal weight. Segment performance, stage behavior, age, and source quality all affect close probability. Uniform assumptions create forecast distortion.
Relying on lagging indicators alone
Closed revenue tells you what already happened. By the time attainment drops, the recovery window may be gone. Leading indicators are what allow revenue leaders to intervene early.
Ignoring adoption and data discipline
Even excellent CRM reporting fails when reps do not update records, managers skip inspection, or stage discipline breaks down. Reporting quality is inseparable from operating discipline.
How to build a practical CRM reporting rhythm for your team
Start with a focused KPI set tied to forecast confidence and pipeline quality. Most teams do not need dozens of reports on day one. They need a small set of trusted views that become part of management cadence.
A practical rollout looks like this:
- Start with core KPIs: coverage, conversion, velocity, aging, slippage, forecast accuracy, and hygiene
- Define clear ownership: revenue ops for logic, managers for inspection, leadership for action
- Set cadence by purpose: weekly for pipeline risk, monthly for forecast quality, quarterly for strategic planning
- Compare trends over time: use rolling views and historical baselines
- Refine as the sales motion evolves: update segmentation, criteria, and benchmarks as territories, products, and team structures change
Building this manually is complex; use FineReport to utilize ready-made templates and automate this entire workflow
Building enterprise-grade CRM reporting manually is difficult. You need stable data models, consistent KPI definitions, automated refreshes, role-based dashboards, alert logic, and enough flexibility to support both executive forecasting and frontline inspection. Most teams try to patch this together with exports and spreadsheets, then lose trust in the numbers.
FineReport simplifies that entire workflow. You can use ready-made templates, connect CRM and business data sources, standardize KPI logic, automate report distribution, and build drill-down dashboards for executives, managers, and revenue operations. Instead of spending cycles assembling reports, your team can spend time acting on them.

Get Ready-to-Use Dashboard Templates in Fine Gallery
FineReport is especially valuable when you need to:
- Unify CRM reporting across teams and regions
- Automate forecast and inspection dashboards
- Standardize KPI calculations across leadership levels
- Improve data visibility without adding spreadsheet overhead
- Scale reporting as sales motions and structures become more complex
If your current CRM reporting still depends on manual compilation, disconnected dashboards, or inconsistent definitions, that complexity is already costing forecast confidence.
FAQs
CRM reporting turns CRM data into dashboards and reports that show pipeline health, forecast reliability, and execution risk. For revenue leaders, its main purpose is to spot issues early enough to protect the quarter.
The most important KPIs are pipeline coverage, stage-to-stage conversion, pipeline velocity, deal aging, forecast accuracy, commit slippage, and new pipeline creation. Together, they show whether pipeline volume, quality, and timing are strong enough to support the target.
Most revenue teams should review key CRM reports weekly for pipeline inspection and monthly for forecasting and planning. High-risk metrics like late-stage slippage, stage aging, and pipeline creation often need even closer monitoring near quarter end.
A CRM dashboard gives a quick visual snapshot of current performance, while a CRM report provides deeper analysis for decisions and trend review. Dashboards support visibility, but reports help leaders understand why targets are at risk.
Better CRM reporting improves forecast accuracy by comparing predicted revenue with actual outcomes and exposing weak assumptions. It also highlights stale deals, conversion drops, and commit slippage before they distort the forecast.


The Author
Yida Yin
FanRuan Industry Solutions Expert
Related Articles
Automated Financial Reporting: Step-by-Step Month-End Close Workflow That Saves Time
Month end close breaks down when finance teams are forced to chase files, reconcile inconsistent data, and rebuild reports by hand every cycle. Automated $1 solves that by connecting source systems, standardizing rules,
Eric
Jan 01, 1970

Automated Financial Reporting: Step-by-Step Month-End Close Workflow That Saves Time
Month end close breaks down when finance teams are forced to chase files, reconcile inconsistent data, and rebuild reports by hand every cycle. Automated $1 solves that by connecting source systems, standardizing rules,
Yida Yin
Jun 18, 2026
Reporting Software Tools Compared: FineReport vs Power BI vs Tableau vs Looker Studio for Custom Enterprise Reporting
$1 is an $1 platform built for highly customized, pixel perfect reports, forms, dashboards, and scheduled distribution at scale. Reporting software tools at a glance for custom enterprise reporting When enterprises compa
Yida Yin
Jun 18, 2026