Database reporting is not just about pulling data into a dashboard. It is an architecture decision that affects application performance, reporting speed, data trust, and how confidently your teams can make decisions. If you are an IT manager, data lead, or operations director, the real question is simple: should reports run directly on your operational database, or should you separate reporting into its own database layer? Get this wrong, and you risk slow apps, unhappy users, inconsistent metrics, and fragile reporting workflows.
 Click To Try The Dashboard
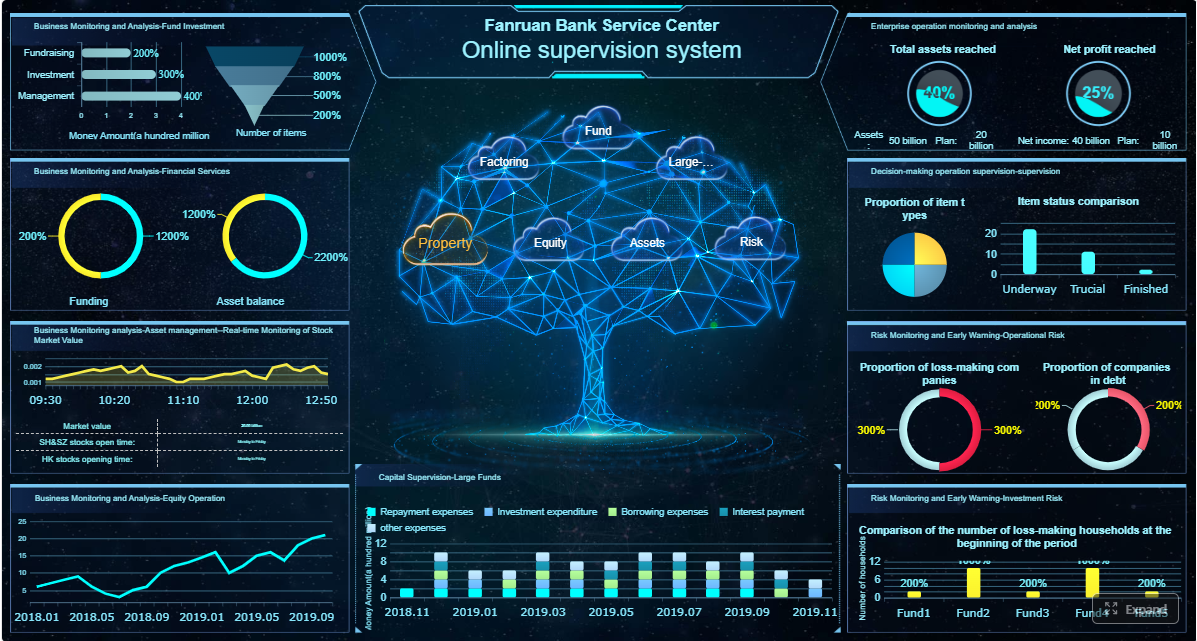
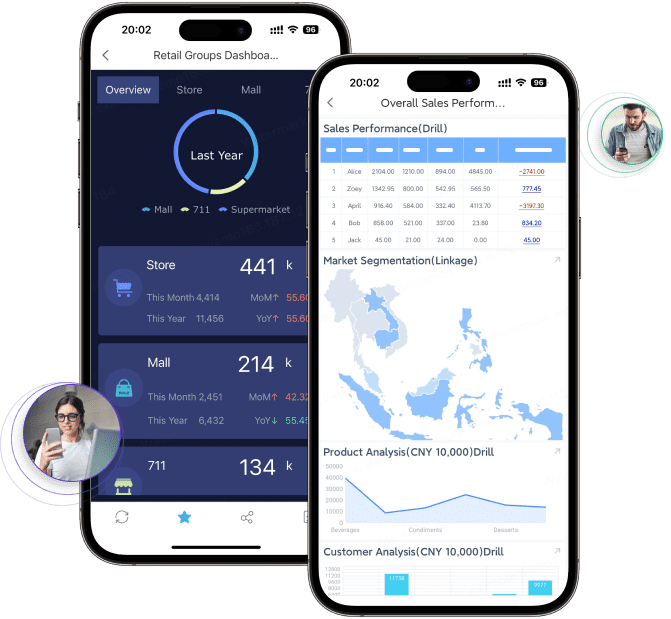
All reports in this article are built with FineReport
What database reporting is and why architecture matters
Database reporting is the process of querying business data stored in databases and turning it into usable outputs such as dashboards, exports, scheduled reports, and ad hoc analysis. In practice, it means answering operational and strategic questions from systems like ERP, CRM, finance, supply chain, HR, and custom applications.
The challenge is that reporting workloads behave very differently from transactional workloads. Transactional systems are optimized for fast inserts, updates, and point lookups. Reporting workloads often require wide scans, joins across multiple tables, aggregations, trend analysis, and many simultaneous readers.
That difference is why architecture matters. The core decision in database reporting is whether to:
- Query the operational system directly
- Use a separate reporting database
- Expand further into a warehouse or governed BI stack
Each option changes the balance between freshness, cost, complexity, performance, and governance.
Key Metrics (KPIs) for database reporting architecture
When evaluating database reporting design, focus on these core metrics:
- Data Freshness: How current the report data must be, from real-time to daily batch.
- Query Response Time: How quickly reports, dashboards, or exports must load.
- User Concurrency: The number of users or processes running reports at the same time.
- Workload Complexity: The level of joins, aggregations, trend calculations, and derived metrics required.
- System Impact: The degree to which reporting degrades production application performance.
- Data Volume: The total amount of queried data and its projected growth rate.
- Governance Readiness: The ability to control access, define shared metrics, and maintain trusted outputs.
- Auditability: Whether reports must support traceability, version control, or compliance reviews.
- Operational Stability: How predictable performance remains during business hours and peak usage.
- Cost to Maintain: Infrastructure, engineering effort, and tool overhead needed to keep reporting reliable.
Business impact follows directly from these metrics. If response times are unstable, executives stop trusting dashboards. If reporting slows the production app, operations teams escalate immediately. If governance is weak, every department builds a different version of the truth.
When to query your operational system for reports
Direct reporting from your operational database is acceptable when the environment is still small, simple, and tightly controlled. This approach works best when there is modest data volume, straightforward queries, and limited demand from users.
Typical situations where this is reasonable include:
- A small internal application with a few tables and predictable usage
- Basic operational reports such as order lists, daily exceptions, or current status views
- Few concurrent users running reports
- Minimal need for historical trending or cross-functional analytics
- Strong indexing and query design already in place

The main advantages are clear:
- Lower cost: No extra database environment or pipeline to manage
- Fewer moving parts: Less synchronization logic, fewer failure points
- Real-time access: Reports reflect the latest committed records
- Faster implementation: Teams can build quickly without standing up additional infrastructure
For early-stage systems, this can be the right answer. Many organizations overengineer too soon. If reporting is lightweight and controlled, using the operational system can be efficient.
The risk is that reporting rarely stays lightweight for long. As more people want dashboards, exports, and trend analysis, direct reporting starts competing with application workloads. That is when performance issues surface.
Common risks include:
- Slower application response during report execution
- Lock contention or resource contention between reads and writes
- Unstable report response times during peak business hours
- Poor support for historical analysis if the schema is optimized only for transactions
- Limited governance when each report author writes custom SQL against live tables
Signs your operational database is no longer enough
When these signs appear, the operational database has likely outgrown direct reporting:
- Frequent slowdowns during business hours
- Growing demand for dashboards, exports, and ad hoc analysis
- Complex joins, aggregations, or historical trend reporting becoming common
You may also notice secondary symptoms such as rising infrastructure costs, emergency indexing changes to satisfy one report, or tension between engineering teams and business users over database access.
When a reporting database is the better choice
A reporting database is a separate database environment designed specifically for analytics, dashboards, recurring reports, and decision support. It copies essential data from operational systems and structures that data for read-heavy use cases instead of transactional efficiency.
This separation is the core strength of a reporting database. It allows day-to-day business transactions to continue without being disrupted by analytical queries.
A reporting database is typically the better choice when you need:
- Executive dashboards with fast and consistent performance
- Historical trend analysis across months or years
- Department-wide recurring reports
- Self-service BI for nontechnical users
- Controlled access to curated datasets and shared definitions
This model works because it decouples two fundamentally different jobs:
- The operational system handles writes, updates, and transactions
- The reporting system handles reads, aggregations, and analysis
Data can be kept current through several methods:
- Read replicas: Good for offloading many read queries when schema changes are minimal
- Scheduled loads: Useful for hourly, nightly, or periodic refresh requirements
- ELT pipelines: Better for transforming and reshaping data for analytical use
- Change data capture or streaming replication: Useful for near-real-time reporting needs
The right synchronization pattern depends on how fresh the data needs to be and how much complexity your team can support.
The reporting database pattern in practice
In practice, a reporting database improves database reporting in three important ways.
1. Separate read-heavy reporting queries from write-heavy operational activity
This is the most immediate benefit. Large dashboard queries no longer compete with inserts, updates, and user transactions. Production systems remain stable, while reports become more predictable.
2. Reshape schemas for analytics
Operational schemas are often highly normalized. That is excellent for transactions, but inconvenient for reporting. A reporting database can use:
- Summary tables
- Denormalized report tables
- Star schemas
- Materialized views
- Derived metrics stored for fast reuse

This makes report development faster and often cuts query runtime dramatically.
3. Improve governance with controlled access
A reporting database creates a managed layer for trusted analysis. Instead of giving broad access to production tables, teams can expose:
- Curated report-ready datasets
- Standard KPI definitions
- Row-level or role-based permissions
- Auditable refresh logic
- Consistent naming and business semantics
That governance layer becomes essential once reporting expands beyond a few technical users.
How to choose the right reporting architecture
The right database reporting architecture depends on tradeoffs, not ideology. The goal is not to choose the most advanced stack. The goal is to match architecture to business need.
The most important decision factors are:
- Data freshness: Do users need current-second visibility, near-real-time updates, or daily reporting?
- Query complexity: Are reports simple filters, or do they require multi-table joins, trends, and pre-calculated KPIs?
- User concurrency: How many people or systems will query reports at once?
- Compliance and security: Do you need strict access controls, audit logs, and governed metric definitions?
- Budget: Can you support extra infrastructure and data pipelines?
- Team skills: Does your team know replication, modeling, ELT, and BI governance?
A simple framework works well for most organizations.
Small teams
If you have low data volume, simple reporting, and only a handful of users, querying the operational database may be enough. Keep reporting lightweight, optimize indexes, and monitor performance closely.
Mid-sized systems
If reporting demand is growing, dashboards are becoming common, and business-hour performance matters, move to a reporting database. This is often the best balance of performance, control, and implementation effort.
Data-intensive organizations
If you support many users, cross-functional analytics, historical modeling, or strict governance, a broader BI stack is usually the better path. That may include a reporting database, semantic modeling, governed dashboards, and potentially a cloud warehouse or analytical store.
The biggest tradeoff is freshness versus complexity:
- Real-time reporting: Best when users truly need current records, but more difficult and expensive to maintain at scale
- Near-real-time replication: A strong middle ground for many operational dashboards
- Scheduled batch updates: Often the most reliable and cost-effective for recurring business reporting
Questions to ask before deciding
Before you commit to an architecture, ask these questions:
- How much data is being queried and how quickly is it growing?
- Who needs reports, how often, and with what performance expectations?
- What level of consistency, security, and auditability is required?
If your answers point toward rising concurrency, growing historical analysis, and stricter governance, do not keep stretching your production database beyond its design limits.
Tools, databases, and implementation options to consider
There is no single best stack for database reporting. The right tools depend on reporting style, latency needs, and team maturity.
Common reporting database options include:
- Relational replicas: Good for offloading operational reports with minimal schema change
- Separate relational reporting databases: Useful when you need curated tables, summaries, and controlled access
- Cloud data warehouses: Ideal for scalable analytics, wide data integration, and historical analysis
- Purpose-built analytical stores: Best for high-performance aggregations and large analytical workloads
The reporting layer should also match the reporting use case:
- SQL reporting layers: Strong for operational reports, parameterized queries, and scheduled exports
- Dashboard tools: Useful for KPIs, trend tracking, and visual monitoring
- Governed BI platforms: Best for shared metrics, permissions, semantic models, and self-service analytics
BI reporting tools support better decisions because they do more than visualize data. They help standardize definitions, control access, and reduce the chaos of disconnected spreadsheets and one-off SQL.
Practical techniques for large-scale reporting
If you are scaling database reporting, these are the best practices I recommend as a consultant:
1. Design around access patterns, not just source tables
Start with the questions users need answered. Then model tables, views, and summaries around those needs. Do not force dashboard queries to navigate a transactional schema if you already know the required dimensions and measures.
2. Offload heavy queries early
Use replicas, reporting databases, or warehouse syncs before reporting becomes a production incident. Once business users depend on reports, emergency architecture changes become expensive and disruptive.
3. Use performance techniques deliberately
Apply the right performance levers:
- Indexing for common filters and joins
- Partitioning for time-based datasets
- Pre-aggregations for repetitive KPI calculations
- Caching for popular dashboards
- Incremental data pipelines for efficient refreshes
4. Govern shared metrics centrally
Define revenue, margin, backlog, conversion, utilization, or inventory metrics once. Expose them consistently through a semantic or curated reporting layer. This avoids metric drift across departments.
5. Match tooling to reporting style
Choose tools based on user behavior:
- Scheduled operational reports for frontline teams
- Executive dashboards for leadership visibility
- Self-service analytics for analysts and business users
- Governed BI for enterprise-wide standardization
These practices reduce technical debt and improve trust in reporting output.
Common mistakes and a practical recommendation
The most common mistake in database reporting is running expensive analytical queries on production by default. It feels simple at first, but it creates hidden costs: application slowdowns, brittle SQL, poor scalability, and growing governance risk.
Other recurring mistakes include:
- Treating all reports as real-time when most can tolerate a refresh interval
- Exposing raw production tables directly to too many users
- Ignoring historical modeling until executives ask for trends
- Building each report independently without shared KPI logic
- Delaying architecture changes until performance problems become visible to the business
Architecture should evolve as reporting volume, complexity, and governance needs increase. What works for a small application will not support a company-wide reporting program.
A practical recommendation matrix looks like this:
- Use the operational system directly when data volume is low, queries are simple, user demand is limited, and real-time visibility matters.
- Use a reporting database when reporting is growing, dashboards and exports are frequent, historical analysis is needed, and production stability is a priority.
- Use a broader BI stack when reporting is enterprise-wide, definitions must be governed, multiple domains must be integrated, and self-service analytics is a strategic requirement.
Building this manually is complex; use FineReport to utilize ready-made templates and automate this entire workflow.

Get Ready-to-Use Dashboard Templates in Fine Gallery
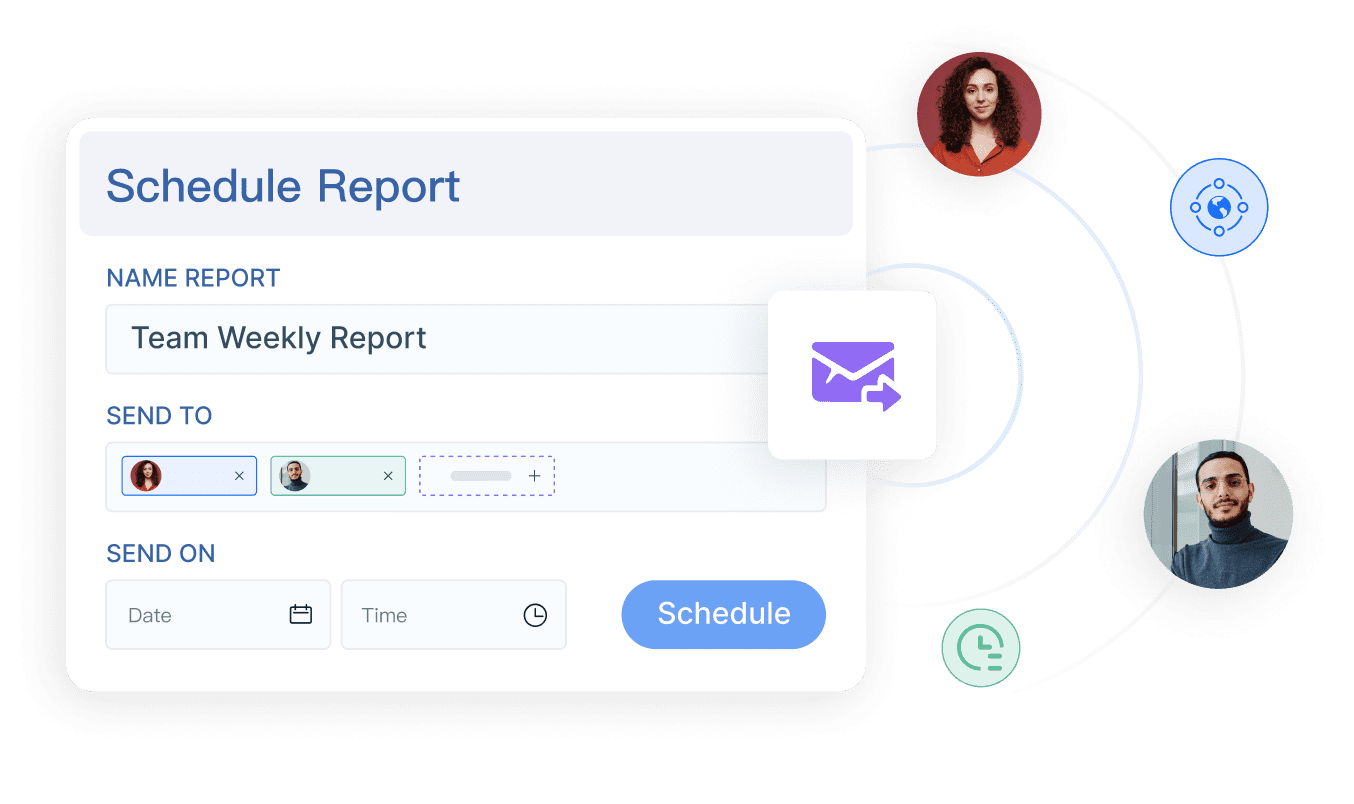
FineReport helps teams operationalize database reporting architecture faster by connecting to multiple data sources, building governed dashboards, distributing scheduled reports, and standardizing metrics across teams. Instead of hand-building every report pipeline and visualization from scratch, you can deploy report-ready workflows with stronger control and less engineering friction.
For most organizations, the best path is not theoretical purity. It is controlled evolution: start simple, separate reporting when load and complexity increase, and adopt governed BI when decision-making depends on scale and consistency.
FAQs
An operational database supports day-to-day transactions like inserts, updates, and quick lookups, while a reporting database is optimized for heavier queries, joins, and analysis. The reporting database is usually a separate copy or layer designed to protect production performance.
You should consider separating reporting when reports start slowing the application, user demand grows, or queries become more complex and historical. Frequent business-hour slowdowns and inconsistent report response times are common warning signs.
Not necessarily, but there is usually some tradeoff between freshness and stability. Many teams use scheduled replication or near-real-time sync so reports stay current without putting pressure on the operational system.
A separate reporting database improves application stability, supports more concurrent users, and makes complex reporting faster and easier to manage. It also helps with governance by creating a more controlled layer for trusted metrics and reporting logic.
A reporting database is often the better choice when you need to offload production reporting and support operational analytics quickly. A data warehouse is more appropriate when you need broader historical analysis, cross-department integration, and stronger governance at scale.


The Author
Yida Yin
FanRuan Industry Solutions Expert
Related Articles

ERP Reporting Explained: What It Is, How It Works, and Why Enterprise Teams Rely on It
ERP reporting is the process of turning data inside your enterprise resource planning system into usable business insight. For finance leaders, operations directors, supply chain managers, and IT teams, that matters beca
Yida Yin
Jun 25, 2026
8 Best Restaurant Reporting Software Tools for 2026: Compare FineReport, Toast, SpotOn & More
$1 is a highly customizable business intelligence and reporting platform that helps restaurants turn POS, labor, inventory, finance, and multi location data into real time dashboards and decision ready reports. 8 Best Re
Yida Yin
Jun 24, 2026

Data Warehouse Reporting Tools Compared: FineReport vs Power BI vs Tableau for Complex Enterprise Needs
$1 is an $1 and dashboard platform built for complex, highly formatted, data driven reporting on top of modern data warehouse environments. What to look for in data warehouse reporting tools for complex enterprise needs
Yida Yin
Jun 24, 2026