Manufacturing reporting is the discipline of turning shop floor activity into decisions that improve output, quality, labor efficiency, equipment reliability, and on-time delivery. For operations leaders, plant managers, and supervisors, the real challenge is not a lack of data. It is knowing which numbers matter today, which trends need weekly review, and which monthly scorecards should shape budget, staffing, and improvement priorities. Good manufacturing reporting closes that gap by converting raw production signals into clear, decision-ready information that teams can act on fast.
 Click To Try The Dashboard
All reports in this article are built with FineReport
What manufacturing reporting is and why it matters
Manufacturing reporting is the structured process of collecting, organizing, and presenting production data so leaders can run the plant with confidence. In practical terms, it helps answer the questions that matter every shift: Are we hitting plan? Where are we losing time? What quality issues are growing? Which orders are at risk? Where should we intervene now?
For operations teams, this is where business value becomes tangible. A well-built manufacturing reporting system helps reduce firefighting, speeds up escalation, aligns departments, and gives leaders a consistent view of plant performance. Instead of arguing over numbers, teams focus on action.
It is also important to separate three things that often get blurred together:
- Raw production data: machine states, operator entries, inspection results, maintenance logs, ERP transactions, and manual counts
- Dashboards: visual, often real-time displays that help teams monitor conditions and spot exceptions
- Decision-ready reports: structured summaries built for review, accountability, and follow-up at daily, weekly, or monthly cadence
A dashboard may show that Line 3 is down. A report should explain the impact on schedule attainment, the likely cause, the owner, and the recovery plan. That is the difference between visibility and management.
Key Metrics (KPIs) every manufacturing reporting system should include
Below is a core KPI set that most plants should define before building reports:
- Output: Total units produced in a given time period.
- Throughput: Rate at which products move through a process, line, or cell.
- Schedule attainment: Actual production versus planned production for the period.
- First-pass yield (FPY): Percentage of units produced correctly without rework.
- Defect rate: Share or count of products that fail quality standards.
- Scrap rate: Percentage of material or units discarded and not recoverable.
- Rework volume: Units requiring correction before release.
- Unplanned downtime: Production time lost due to breakdowns, shortages, or disruptions.
- Changeover time: Time required to switch from one product or batch to another.
- Labor utilization: Productive labor time compared with scheduled labor time.
- Work in process (WIP): Inventory currently in production but not yet complete.
- On-time delivery: Orders shipped by the committed date.
- Preventive maintenance completion: Percentage of planned maintenance tasks completed on time.
- Capacity utilization: Share of available production capacity actually used.
- Material yield: Usable output generated from consumed material.
- Overtime rate: Portion of labor hours worked beyond standard time.
- Energy use per unit: Energy consumed per output unit, line, or batch.
- Productivity: Output achieved per labor hour, machine hour, or total input.
The daily metrics operations leaders should review
Daily manufacturing reporting should be built for speed, clarity, and escalation. Its job is not to tell the whole story. Its job is to help leaders identify what needs action before the next shift begins.
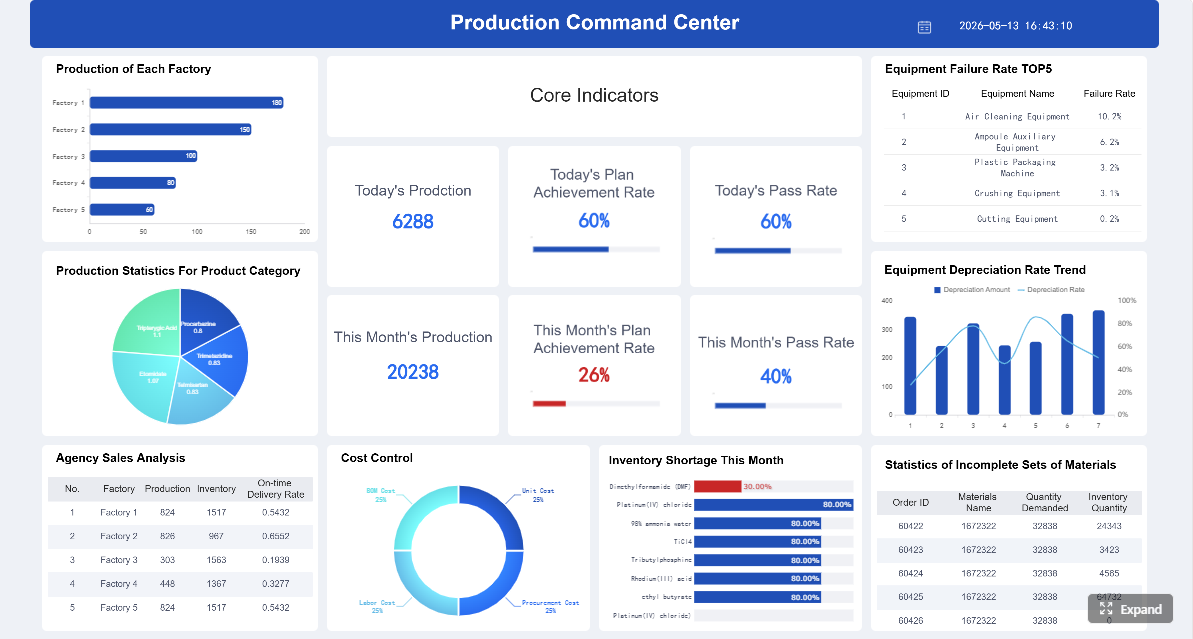
Output, throughput, and schedule attainment
Every daily review should start with actual production versus plan. This is the operational heartbeat of manufacturing reporting. Leaders need to see whether each line, shift, or cell is keeping pace with demand and where shortfalls are emerging.
Key daily questions include:
- Are we producing enough units to stay on schedule?
- Which lines are below target?
- How much did downtime affect output?
- Which customer orders are now at risk?
The right report should compare planned and actual output by:
- Shift
- Line
- Cell
- Work center
- Product family
- Order
This lets supervisors move beyond a plant-wide average and quickly isolate where the miss occurred. If one line underperformed due to changeover delays while another lost time to material shortage, the response should be different.
Quality and scrap indicators
Quality issues become expensive when they stay hidden too long. Daily reports should highlight first-pass yield, defect counts, scrap, and rework in a way that makes exceptions visible immediately.
Operations leaders should focus on:
- First-pass yield by line or product
- Top defect categories
- Scrap by shift or material type
- Rework volume and backlog
- Quality issues tied to customer orders
This is where manufacturing reporting protects margin as much as output. Scrap inflates material cost. Rework consumes labor and machine time. Defects threaten customer service. A good daily report should not just show counts; it should show operational risk.
Downtime, labor, and safety signals
Daily reporting must also expose whether plant losses came from equipment, staffing, or unsafe conditions. Leaders need a compact exception view they can review in minutes.
Critical daily signals include:
- Unplanned downtime by reason
- Top downtime events by duration
- Changeover delays
- Labor utilization versus staffing plan
- Absenteeism or coverage gaps
- Safety incidents and near misses
The best daily reports prioritize what requires escalation. A 10-minute microstop may not matter. A two-hour failure on a constrained work center definitely does. The same logic applies to labor and safety. Reporting should direct management attention to the events that could disrupt the next shift, the week’s delivery plan, or compliance obligations.
The weekly reports that improve coordination and problem-solving
If daily manufacturing reporting is about response, weekly reporting is about pattern recognition and coordination. It gives leaders enough time horizon to detect recurring losses, connect issues across departments, and organize corrective action.
Trend analysis across lines, teams, and products
Weekly reports should help leaders answer a more strategic operational question: what keeps happening, and why?
A week-over-week view reveals recurring bottlenecks that daily reports often hide. For example:
- One shift may consistently miss target due to labor imbalance
- One product family may trigger higher scrap and rework
- One work center may create queue buildup and unstable flow
- One team may suffer frequent changeover overruns
Useful weekly views include:
- Output trend by line
- Downtime trend by reason code
- FPY trend by product
- Scrap trend by team or material
- Schedule attainment by shift
- Capacity loss by work center
The goal is root cause visibility. When leaders compare lines, teams, and products in the same structured report, they can identify whether a problem is local, systemic, or demand-driven.
Inventory, on-time delivery, and maintenance follow-up
Weekly manufacturing reporting should bridge production with supply chain and maintenance decisions. This is where operations leaders make sure plant performance translates into customer service and equipment reliability.
Key weekly review points include:
- WIP levels by area
- Raw material stock risk
- Finished goods readiness
- Orders at risk of late shipment
- Preventive maintenance completion
- Open corrective maintenance actions
- Repeat downtime after maintenance
When this reporting is absent, teams operate in silos. Planning may assume output recovery is possible, while maintenance knows a constraint asset remains unstable. Sales may commit shipment dates without seeing actual production risk. Weekly cross-functional reporting solves that misalignment.
Cross-functional review meetings
A weekly report is only as valuable as the meeting discipline around it. The report should be structured to support decisions, not just status updates.
A strong cross-functional weekly review should include:
- KPI summary: output, quality, delivery, downtime, labor, WIP
- Exceptions: what missed target and where
- Root cause discussion: what is driving the gap
- Recovery plan: what action is required this week
- Ownership: who is responsible
- Deadline: when the action will be closed
- Escalation: what needs leadership support
This is one of the most overlooked parts of manufacturing reporting. Many companies distribute reports widely but fail to attach action plans. The result is awareness without accountability.
The monthly scorecards that support strategic decisions
Monthly manufacturing reporting should elevate the conversation from operational variance to business performance. This is where leaders assess whether plant execution is improving profitability, capacity, and long-term resilience.
Cost, margin, and productivity performance
At the monthly level, the report should connect plant performance to financial outcomes. Daily and weekly issues matter because they compound into margin erosion, cost pressure, and budget variance.
Core monthly scorecard metrics include:
- Labor efficiency
- Material yield
- Scrap cost
- Overtime cost
- Energy use
- Output per labor hour
- Cost per unit
- Contribution to margin
Operations leaders should be able to explain how production losses affected cost and how performance compared with budget expectations. This turns manufacturing reporting into a management tool, not a compliance exercise.
Capacity planning and continuous improvement priorities
Monthly reviews should also show whether the plant is using capacity wisely and where improvement investment will have the highest return.
Focus areas include:
- Capacity utilization trend
- Constraint resource loading
- Recurring downtime categories
- Chronic quality losses
- Automation opportunities
- Improvement project candidates
- Expected savings or throughput gain
This is where reporting supports continuous improvement. Instead of launching projects based on anecdote, leaders prioritize work using evidence. A recurring 3% scrap issue on a high-volume product may justify urgent process redesign. A chronic changeover delay on a bottleneck line may justify SMED or automation investment.
Leadership summaries and board-ready reporting
Senior leadership does not need raw operational noise. They need a concise, decision-focused summary.
A board-ready monthly manufacturing reporting pack should include:
- KPI performance versus target
- Major wins and improvement gains
- Top operational risks
- Customer delivery exposure
- Financial impact of losses
- Corrective actions underway
- Decisions or support required
The best executive summaries are short, visual, and specific. They do not overwhelm leaders with every metric collected. They focus on the handful of issues most likely to affect service, cost, capacity, or strategic objectives.
How to build reports that are accurate, timely, and useful
Building effective manufacturing reporting requires more than selecting charts. It requires governance, rhythm, and fit-for-purpose design. This is where many reporting initiatives break down.
Choose the right data sources and reporting cadence
Start with where your data actually lives. In most plants, it is spread across multiple systems and manual processes.
Typical data sources include:
- ERP for orders, inventory, labor transactions, and financial data
- MES for production counts, machine states, and execution data
- Quality systems for inspection, defects, deviations, and rework
- Maintenance logs or CMMS for work orders, PM completion, and failure history
- Manual shop floor inputs for downtime reasons, near misses, and non-system events
Not every KPI needs real-time refresh. Match reporting cadence to the decision window:
- Real-time or intraday for downtime, schedule attainment, and critical quality exceptions
- Daily for shift review and escalation
- Weekly for trends and cross-functional alignment
- Monthly for strategy, budget, and scorecards
Standardize definitions, ownership, and format
The fastest way to undermine manufacturing reporting is inconsistent definitions. If operations, finance, and quality each calculate the same metric differently, the report becomes political instead of useful.
Define each KPI clearly:
- What is included
- What is excluded
- Which source system is primary
- How often it updates
- Who owns data quality
- Who reviews and acts on it
Standardization should also extend to format. If every report looks different, users waste time relearning layouts. A consistent structure improves speed and trust.
Use software, dashboards, and automation wisely
Spreadsheets can work in simple environments, especially for a single site with limited complexity. But once reporting spans multiple lines, plants, systems, or departments, manual consolidation becomes risky and slow.
Use software and automation when you need to:
- Combine data from multiple systems
- Refresh reports automatically
- Support drill-down from summary to root cause
- Control access by role
- Standardize templates across teams
- Distribute reports at scheduled intervals
- Reduce manual errors and version confusion
Real-time dashboards are especially valuable for frontline response, but they should complement formal reporting rather than replace it. A dashboard helps teams react. A report creates accountability and follow-through.
4 best practices for implementing manufacturing reporting
Here is the consultant’s version of what works in the field:
-
Start with decisions, not data
- Define what each audience must decide daily, weekly, and monthly.
- Build reports backward from those decisions.
- Remove any KPI that has no owner or no action path.
-
Design role-based views
- Supervisors need shift-level exceptions.
- Plant managers need trend and accountability views.
- Executives need financial and risk summaries.
- One report should not try to satisfy everyone equally.
-
Automate collection where errors are costly
- Prioritize automation for production counts, downtime capture, order status, and recurring KPI calculations.
- Keep manual inputs only where human context is necessary, such as downtime cause or safety observations.
-
Build a review routine around the report
- Daily standups for operational exceptions
- Weekly cross-functional meetings for root cause and recovery
- Monthly scorecards for strategic decisions
- Without cadence, even good manufacturing reporting loses value
Common manufacturing reporting mistakes to avoid
Most reporting failures are not technical. They are design and governance failures.
The most common mistakes include:
- Tracking too many KPIs without clear decisions attached to them
- Reporting lagging metrics only while ignoring leading indicators like downtime signals, defect trends, or PM completion
- Mixing inconsistent data sources across departments
- Overusing spreadsheets for complex, multi-source reporting
- Publishing reports without action plans or assigned owners
- Refreshing too slowly for the pace of plant decision-making
- Building reports for analysts, not operators and managers
- Failing to revisit KPI definitions as the operation evolves
A good rule is simple: if a report does not trigger discussion, ownership, or action, it is probably noise.
Building this manually is complex; use FineReport to automate the workflow
As plants scale, manual manufacturing reporting becomes difficult to sustain. Pulling data from ERP, MES, quality systems, maintenance logs, and spreadsheets into one trusted view is time-consuming. It also creates version issues, calculation inconsistencies, and delays that make reports less useful the moment they are shared.
Building this manually is complex; use FineReport to utilize ready-made templates and automate this entire workflow.
With FineReport, manufacturers can:
- Connect data from multiple source systems
- Build daily, weekly, and monthly manufacturing reporting templates
- Create role-based dashboards for supervisors, plant managers, and executives
- Automate refresh, distribution, and scheduled delivery
- Standardize KPI logic across departments
- Drill down from summary scorecards into line-, shift-, or order-level details

Get Ready-to-Use Dashboard Templates in Fine Gallery
FineReport is especially effective when operations leaders want faster reporting without sacrificing control. Instead of rebuilding the same reports every cycle, teams can standardize the reporting model, automate updates, and spend more time solving production issues.
If your goal is to improve output, reduce reporting lag, and create one trusted view of manufacturing performance, this is the practical next step.
FAQs
Manufacturing reporting is the process of turning shop floor data into clear reports that help leaders manage output, quality, downtime, labor, and delivery performance. It helps teams move from raw numbers to specific actions.
Daily reviews usually focus on planned versus actual output, throughput, schedule attainment, downtime, first-pass yield, scrap, rework, labor utilization, and orders at risk. These metrics help supervisors catch problems before they affect the next shift.
A dashboard shows current conditions and highlights exceptions, often in real time. A report adds structure, context, accountability, and follow-up so teams can decide what to do next.
Daily reviews should cover immediate operational issues, weekly reviews should look for trends and recurring losses, and monthly reviews should support bigger decisions on budget, staffing, and improvement priorities. The right cadence depends on how quickly the metric changes and who needs to act on it.
A good system tracks the few KPIs that matter most, uses accurate and timely data, and presents information by shift, line, work center, product, or order. It should also make exceptions easy to spot and support fast decisions across production, quality, and maintenance.


The Author
Yida Yin
FanRuan Industry Solutions Expert
Related Articles

Best Lawn Care Reporting Software Compared: 8 Tools for Scheduling, Invoicing, and Performance Tracking
$1 is an $1 and dashboard platform that helps lawn care businesses turn scheduling, invoicing, crew, and revenue data into clear $1. Best lawn care reporting software at a glance Below is a quick comparison of the best l
Yida YIn
Jun 25, 2026

Hong Kong Financial Reporting Standards Explained: 9 Practical Rules Finance Teams Need to Know
Hong Kong $1 standards matter because they determine how your business recognises revenue, values assets, reports risk, and withstands audit scrutiny. For finance teams, controllers, and compliance leaders, the challenge
Yida YIn
Jun 25, 2026

What Are Regulatory Reporting Services? A Practical Guide for Financial Institutions
$1 services help financial institutions collect, validate, format, and submit required data to regulators in a controlled, repeatable way. For banks, insurers, asset managers, fintechs, and enterprise compliance teams, t
Yida Yin
Jun 25, 2026