ERP reporting is the process of turning data inside your enterprise resource planning system into usable business insight. For finance leaders, operations directors, supply chain managers, and IT teams, that matters because raw ERP transactions alone do not answer critical questions: Where are margins slipping? Which plants are underperforming? Why is inventory rising while service levels fall? Effective erp reporting closes that gap by converting day-to-day activity into visibility, accountability, and faster decisions across the business.
 Click To Try The Dashboard
All reports in this article are built with FineReport
What Is ERP Reporting and Why It Matters
At its simplest, erp reporting means extracting, organizing, and presenting ERP data so teams can understand performance and act on it. ERP systems record transactions across finance, procurement, inventory, production, sales, and HR. Reporting transforms those records into summaries, trends, exceptions, and KPIs that leaders can use to run the business.
For enterprise teams, the value is practical and immediate. Instead of pulling spreadsheets from multiple departments and reconciling numbers manually, reporting creates a shared view of what is happening across the organization. That shared visibility reduces delays, disputes, and poor decisions caused by fragmented data.
ERP reporting is especially powerful because it connects multiple business functions in one view:
- Finance: revenue, profitability, cash flow, close status, AP/AR aging
- Operations: throughput, utilization, downtime, order fulfillment
- Inventory: stock levels, aging inventory, turns, shortages, overstock
- Procurement: supplier performance, purchase cycle time, spend variance
- HR: headcount, labor cost, overtime, attrition, workforce allocation
This is where many organizations get confused. Not all ERP outputs are the same. Decision-makers should distinguish between four layers:
- Raw ERP data: individual transactions, journal entries, receipts, invoices, time logs
- Standard reports: predefined tabular reports built into the ERP
- Dashboards: visual, often real-time displays of key KPIs and alerts
- Analysis: deeper exploration using drill-downs, comparisons, and trend investigation
A mature reporting environment uses all four. Raw data supports traceability. Standard reports support control. Dashboards support monitoring. Analysis supports decision-making.
Key Metrics (KPIs) in ERP Reporting
A strong ERP reporting setup usually includes a core KPI layer. The exact metrics vary by industry, but enterprise teams commonly track:
- Revenue: Total sales generated over a defined period.
- Gross Margin: Revenue minus direct costs; used to assess product and customer profitability.
- Operating Expense: Indirect costs required to run the business.
- Cash Conversion Cycle: Time required to convert investments in inventory and operations into cash.
- Accounts Receivable Aging: Outstanding customer balances by due date bucket.
- Accounts Payable Aging: Outstanding supplier obligations by due date bucket.
- Inventory Turnover: How efficiently inventory is sold or consumed.
- Days Inventory Outstanding: Average number of days inventory remains on hand.
- Order Fulfillment Rate: Percentage of customer orders completed successfully.
- On-Time In-Full (OTIF): Share of deliveries that arrive complete and on schedule.
- Procurement Cycle Time: Time from purchase request to approved order or receipt.
- Production Utilization: Percentage of available production capacity being used.
- Labor Cost per Output Unit: Workforce cost tied to operational output.
- Headcount and Attrition: Workforce size and rate of employee departure.
- Budget vs. Actual Variance: Difference between planned and actual financial or operational results.
When these KPIs are defined consistently and refreshed reliably, erp reporting becomes a management system rather than a reporting exercise.
What Is ERP? The Foundation Behind ERP Reporting
ERP, or enterprise resource planning, is an integrated software system that manages core business processes in one environment. Instead of separate tools for accounting, purchasing, warehouse management, manufacturing, and HR, an ERP centralizes workflows and data so departments can operate from the same system of record.
Without this foundation, reporting becomes fragmented. Teams export data from disconnected tools, definitions drift, and executives spend more time reconciling reports than using them. With ERP, reporting starts from a more controlled and consistent base.

Common ERP modules include:
- Finance and accounting: general ledger, AP, AR, fixed assets, cost accounting
- Procurement: vendor master, purchase requisitions, POs, receipts, spend
- Inventory and warehouse: stock balances, movement history, location data
- Manufacturing or production: work orders, BOMs, routings, output, scrap
- Sales and order management: quotes, orders, shipments, returns, billing
- Supply chain and logistics: planning, fulfillment, transport, supplier coordination
- Human resources: payroll, headcount, scheduling, attendance, performance
- Project management: project budgets, milestones, resource usage, actual costs
Each module generates high-volume operational data. ERP reporting works because these data streams can be linked through shared dimensions such as company, product, customer, supplier, location, department, and time period.
That centralization improves reporting quality in several ways:
- Greater consistency: teams use common definitions and structures
- Less duplication: fewer manual extracts and shadow spreadsheets
- Higher accuracy: reduced reconciliation across systems
- Better auditability: users can trace report figures back to source transactions
- Faster delivery: reporting teams spend less time gathering data and more time interpreting it
In short, ERP systems matter for reporting because they create the data discipline that enterprise insight depends on.
How ERP Reporting Works in Practice
Data collection and consolidation
In practice, erp reporting begins with data collection from daily business activity. Finance posts journals, procurement issues purchase orders, warehouses record receipts and transfers, manufacturing confirms output, and HR updates payroll and staffing records. These transactions flow into the ERP database or into a reporting layer connected to it.
The first operational challenge is consolidation. Large organizations often run multiple entities, plants, warehouses, currencies, and even multiple ERP instances. To report reliably, teams need to standardize dimensions, align master data, and map transactions into a consistent business structure.

A sound consolidation approach usually includes:
- Source alignment: identify which ERP modules and external systems feed reporting.
- Data mapping: standardize chart of accounts, business units, SKUs, vendors, and cost centers.
- Validation rules: flag missing, duplicate, or inconsistent records.
- Refresh logic: define whether reports update in real time, hourly, daily, or by close cycle.
- Security controls: ensure users only access data relevant to their roles.
If this layer is weak, everything downstream suffers. The best dashboards in the world cannot fix poor source data.
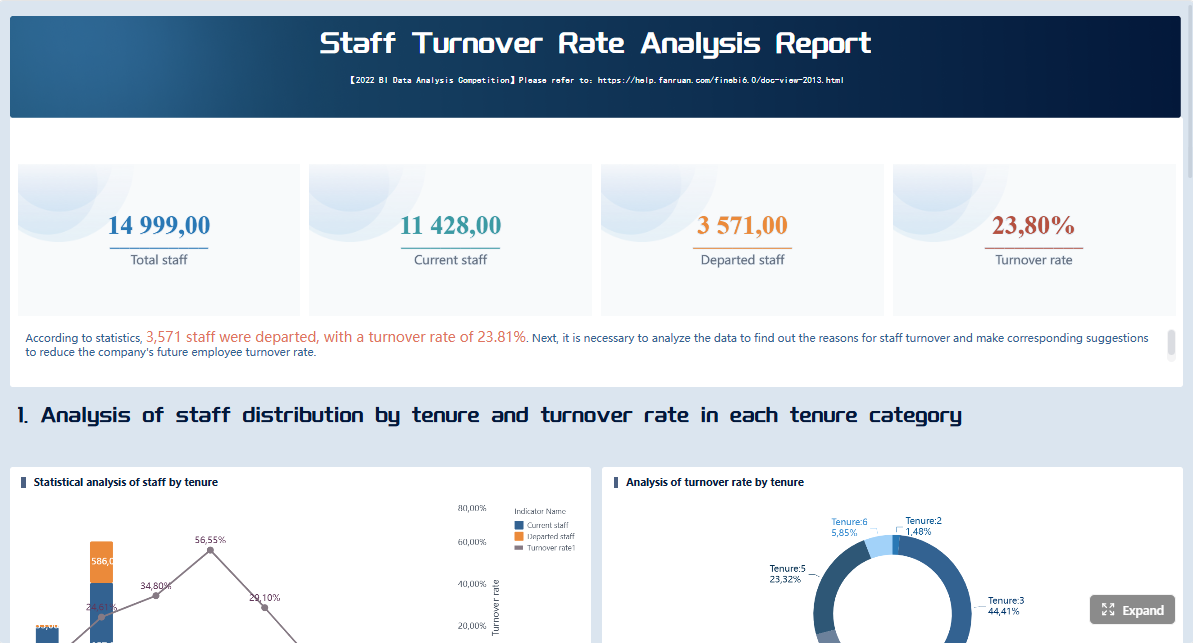
Report generation and dashboard delivery
Once data is structured, the next step is delivering it in formats users can actually consume. Most enterprises need a mix of reporting modes rather than a single output type.
Typical delivery formats include:
- Scheduled reports: daily, weekly, or monthly reports automatically distributed to teams
- Operational dashboards: near-real-time views for monitoring exceptions and workload
- Executive dashboards: summarized KPIs, trends, and strategic indicators
- Role-based reports: customized content for finance, procurement, operations, HR, and leadership
- Mobile views: simplified dashboards for managers on the move
![]()
The right format depends on the decision being supported. A controller may need a scheduled month-end variance pack. A warehouse manager may need a live dashboard showing backlog, stockouts, and fulfillment rate. A procurement lead may need a supplier scorecard refreshed every morning.
This is why static spreadsheets are rarely enough at enterprise scale. They can document numbers, but they do not provide timely interaction, filtering, or drill-down when conditions change quickly.
Analysis, exceptions, and decision support
The real value of erp reporting appears when users move beyond monitoring and into action. A dashboard should not just show performance. It should help users identify what changed, why it changed, and where intervention is needed.
This typically happens through:
- Trend analysis: spotting movement over time in revenue, margin, costs, or service levels
- Exception reporting: highlighting overdue tasks, threshold breaches, or unusual variances
- Drill-down analysis: moving from summary KPIs into transactions, product lines, plants, or suppliers
- Comparative analysis: actual vs. budget, this month vs. last month, region vs. region
- Root-cause investigation: linking operational metrics to financial outcomes
For example, if inventory turnover drops, an operations team should be able to drill into warehouse, item category, and supplier data to determine whether the issue is excess buying, slow-moving SKUs, planning error, or declining demand. That is what separates reporting from mere data presentation.
ERP Reporting Tools Explained: From Dashboards to Advanced Analytics
ERP reporting tools exist on a spectrum. Some are built directly into the ERP and handle standard operational needs. Others extend into self-service analytics, BI platforms, or advanced modeling. The right mix depends on how complex the organization is and how fast decisions need to happen.
At the base level are standard reports. These are useful for recurring business processes such as trial balances, inventory balances, AP aging, or purchase order status. They support control and compliance well, but they are often rigid.
Next comes self-service reporting, which lets business users filter, group, and personalize views without waiting for IT. This is critical when department leaders need quick answers without launching a formal reporting request.
Then come dashboards and KPI tracking. These are ideal for monitoring performance at a glance. Executives and managers use dashboards to see whether targets are being met and whether exceptions require intervention.
A more advanced layer includes drill-down and interactive analysis. This enables users to start from a high-level metric and trace it to the underlying drivers. It improves accountability and speeds problem resolution.
Organizations often need custom reporting or broader BI integration when:
- They operate across multiple ERP systems or business units
- They need cross-functional reporting beyond standard ERP structures
- Users require complex calculations, modeling, or scenario analysis
- Executive teams want highly tailored dashboards
- Reporting volumes or performance demands exceed built-in ERP capabilities
Static reports and interactive dashboards serve different business needs:
- Static reports are best for audit trails, formal reviews, board packs, and scheduled operational summaries.
- Interactive dashboards are best for monitoring, investigation, and fast operational decisions.
When evaluating ERP reporting tools, focus on these core elements:
- Data connectivity: Can the tool connect to your ERP, databases, and other systems reliably?
- Real-time or scheduled refresh: Does update frequency match business needs?
- Role-based access: Can finance, HR, operations, and executives see only what they should?
- Drill-down capability: Can users trace KPIs to the source detail?
- Customization: Can reports be tailored without excessive coding?
- Scalability: Will it perform across entities, locations, and growing data volumes?
- Usability: Can non-technical users adopt it quickly?
- Governance: Are definitions, permissions, and standards controlled centrally?
- Export and sharing: Can outputs be distributed in the formats teams actually use?
- Visualization quality: Are dashboards intuitive enough to support fast decisions?
The best tool is not necessarily the one with the most features. It is the one that balances control, flexibility, and adoption at enterprise scale.
Creating a Successful ERP Reporting Strategy
Technology alone does not create reporting value. A successful erp reporting strategy starts with operating priorities, governance discipline, and user adoption. This is where many programs fail: the organization builds reports, but not a reporting system people trust and use.
Define business goals and reporting priorities
Start with business decisions, not report formats. Ask what leadership and functional teams need to know, how often they need it, and what action the information should trigger.
A practical prioritization model should cover:
- Executive needs: enterprise KPIs, growth, profitability, cash, risk, strategic trends
- Finance needs: close, variance, liquidity, receivables, payables, compliance
- Operations needs: throughput, utilization, delays, fulfillment, quality
- Supply chain needs: inventory, supplier performance, lead time, shortages
- Department needs: role-specific metrics tied to day-to-day accountability

Do not try to build every report at once. Start with high-impact use cases where visibility directly improves speed, control, or cost.
Improve data quality and governance
If users question the numbers, adoption collapses. Strong reporting depends on ownership and governance just as much as on visualization.
Key governance practices include:
- Define a single source of truth for each KPI
- Assign clear data owners by domain
- Standardize metric definitions and business rules
- Apply role-based access controls
- Set refresh schedules and validation checkpoints
- Document report logic and exception handling
This discipline reduces one of the most common enterprise problems: multiple teams producing different answers to the same business question.
Design reports users will actually adopt
Even accurate reports fail if they are hard to use. The highest-performing organizations design ERP reporting around the user’s workflow.
Best-practice design principles:
- Keep each dashboard focused on a specific decision or role
- Prioritize exceptions and trends over excessive detail
- Use consistent definitions, layouts, and filters
- Match report frequency to the operational rhythm
- Make drill-down available without overwhelming the top-level view
Users adopt reports when they reduce effort, not when they display everything possible.
Measure performance and refine over time
Reporting should be managed like any other enterprise capability. Review whether people are using reports, whether the outputs support better outcomes, and which reports create noise instead of value.
Track reporting effectiveness through:
- Usage frequency and active users
- Time saved versus manual reporting
- Reduction in reconciliation or reporting errors
- Speed of month-end close or operational response
- Decision cycle improvements
- Business outcomes tied to visibility, such as lower inventory or faster collections
4 Best Practices to Implement ERP Reporting Successfully
If you want practical advice from the field, follow these four implementation moves first:
-
Build a KPI dictionary before you build dashboards.
Agree on definitions, thresholds, owners, and calculation logic early. This prevents expensive rework and internal disputes later. -
Prioritize one executive dashboard and two operational use cases.
Do not launch with 50 reports. Start with a leadership dashboard, then target one finance process and one operational process where reporting can drive measurable action. -
Design for exception management, not passive viewing.
Every important report should help users identify what changed and what needs intervention. Use thresholds, color coding, alerts, and drill paths. -
Create a governance rhythm.
Hold regular reviews to retire low-value reports, refine KPIs, and resolve data ownership issues. Reporting quality declines quickly without operational stewardship.
These steps sound simple, but they are what separate a reporting rollout from a true enterprise performance capability.
Why Enterprise Teams Rely on ERP Reporting
Enterprise teams rely on erp reporting because it improves planning, strengthens compliance, accelerates response time, and aligns functions around one set of facts. In large organizations, decisions break down when finance, operations, procurement, and HR all see different versions of reality. Reporting restores alignment.
Done well, ERP reporting supports:
- Better planning: leaders can forecast using current operational and financial signals
- Compliance and audit readiness: standardized reports improve traceability and control
- Faster month-end close: finance teams reduce manual reconciliation and reporting cycles
- Stronger inventory control: operations can detect slow stock, shortages, and imbalance earlier
- Clearer operational insight: managers can identify bottlenecks, waste, and service issues faster
- Cross-functional coordination: departments work from common KPIs rather than siloed spreadsheets
That said, most enterprises still face three persistent challenges:
- Poor data quality: inconsistent master data and manual workarounds undermine trust
- Limited user adoption: reports are too complex, too generic, or too slow to access
- Reporting complexity: multi-entity, multi-system environments make standard reporting insufficient
The answer is not more spreadsheets or more ad hoc requests. It is a deliberate reporting model: clear KPIs, governed data, role-based delivery, and tools that support both control and agility.
FineReport: The Fastest Way to Build ERP Reporting at Enterprise Scale
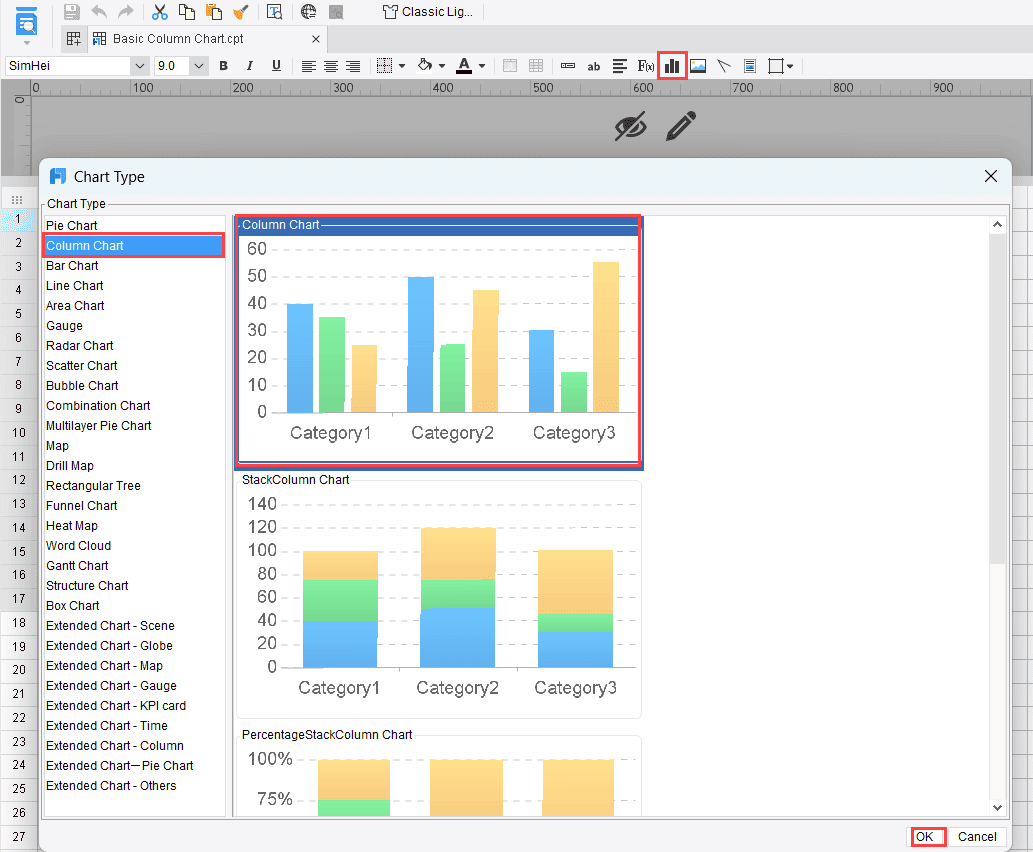
Building this manually is complex; use FineReport to utilize ready-made templates and automate this entire workflow.
For enterprise teams, that means you do not need to start from a blank page every time finance requests a variance dashboard, operations needs a plant performance view, or procurement wants supplier analytics. FineReport helps organizations connect ERP data, design role-based dashboards, automate scheduled reporting, and support drill-down analysis without relying on fragile manual processes.
FineReport is especially well-suited when you need to:
- Combine data from ERP and other enterprise systems
- Deliver dashboards to different departments with role-based access
- Automate recurring operational and management reports
- Build interactive KPI tracking with filters and drill-down
- Standardize layouts and metrics across business units

Get Ready-to-Use Dashboard Templates in Fine Gallery
Instead of stitching together exports, scripts, and spreadsheets, teams can move faster with reusable templates, centralized governance, and scalable dashboard delivery. That is the practical path to modern erp reporting: less manual effort, more trusted insight, and faster business action.
If you are evaluating how to improve visibility across finance, inventory, operations, procurement, and HR, start with the reports that matter most, define the KPIs clearly, and choose a platform that can scale


The Author
Yida Yin
FanRuan Industry Solutions Expert
Related Articles

8 Best Restaurant Reporting Software Tools for 2026: Compare FineReport, Toast, SpotOn & More
$1 is a highly customizable business intelligence and reporting platform that helps restaurants turn POS, labor, inventory, finance, and multi location data into real time dashboards and decision ready reports. 8 Best Re
Yida Yin
Jun 24, 2026

Database Reporting Architecture: When to Use a Reporting Database vs Your Operational System
$1 is not just about pulling data into a dashboard. It is an architecture decision that affects application performance, reporting speed, data trust, and how confidently your teams can make decisions. If you are an IT ma
Yida Yin
Jun 24, 2026
Data Warehouse Reporting Tools Compared: FineReport vs Power BI vs Tableau for Complex Enterprise Needs
$1 is an $1 and dashboard platform built for complex, highly formatted, data driven reporting on top of modern data warehouse environments. What to look for in data warehouse reporting tools for complex enterprise needs
Yida Yin
Jun 24, 2026