Financial reporting in Power BI usually refers to using Microsoft Power BI to turn finance data into interactive reports, dashboards, and analysis views for executives, FP&A teams, controllers, and department leaders. If you searched this term, you are likely trying to answer a practical question: Can Power BI handle real finance reporting needs, or is it better suited to analysis than formal reporting?
For many finance teams, Power BI is attractive because it can connect data from ERP systems, budgeting tools, payroll systems, and spreadsheets into one reporting layer. It helps users move faster, reduce manual consolidation, and explore trends through drill-down dashboards. But there is also a common expectation gap. A tool that works well for interactive analysis does not always produce the same result as a board-ready finance pack, a printable financial statement, or a controlled close-process report.
That distinction matters. Finance teams often need more than charts and KPI cards. They may also need strict layouts, page control, sign-off workflows, version consistency, and outputs that look the same every time they are distributed.
Clear Reporting Purpose: Define whether the report is for analysis, management review, close reporting, or formal external presentation.
Accurate Data Source: Pull from trusted ERP, budgeting, payroll, and finance-controlled sources.
Structured Layout: Present metrics in a format the audience can interpret quickly, whether that is a dashboard, tabular statement, or reporting pack.
Parameterized Filtering: Allow views by entity, cost center, period, product line, or department when exploration is needed.
Scheduled Delivery: Automate monthly, quarterly, or exception-based distribution to stakeholders.
Actionable Summary: Highlight trends, variances, risks, and decisions that require follow-up.
What financial reporting in Power BI actually means for finance teams
Financial reporting in Power BI can mean different things depending on the audience and use case. That is why finance teams should define the reporting goal before building anything.
Operational dashboards, management reporting, and formal financial reporting are not the same
At a high level, finance reporting needs usually fall into three categories:
Operational dashboards: Used to monitor current performance, such as daily revenue, overdue receivables, spending trends, or working capital indicators.
Management reporting: Used for recurring monthly or quarterly review packs, including budget vs. actual, department performance, margin analysis, and variance commentary.
Formal financial reporting: Used for highly structured financial statements, board packs, disclosure-ready reports, or outputs that require strict formatting and sign-off.
Power BI is commonly strong in the first two areas. It can also support financial statement-style views, but formal reporting requirements often introduce constraints that dashboard tools are not always designed to solve cleanly.
Why finance teams turn to Power BI for visibility, speed, and consolidation
Finance teams adopt Power BI because it helps solve familiar reporting problems:
Teams need one place to compare entities, departments, periods, or products
Power BI is especially useful when finance wants to combine data from multiple business systems and create a shared reporting layer for analysis. Instead of circulating disconnected spreadsheets, teams can centralize definitions and let stakeholders interact with trusted metrics.
The expectation gap between analytics and board-ready deliverables
A major source of frustration is assuming that an interactive BI report will automatically satisfy every financial reporting need. In reality, these are different output types.
An executive may love a dashboard for monitoring trends and drilling into anomalies. A board member, auditor, or external stakeholder may still expect a locked layout, printable pages, narrative sections, and consistent line-item presentation. Finance leaders should recognize this gap early so Power BI is used where it adds the most value.
What finance teams can build in Power BI
Power BI can absolutely support many valuable finance reporting scenarios, especially when the goal is visibility, recurring internal review, and interactive analysis.
Teams can build dashboards and multi-page reports that show:
Revenue by entity, product line, or region
Gross margin and operating margin trends
Expense performance by department or cost center
Cash flow and liquidity indicators
Budget vs. actual comparisons
Variance analysis over time
These reports are useful for CFOs, finance business partners, department heads, and regional managers because users can drill down from summary KPIs into the details behind a change.
For example, a finance leader might start with a consolidated margin dashboard, then drill into a specific entity, then into a cost center, and finally into a product group or reporting period. That kind of layered analysis is where Power BI is often very effective.
Finance teams can also build interactive versions of standard statements in Power BI, including:
Income statement views
Balance sheet views
Cash flow reporting views
Month-end and quarter-end performance summaries
Budget vs. actual statement comparisons
These are often designed with hierarchies, filters, expandable account groups, and period selectors. This can make them useful for internal stakeholders who want more context than a static spreadsheet or PDF provides.
In practice, an interactive income statement in Power BI may let users filter by business unit, legal entity, month, or scenario. A controller can review consolidated totals, then expand into account-level detail. An FP&A team can compare current month actuals against budget and prior year in a single view.
This is valuable for internal analysis. The caution is that interactive financial statements are not always the same thing as finalized financial statements for formal presentation.
Financial overview pages for fast decision-making
Many finance teams start with a financial overview page before building more detailed reports. This works well because leadership usually wants a fast summary of financial health before reviewing details.
A good overview page may include:
Revenue and net profit trends
Margin percentages
Expense run rate
Cash position or cash flow movement
Working capital indicators
Top favorable and unfavorable variances
Trend flags or exceptions needing attention
These pages support weekly, monthly, and quarterly review meetings because they let finance quickly frame the conversation. Instead of opening with dozens of tables, the team can begin with a concise financial story and drill deeper only where needed.
Power BI is a strong fit when finance needs broad visibility, consolidated analytics, and faster recurring reporting for internal stakeholders.
Consolidating data from multiple finance systems
One of Power BI’s biggest advantages is its ability to bring together data from multiple sources into one reporting environment.
Finance teams often need to combine:
ERP data
Budgeting and planning data
Payroll data
Accounts receivable and payable data
Spreadsheets used for supplemental adjustments
Operational drivers that explain financial results
This helps reduce manual reconciliation across disconnected files and makes it easier to compare performance across entities or departments. Even when underlying systems remain separate, Power BI can provide a common reporting layer for analysis.
Improving speed, consistency, and transparency
Power BI helps finance standardize definitions and calculations across teams. Instead of each department maintaining its own spreadsheet logic, measures can be built once and reused across reports.
Better transparency into how numbers are calculated
Shared access to trusted metrics
Reduced duplication of manual reporting effort
For leadership teams, this means fewer debates about whose spreadsheet is correct. For finance, it means more time spent analyzing performance and less time rebuilding reports from scratch.
Supporting low-code and no-code report creation
Power BI also appeals to finance teams because report building does not always require heavy custom development. Business users can often adjust visual layouts, add filters, refine views, or build recurring management reports with limited IT involvement, especially when the data model is already prepared.
That makes it useful for repeatable cycles such as:
Still, low-code flexibility works best when governance is in place. Finance teams should not confuse easier report creation with the absence of design discipline. Reporting definitions, ownership, and refresh schedules still need to be controlled.
Where dashboards fall short for formal finance reporting
This is where many finance projects need more realistic expectations. Power BI is a BI and analytics platform first. That is not the same as saying it cannot support finance reporting. It can. But some formal reporting needs are better handled with other output methods or companion tools.
Limitations with pixel-perfect financial statements
Formal finance reporting often requires highly controlled formatting:
Exact page breaks
Strict row and column alignment
Repeating headers and footers
Disclosure-friendly line-item presentation
Consistent print layout
Polished board-pack formatting
Branded, fixed-position report elements
These requirements can be difficult in dashboard-style reporting. Interactive visuals are designed for exploration, not always for precise page composition. Finance users may find that statement-style presentation, especially for printable or externally distributed reports, becomes harder when layout control must be exact.
Reports that must preserve exact formatting across exports
Governance, auditability, and close-process constraints
Dashboard flexibility can also create tension with finance governance requirements.
In many organizations, formal financial outputs need:
Locked reporting versions
Controlled approval and sign-off
Clear ownership of final numbers
Auditability around changes
Consistent outputs for all recipients
Separation between live exploration and finalized reporting
A live dashboard is useful for ongoing analysis, but it may not fully match the needs of a close process where finance wants everyone reviewing the same approved version. If one user opens a report before refresh and another opens it after refresh, interpretation can differ unless the process is tightly managed.
That does not make dashboards wrong. It means finance should separate exploratory reporting from final reporting outputs where governance requirements are strict.
Excel for flexible working schedules and ad hoc finance modeling
Paginated or structured reporting tools for print-ready outputs
Narrative or board-reporting tools for commentary-rich presentation
This approach works because not every reporting need should be forced into one format. Power BI can be the place where users explore and monitor performance. Another tool can handle final presentation when layout, governance, or distribution requirements are more demanding.
Who is the audience? Analysts, finance leadership, auditors, board members, operational leaders, or external stakeholders?
What is the goal? Exploration, recurring management review, close reporting, or formal statement distribution?
How important is drill-down? Some users need interactive analysis; others need fixed outputs.
How important is exportability? Will stakeholders rely on PDF, Excel, or print-ready packs?
How strict is formatting control? Does the report need exact layout consistency?
Are approval workflows required? Is there a sign-off process before distribution?
Should the output be live or locked? Finance may need both, but they serve different purposes.
These questions often reveal whether the requirement is truly a Power BI dashboard use case or something broader.
A practical decision framework for finance teams
Here is a simple framework:
Power BI is often a strong fit when:
The audience is internal
Users want drill-down and self-service exploration
Data must be consolidated from multiple systems
Reporting logic needs to be standardized
Monthly and quarterly management review is the priority
KPI visibility and variance analysis matter more than exact page formatting
Use caution when:
Reports must be pixel-perfect
Print layout is highly important
Outputs require controlled versioning and sign-off
The audience expects a board-book or statutory-style format
Narrative presentation and exact line-item formatting are central
Finance needs locked, reproducible outputs for every cycle
In short, Power BI adds clear value for interactive finance reporting. It may be less suitable as the only solution for formal reporting workflows that depend on precision formatting and controlled distribution.
Finance teams get better results from Power BI when they use it with clear boundaries and sound reporting governance.
Start with a financial overview and management reporting use case before expanding to full statement presentation.
Design models and measures around finance definitions that stakeholders already trust.
Separate exploratory analysis from final reporting outputs to reduce confusion.
Plan governance, refresh schedules, and ownership early to improve accuracy and confidence.
These practices help teams avoid a common mistake: trying to make one reporting layer satisfy every finance audience in exactly the same way.
Practical recommendations for finance teams
If you are evaluating financial reporting in Power BI, these recommendations can help you make better decisions:
Define the reporting category first. Decide whether you are building for analysis, management review, or formal reporting. Do not treat them as identical needs.
Use dashboards for visibility, not for every final deliverable. Power BI is highly effective for KPI monitoring, trends, and variance analysis, but formal statements may require another output format.
Standardize finance logic before scaling reports. Shared metric definitions, account mappings, and calculation rules matter more than visual design.
Separate live analysis from approved reporting outputs. This reduces confusion during close cycles and improves trust in the final numbers.
Evaluate tools based on workflow, not just visualization.Finance reporting often depends on scheduling, formatting, approval, printing, and operational consistency as much as charts.
When finance teams need more than Power BI dashboards
Tools like Power BI are widely used for visualization and BI analysis, but teams with complex reporting workflows may also need a dedicated enterprise reporting platform like FineReport.
This becomes relevant when finance reporting extends beyond dashboard exploration and into recurring operational or formal reporting needs, such as:
Data entry or form-based workflows tied to reporting processes
Multi-department reporting governance
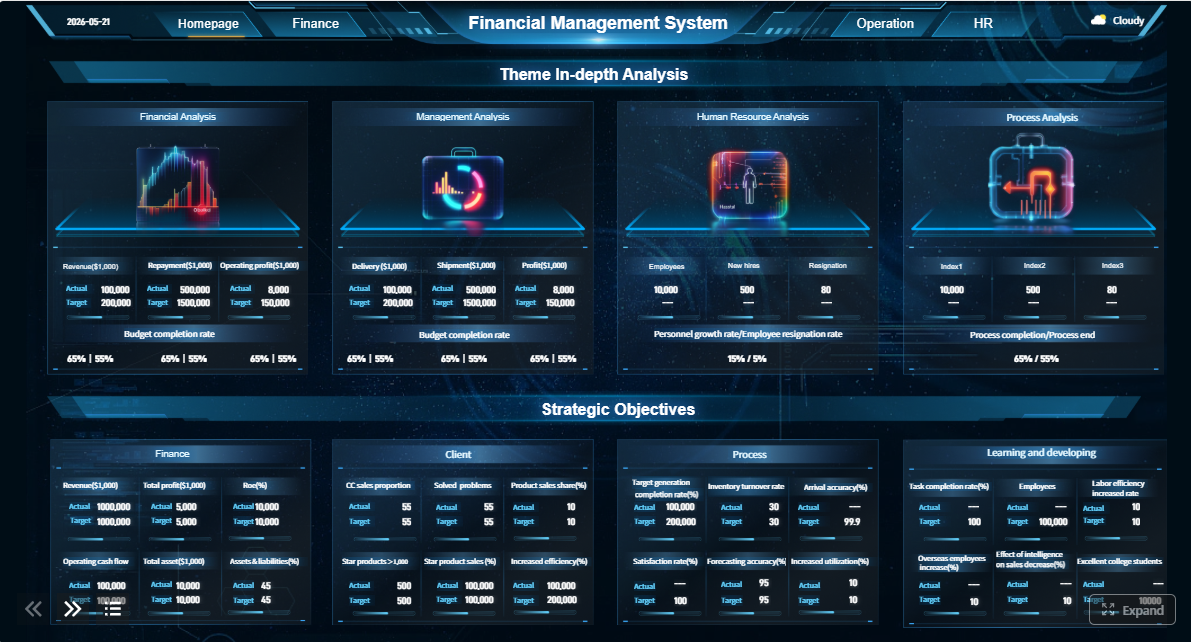
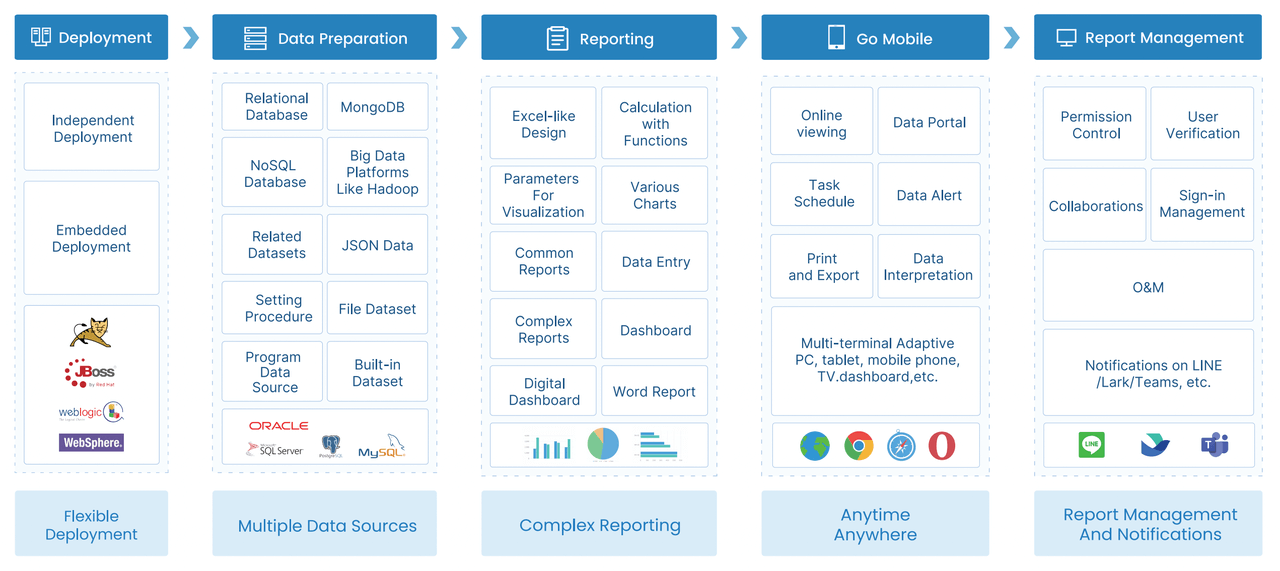
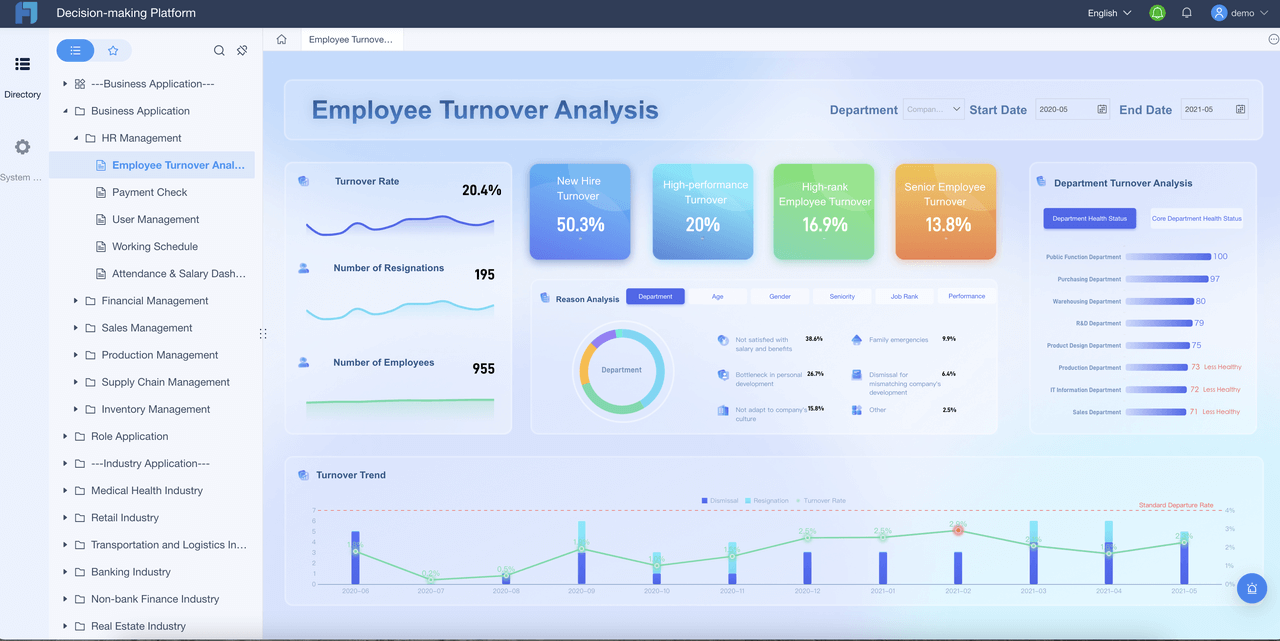
FineReport is designed for organizations that need both dashboards and structured enterprise reporting. In practice, that means a finance team can use dashboards for KPI monitoring and also build more formatted, print-friendly, and process-oriented reports when required.
Where FineReport fits in finance reporting workflows
Pixel-perfect report design for structured financial outputs
Paginated reports that are easier to print and distribute consistently
Parameter queries for period, entity, department, and scenario selection
Scheduled reporting for recurring month-end or quarter-end delivery
Integrated dashboards and reports so summary views connect to detailed statements
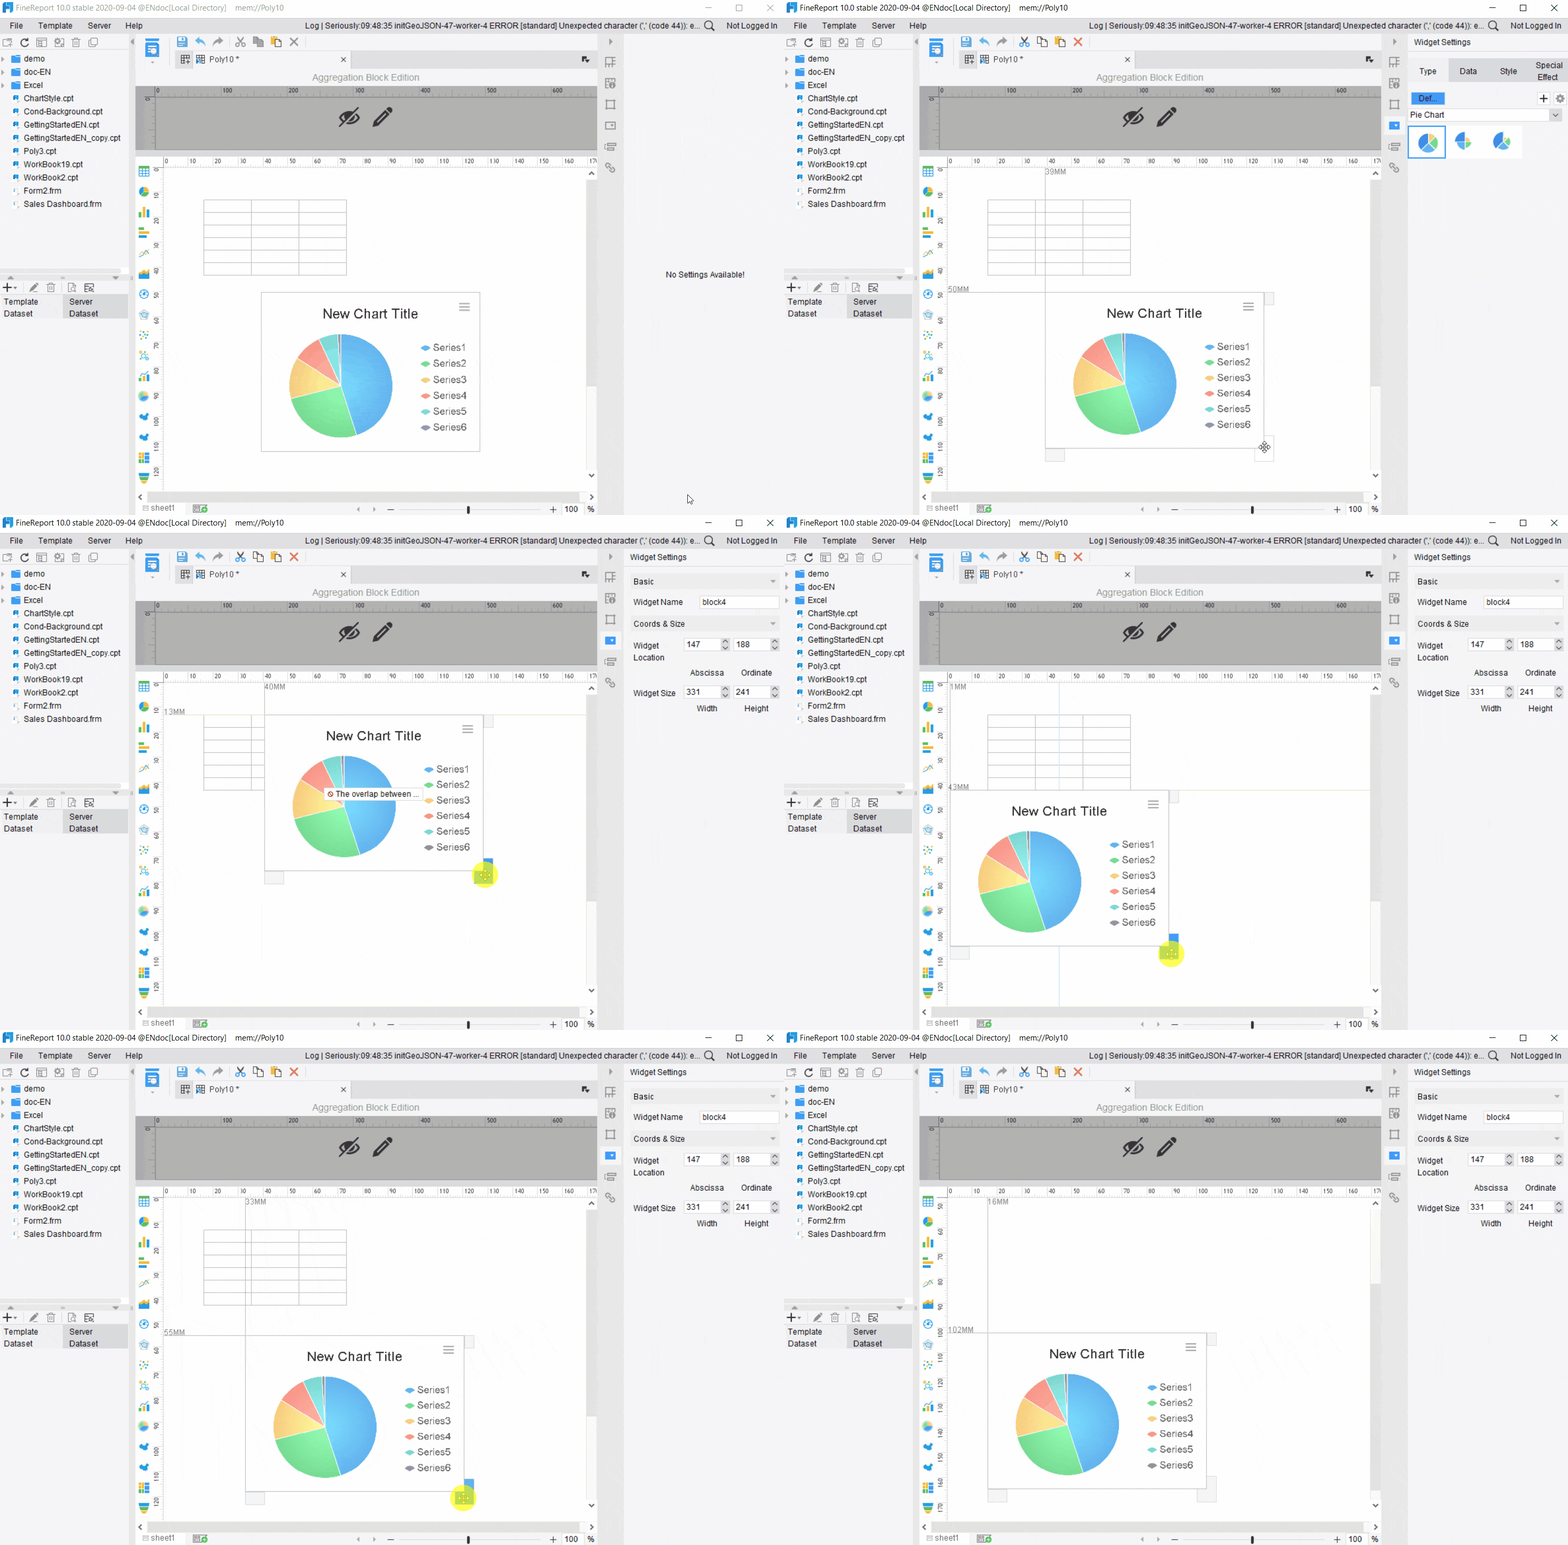
Data entry forms and workflow support where reporting is linked to collection or adjustment processes
That does not replace Power BI in every case. Rather, it addresses reporting needs that go beyond dashboard-style presentation. For some organizations, the best approach is not choosing one tool for everything, but matching the reporting tool to the reporting requirement.
Get Ready-to-Use Dashboard and Report Templates in Fine Gallery
Final thoughts
Financial reporting in Power BI can deliver real value for finance teams, especially for management reporting, KPI dashboards, variance analysis, and consolidated performance visibility. It is a practical choice when the goal is to explore trusted numbers, monitor financial health, and give stakeholders faster access to insight.
But dashboards are not the whole reporting story. When finance needs exact formatting, controlled outputs, sign-off discipline, printable statements, or recurring enterprise distribution, dashboard tools may not cover every requirement on their own.
The most effective finance teams are clear about that from the start. They use Power BI where interactive analytics is the goal, and they add structured reporting capabilities where formal reporting demands more control.
If your team needs both interactive financial analysis and enterprise-grade reporting outputs, FineReport is worth evaluating as part of that reporting architecture.
Power BI works well for KPI dashboards, management reports, budget versus actual analysis, cash flow views, and drill-down performance reporting. It is especially useful when finance teams need interactive analysis across entities, departments, periods, or products.
Yes, Power BI can present income statement, balance sheet, and cash flow style reports. However, highly formatted statements with strict page layouts, print control, and consistent board-ready output can be harder to manage in a dashboard-first tool.
Finance teams use Power BI to consolidate data from ERP systems, planning tools, payroll systems, and spreadsheets into one reporting layer. This reduces manual reporting work and gives leaders faster visibility into performance and variances.
Power BI can be less effective when reports require locked formatting, repeatable print output, formal sign-off, or tightly controlled distribution. These needs are common in board packs, close-process reports, and external-facing financial documents.
In most cases, Power BI is stronger for analysis and internal management reporting than for formal financial reporting. It helps users explore trends and drivers well, but finance teams may need other tools when layout control and document governance are critical.
Product Trial
FineReport
Pixel-perfect reports · Interactive dashboards · Easy data entry · Digital twins