Enterprise teams want to automate reporting because manual KPI updates waste analyst time, delay executive decisions, and create version conflicts across finance, operations, sales, and IT. But speed alone is not the goal. The real business value comes from delivering recurring dashboard updates that are fast, consistent, auditable, and trusted by every stakeholder who relies on them.
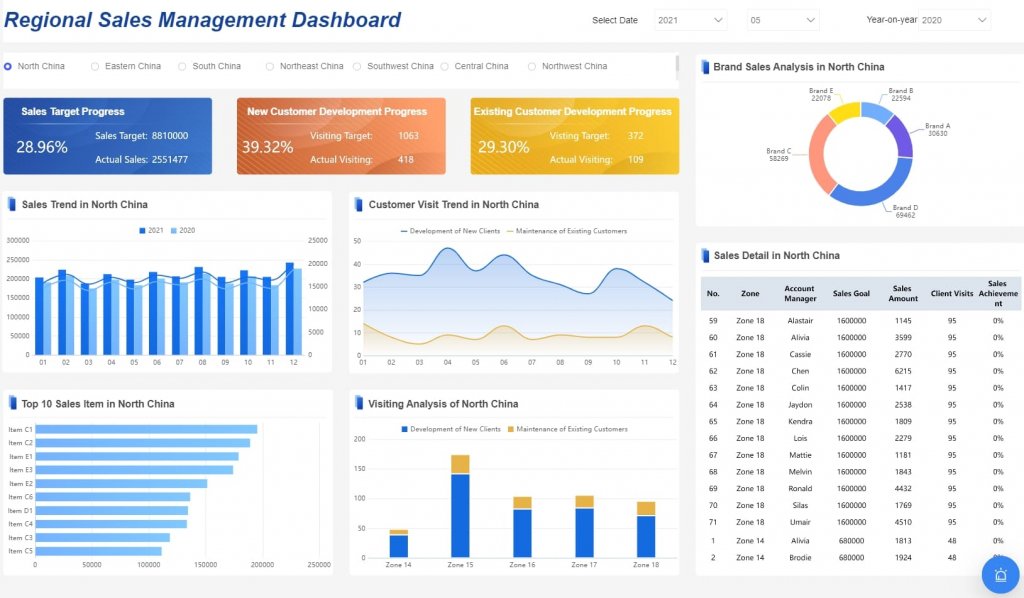
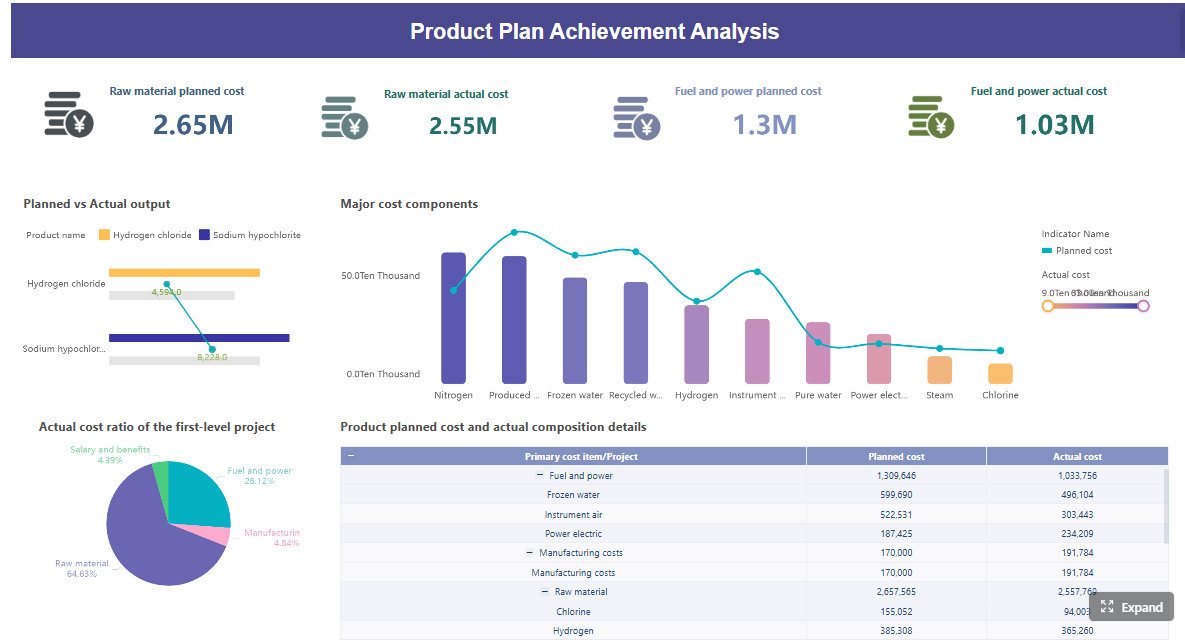 Click To Try The Dashboard
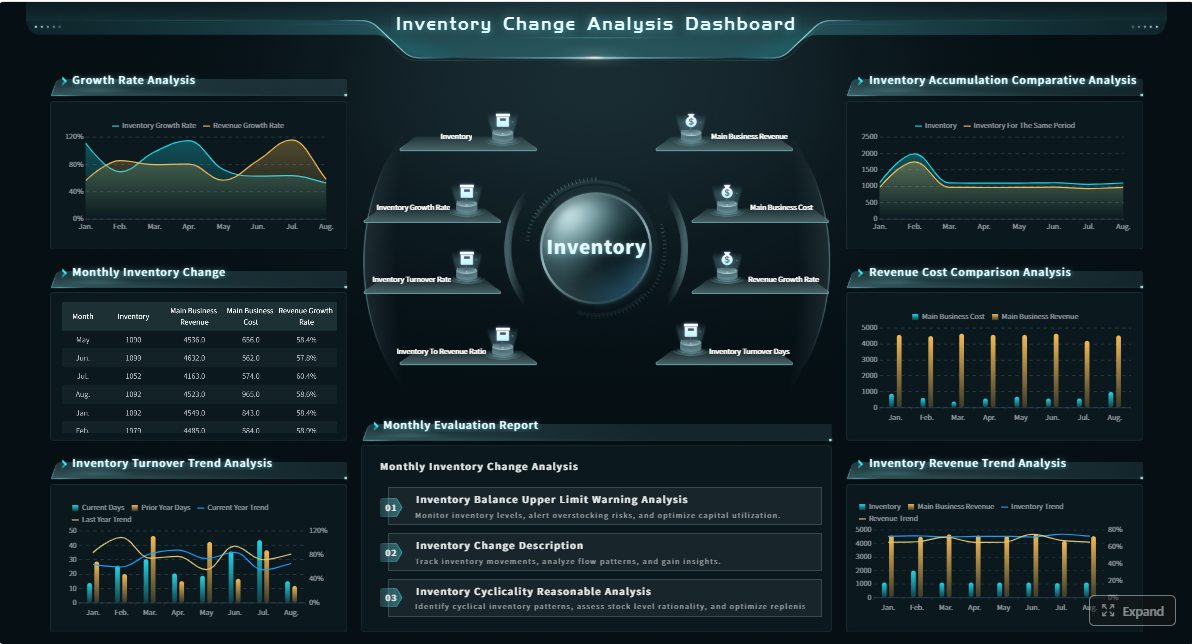
All reports in this article are built with FineReport
What it means to automate reporting for enterprise KPI dashboards
To automate reporting in an enterprise setting means replacing repetitive, manual reporting tasks with scheduled, rules-based workflows that pull data from source systems, apply approved business logic, refresh dashboards, and distribute outputs to the right stakeholders automatically.
For operations directors, BI leaders, and IT managers, this is not just about convenience. It is about building a reporting system that scales without increasing manual workload every month, quarter, or board cycle.
Automated reporting for enterprise KPI dashboards typically includes:
- Pulling data from ERP, CRM, warehouse, HR, or operational systems
- Applying transformation logic and metric calculations
- Refreshing dashboards on a defined schedule
- Distributing views or exports to executives and functional teams
- Logging refresh status, exceptions, and user access
Faster reporting is not the same as trustworthy reporting
Many teams confuse reporting automation with reporting acceleration. Faster reporting simply means the output arrives sooner. Trustworthy reporting means leaders believe the numbers, understand where they came from, and can act on them confidently.
That distinction matters. A dashboard that refreshes every morning but uses inconsistent definitions for gross margin, active customer, or on-time delivery can create more damage than a delayed report.
Trustworthy automated reporting requires:
- Consistent KPI definitions
- Stable source system mappings
- Controlled transformation logic
- Clear ownership
- Auditability
- Exception handling
Why enterprise teams struggle when workflows, tools, and definitions collide
Most reporting issues do not come from dashboard design. They come from fragmented operating reality.
Common enterprise pain points include:
- Different teams defining the same KPI differently
- Analysts using hidden spreadsheet adjustments before publication
- Reports pulling from multiple systems with mismatched update cycles
- Manual approvals bottlenecking delivery
- Stakeholders receiving conflicting numbers in separate reports
When these issues exist, automation can expose the problem faster, not solve it. That is why mature teams standardize the reporting process before they automate distribution.
How to automate reporting without breaking data trust
The safest path is not to automate everything at once. It is to identify high-value reporting workflows, lock down the rules, and then automate in phases with validation built in.
Start with the right dashboards and stakeholder workflows
Not every report should be automated first. The best starting point is a recurring KPI dashboard with high visibility, stable definitions, and a clear consumption pattern.
Prioritize dashboards that are:
- Sent on a recurring cadence such as daily, weekly, or monthly
- Built from relatively stable source systems
- Used by multiple stakeholders
- Painful to prepare manually
- Business-critical enough to justify governance investment
Good first candidates often include:
- Executive performance dashboards
- Sales pipeline and forecast dashboards
- Operations SLA dashboards
- Financial variance dashboards
- Supply chain performance reports
Standardize definitions, ownership, and refresh rules before distribution
Before you automate delivery, define what each KPI means, who owns it, how often it refreshes, and what source system takes precedence.
This is where many projects either succeed or fail.
Key Metrics (KPIs)
- Data freshness: How current the data is when stakeholders view the dashboard.
- Refresh success rate: Percentage of scheduled report refreshes completed without failure.
- Metric consistency: Degree to which the same KPI matches across dashboards, reports, and departments.
- Data accuracy rate: Percentage of values that reconcile correctly to approved source systems.
- Exception volume: Number of failed checks, anomalies, or records requiring intervention.
- Time to publish: Time required from source data availability to stakeholder-ready dashboard delivery.
- Manual touchpoints: Number of human interventions still required in the workflow.
- Stakeholder adoption: Frequency of dashboard usage by intended audiences.
- Audit traceability: Ability to track who changed logic, data, access, or outputs.
- Alert resolution time: Time needed to investigate and resolve automation failures or data anomalies.
These KPIs help enterprise teams measure both efficiency and trust. If you only track speed, you risk automating weak reporting habits.
Build validation checkpoints so automated outputs remain accurate and auditable
Reliable automation includes controls before, during, and after refresh. Experienced teams do not trust unattended workflows without verification layers.
Build checkpoints such as:
- Source availability checks before refresh starts
- Row count and completeness checks after ingestion
- Reconciliation against control totals
- Duplicate detection logic
- Threshold alerts for unusual KPI swings
- Approval gates for sensitive executive reports
Set thresholds for when human review is still required
Automation should remove repetitive work, not eliminate judgment. Some reports still need human signoff when risk or volatility is high.
Set review rules for cases such as:
- KPI movement beyond a predefined threshold
- Missing source feeds from critical systems
- Significant month-end or quarter-end adjustments
- Regulatory or board-facing reports
- Newly launched metrics not yet proven stable
A practical model is to automate routine delivery while routing exceptions to named owners for review.
Map the reporting workflow end to end
Document the reporting workflow before implementing tools. This reveals hidden dependencies that often undermine trust after go-live.
Map the full process across:
- Source systems
- Data extraction methods
- Transformation steps
- KPI calculation logic
- Review and approval points
- Dashboard refresh timing
- Distribution channels
- Archive and audit storage
This exercise often surfaces spreadsheet-based corrections, offline calculations, and undocumented assumptions that should never remain invisible in an automated enterprise reporting process.
Create governance rules that scale
Governance is what separates a useful dashboard from an enterprise-grade reporting system. If teams cannot tell who owns a KPI, who approved a change, or who accessed a sensitive report, trust erodes quickly.
At a minimum, establish:
- Named data owners for each KPI domain
- Escalation paths for refresh failures and data incidents
- Version control for business logic and templates
- Role-based access permissions
- Audit trails for access, edits, approvals, and exports
- Formal change management for metric updates
Strong governance reduces confusion and helps reporting automation survive team changes, system migrations, and growth.
Core components of a reliable reporting automation system
A dependable reporting automation architecture is not just a dashboard tool with a scheduler. It is a connected system of data integration, business logic, delivery controls, and ongoing monitoring.
Core elements required for this scenario
- Data source integration: Connect ERP, CRM, warehouse, finance, and operational platforms reliably.
- Transformation layer: Clean, join, and shape raw data into reporting-ready structures.
- Semantic layer: Standardize KPI definitions so different teams use the same business logic.
- Dashboard delivery layer: Present the right view for executives, managers, and analysts.
- Scheduling engine: Trigger refreshes and distribution on fixed or event-based schedules.
- Alerting mechanism: Notify owners when refreshes fail, thresholds break, or anomalies appear.
- Exception handling: Route edge cases or failed validations to humans for review.
- Distribution controls: Send dashboards, exports, or links based on role and reporting cadence.
- Logging and monitoring: Track execution history, user activity, failures, and performance over time.
- Reconciliation process: Compare outputs with trusted controls to validate reporting accuracy.
Designing for accuracy from the start
Accuracy should be engineered into the workflow, not inspected at the end.
That means aligning source systems to KPI logic before dashboards are published. If finance recognizes revenue one way while sales reports bookings another, the system must reflect that difference clearly rather than masking it behind a single top-line figure.
Best-practice controls include:
- Source-to-target mapping documentation
- Control totals by table or subject area
- Automated checks for nulls and missing data
- Duplicate record detection
- Outlier and variance alerts
- Historical trend comparisons
Designing for adoption across the business
A technically accurate dashboard can still fail if the business cannot use it confidently.
Enterprise adoption improves when dashboards are designed around role-specific decisions:
- Executives need summarized KPIs, trends, exceptions, and commentary.
- Managers need drill-downs, team comparisons, and operational follow-up views.
- Analysts need detail tables, filters, and traceability into source logic.
Keep dashboards readable and self-service friendly by using:
- Plain-language KPI labels
- Consistent time periods
- Standard color logic
- Clear thresholds and alert indicators
- Embedded notes for metric definitions or caveats
Tools and platforms to consider for enterprise report automation
Choosing a stack depends on scale, governance requirements, existing architecture, and internal skills. The goal is not to buy the most tools. It is to build a reporting system that is maintainable and trusted.
What to look for in automation tools
When evaluating tools to automate reporting, look beyond dashboard visuals. Enterprise reporting requires operational control.
Key selection criteria include:
- Support for scheduled refresh and delivery
- Approval workflows for sensitive reports
- Role-based access and permission management
- Integration with warehouse, ERP, CRM, and existing BI environments
- Export and distribution options across teams
- Logging, monitoring, and failure notifications
- Change tracking and version control support
- Scalability for multi-department rollout
- Low maintenance overhead after deployment
For many enterprises, the real cost is not licensing. It is the ongoing burden of keeping logic aligned, refreshes stable, and stakeholders confident in the outputs.
Example implementation patterns
A Power BI-centered approach
Some organizations standardize executive KPI reporting around Power BI because it integrates well with Microsoft-centric environments. In this model, Power BI handles dashboard visualization, while upstream pipelines prepare governed datasets and workflow tools manage report delivery or approvals.
This works well when:
- Microsoft tooling is already widely adopted
- Executive reporting needs are standardized
- IT wants centralized access control
- Data models can be governed centrally
A modular stack approach
Other enterprises separate responsibilities across multiple layers:
- A pipeline tool for ingestion and transformation
- A warehouse for governed data models
- A semantic or metrics layer for standard definitions
- A BI platform for dashboards
- A workflow or automation tool for report distribution
- A testing or observability layer for data reliability
This model offers flexibility, but it also increases integration complexity. Without strong ownership, modular architectures can create more maintenance overhead than expected.
Common risks, rollout mistakes, and how to avoid them
Most reporting automation failures are not caused by automation itself. They come from automating broken definitions, unstable data, or unmanaged stakeholder expectations.
Common rollout mistakes
- Automating unclear metrics before standardization
- Ignoring hidden spreadsheet fixes in the current workflow
- Assuming dashboard publication equals reporting completion
- Skipping validation and reconciliation controls
- Underestimating training and change management
- Removing human review from high-risk reports too early
A dashboard is not a finished product. It is a living reporting system that needs monitoring, ownership, and iterative improvement.
Signs your automated reporting process is drifting
If trust starts to weaken after go-live, the warning signs are usually visible before stakeholders formally escalate.
Watch for:
- Frequent manual overrides
- Unexplained KPI swings
- Rising stakeholder questions about number accuracy
- Delivery failures or broken refresh schedules
- Different reports showing conflicting results
- Growing dependence on analysts to explain basic outputs
These are signals that your automation workflow needs review, not just a technical patch.
A phased rollout plan for enterprise teams
As a consultant, I strongly recommend a staged implementation rather than a big-bang transformation.
Step 1: Select one reporting domain
Choose a dashboard with clear business value, stable ownership, and recurring delivery needs. Executive sales, finance variance, or operations performance are common starting points.
Step 2: Lock down metric definitions and workflow rules
Document KPI logic, source mappings, refresh timing, exception rules, approvals, and recipients before any automation is built.
Step 3: Implement validation and monitoring
Add freshness checks, reconciliations, anomaly detection, and refresh logs so the system can prove reliability from day one.
Step 4: Pilot with a controlled audience
Roll out to a small stakeholder group first. Capture feedback on clarity, trust, timing, and usability before expanding distribution.
Step 5: Expand to adjacent functions
Once the first dashboard proves dependable, reuse governance patterns and templates across related reporting domains.
Success should be measured through:
- Faster report delivery
- Higher data accuracy
- Reduced manual effort
- Greater stakeholder adoption
- Fewer escalations over conflicting numbers
How to sustain trust after automation goes live
Automation is not the finish line. Enterprise trust depends on how well the reporting system adapts as the business changes.
Review KPI definitions regularly as systems, processes, and organizational ownership evolve. A metric that was valid last year may become misleading after a pricing model change, ERP migration, or restructuring of business units.
To sustain trust over time, maintain:
- Quarterly KPI definition reviews
- Feedback loops with business stakeholders
- Incident reviews after refresh failures or data mismatches
- Monitoring for adoption, latency, and exception trends
- Transparent documentation for metric lineage and ownership
The long-term goal is balance: automate reporting enough to remove manual friction, but preserve enough transparency that leaders understand where the numbers came from and when intervention is needed.
Building this manually is complex; use FineReport to automate the workflow with trust built in
Building this manually is complex; use FineReport to utilize ready-made templates and automate this entire workflow. For enterprise teams, FineReport helps connect data sources, standardize KPI dashboards, schedule refreshes, distribute reports securely, and support governed reporting operations without relying on fragile spreadsheet chains.
That matters when your organization needs more than a dashboard. It needs a reporting system that executives trust, managers use, and analysts can maintain at scale.

Get Ready-to-Use Dashboard Templates in Fine Gallery
FineReport is especially well-suited for enterprise reporting automation because it supports:
- Multi-source data integration
- Scheduled dashboard refresh and report distribution
- Role-based access control
- Reusable templates for KPI dashboards
- Governed delivery for recurring management reporting
- Flexible layouts for executives, managers, and analysts
If your current reporting process still depends on manual exports, spreadsheet fixes, and last-minute checks, this is the moment to modernize the workflow without sacrificing trust.
FAQs
Automated reporting replaces manual recurring tasks with scheduled workflows, while faster reporting only shortens delivery time. Trust comes from consistent definitions, validated logic, and clear audit trails, not speed alone.
Start with recurring dashboards that are business-critical, widely used, and based on relatively stable source systems. Executive, sales, operations, and financial variance dashboards are often strong first candidates.
Standardize KPI definitions, assign ownership, and add validation checkpoints before and after refreshes. Teams should also track exceptions, refresh success, and reconciliation to approved source systems.
Common risks include inconsistent metric definitions, hidden spreadsheet adjustments, mismatched source update cycles, and weak governance. Automation can spread these issues faster if the reporting process is not standardized first.
Yes, FineReport can help teams schedule dashboard refreshes, distribute reports automatically, and support governed reporting workflows. To maintain trust, the setup still needs clear business rules, data ownership, and auditability.


The Author
Yida Yin
FanRuan Industry Solutions Expert
Related Articles

ERP Reporting Explained: What It Is, How It Works, and Why Enterprise Teams Rely on It
ERP reporting is the process of turning data inside your enterprise resource planning system into usable business insight. For finance leaders, operations directors, supply chain managers, and IT teams, that matters beca
Yida Yin
Jun 25, 2026
8 Best Restaurant Reporting Software Tools for 2026: Compare FineReport, Toast, SpotOn & More
$1 is a highly customizable business intelligence and reporting platform that helps restaurants turn POS, labor, inventory, finance, and multi location data into real time dashboards and decision ready reports. 8 Best Re
Yida Yin
Jun 24, 2026

Database Reporting Architecture: When to Use a Reporting Database vs Your Operational System
$1 is not just about pulling data into a dashboard. It is an architecture decision that affects application performance, reporting speed, data trust, and how confidently your teams can make decisions. If you are an IT ma
Yida Yin
Jun 24, 2026